1Joint First Authors with Equal Contribution, Pharm D Intern, Department of Pharmacy Practice, Krupanidhi College of Pharmacy, Rajiv Gandhi University of Health Sciences, Carmelaram – 560035, Karnataka, India
2Second Author, Assistant Professor, Department of Pharmacy Practice, Krupanidhi College of Pharmacy, Rajiv Gandhi University of Health Sciences, Carmelaram – 560035, Karnataka, India
Background: Anti-tuberculosis drug-induced liver injury (AT-DILI) is one of the major reasons that can lead to treatment interruptions in tuberculosis patients. In the current research, we intend to investigate and evaluate the association between anti-tubercular medications and changes in serum liver enzyme patterns. Methods: An observational study was conducted to assess the impacts of anti-tubercular drugs on liver function tests in different individuals. Study was conducted among 75 subjects, 3 (4%) subjects were lost to follow-up during study. After gaining informed consent form from the patients or their legal representatives, any individuals who fit the study's eligibility requirements were included to the study. The required data from each patient was obtained and analysed using descriptive statistics. Results: SGPT is found to be elevated after 2 months of ATT moderately in 55.55% of patients and is >80 IU/L in 16.66% of patients. SGOT is observed to be elevated after 2 months of ATT moderately in 68.05% of patients and is >100 IU/L in 8.33% of patients. The Complete Blood Count values before and after 6 months of treatment were also assessed. CONCLUSION: The anti-tubercular therapy has a statistically significant effect on the liver function tests especially after intensive phase of therapy. DILI is the most frequent type of anomaly to which most of the patients were found to be well tolerant while few required intrusions in the therapy. The impact of anti-tubercular therapy on blood picture was found to be relatively mild.
Mycobacterium tuberculosis complex (MTBC) may have coexisted alongside humankind for fifteen thousand years, explaining the historical occurrence of human tuberculosis(1). Mycobacterium tuberculosis is an aerobic, rod-like, non-spore-forming bacterium that causes tuberculosis infections. Usually, 0.5 micrometre by 3 micrometre in size, mycobacteria are classified as acid-fast bacilli and have a unique cell wall composition that is vital to their survival. The well-developed cell wall's peptidoglycan forms a superior lipid barrier by covalently bonding a significant portion of the lipid mycolic acid to the basal carbohydrate arabinogalactan(2).
Droplets in the respiratory system are how tuberculosis is spread from person to person. While some individuals who have tuberculosis go on to develop active disease, most tuberculosis infections are asymptomatic and stay latent (3). Even with the slight decrease in tuberculosis notifications that was noted in 2020 and 2021, NTEP recovered and exceeded these figures. A surpassing record of 242.2 lakh of TB cases was documented in 2022, marking a major milestone in India's surveillance efforts. This corresponds to a notification rate of roughly 172 instances for every lakh people (4).
It is estimated that approximately one-third of people on the globe carry tuberculosis infection, indicating that the disease still has a large worldwide impact (5). In 2022, TB was the second most prevalent contagious agent-related reason for mortality globally, after COVID-19. In 2022, the official TB death toll (1.13 million) nearly doubled the AIDS death toll (0.63 million) globally (6).
Sputum smear microscopy, chest X-ray, Mycobacterium tuberculosis bacilli culture, and tuberculin skin test are the primary methods for diagnosing pulmonary tuberculosis (7). Over the past century, there has not been much of a change in diagnostic testing for both active disease and Latent Tuberculosis Infection (LTBI). The primary means for diagnosing LTBI lately was the tuberculin skin test (TST). Since the areas most affected by HIV infection are also highly infected with tuberculosis, this diagnostic technique is particularly troublesome given the increased risk of smear-negative TB in HIV patients, especially those who have severe immunosuppression (3).
The treatment strategy is called directly observed treatment (DOT); short course chemotherapy (SCC) is another name for the regimen. The recommended course of treatment includes, isoniazid, rifampicin, pyrazinamide, ethambutol, and streptomycin between six and nine months. According to the Revised National TB Control Programme, the treatment is divided into two phases: an initial, intense phase and a second, continuing phase (8).
The TB epidemic is significantly influenced by risk factors related to both economic and social growth as well as health. Prominent physiological risk factors for TB include diabetes, HIV infection, alcohol use disorders, tobacco use, and nutritional deficiencies. More general aspects of society which contribute to tuberculosis also include residing in formal settlements, poverty, social protection, and availability to clean fuels (4).
Even though 85% of TB cases are effectively treated, considerable morbidity from treatment-related adverse effects, such as hepatotoxicity, skin responses, gastrointestinal, and neurological diseases, reduces the efficacy of therapy. The most frequent side effect that causes patients to stop taking their medication is hepatotoxicity, which affects 11% of patients receiving isoniazid, rifampicin, and pyrazinamide together (9).
AT-DILI is among the major reasons that can lead to treatment interruptions in tuberculosis patients (10). Patients who are impacted experience higher rates of morbidity and mortality as a result. Malnutrition is a cause as well as an effect of tuberculosis. One of the most common causes of secondary immunodeficiency in the globe is malnutrition, which can lead to immune system malfunction (11).
One of the most prevalent subtypes of idiosyncratic hepatotoxicity in the globe is caused by anti-TB medications. The features of the specific cohort, the treatment regimens utilized, the threshold used to define hepatotoxicity, and the reporting and monitoring procedures all have a significant impact on the incidence of hepatotoxicity caused by anti-TB drugs. In general, 5%–28% of patients on anti-TB medication have been documented to have hepatotoxicity linked to the medication (12).
The prevalence of AT-DILI varies greatly, ranging from 2% to 28%, depending on the specific cohort's features, the medication regimens utilized, and the combination of liver enzymes and bilirubin thresholds used to diagnose DILI (13). Anti-TB DILI can present with a range of clinical manifestations, including moderate asymptomatic increase of Alanine Transaminase and Aspartate Transaminase, acute hepatitis, or even liver failure (14).
Additionally, there is some evidence linking pulmonary tuberculosis to persistent symptoms and a significant decline in quality of life. Following the conclusion of TB treatment, a high prevalence of self-reported symptoms has been documented. Improved comprehension and management of airflow obstruction and respiratory symptoms following TB are imperative (15).
To the best of our knowledge, a combination of medications may cause adverse effects on the body's organs. Patient-to-patient variations in these side effects may result from behavioural and cultural factors (16).
Therapy failure occurs when a patient stops taking their medicine or refuses therapy on their own initiative because they are uncomfortable owing to abnormal liver function or liver injury. Improving treatment compliance and halting additional liver function decline can be achieved by implementing early treatments to target major risk factors (10).
In certain instances of drug-induced hepatitis, patients may experience hypersensitivity to antituberculosis medications, particularly if they also exhibit concurrent arthralgia, fever, eosinophilia, and skin rash. A changed antioxidant profile accompanied by elevated lipid peroxidation may indicate that oxidative damage is a mediating factor in the hepatotoxicity caused by isoniazid and rifampicin (17).
As mentioned before, the combined hepatotoxicity of isoniazid and rifampicin could result from either additive or synergistic effects. A plausible explanation could be the intensification of hepatic metabolism-related hepatotoxicity due to monoacetyl hydrazine, hydrazine, and associated chemicals via enzyme induction (17).
Several studies have been conducted worldwide to determine the extent of drug-induced haematological abnormalities. Various reports revealed that tuberculosis patients experience abnormal haematopoiesis. Research on haematological alterations linked to tuberculosis therapies has been conducted globally (18).
Therefore, our goal in the present research is to assess the frequency of hepatotoxicity and changes patterns of liver function tests during therapy. The other parameters intended to evaluate include the sociodemographic profile scale and haematological profile of the study subjects.
METHOD
This is an observational study conducted for 6 months February 2024 to August 2024 in Department of Tuberculosis and Respiratory Medicine, MVJ Medical College and Research Hospital, Bangalore. The Institutional Ethics Committee gave its approval before the study could begin. For this study we engaged 75 in-patients having a diagnosis of active TB-infection (pulmonary-TB and extrapulmonary-TB) considering the inclusion criteria of patients receiving first anti-TB therapy, within the age category 18-90 years and patients who completed or will be completing the treatment course of 6 months and exclusion criteria of patients diagnosed with liver diseases (such as viral hepatitis and alcoholic liver disease) and other comorbidities known to effect liver enzymes, patients reluctant to take part in the research and pregnant and lactating women. All patients who meet the study criteria were enrolled in to the study after taking the consent from the patients or their legal representatives. A particularly designed case report form was employed to collect all the necessary patient information.
Statistical analysis was performed using MS-Excel. The normally probability plot was used to determine the distribution normality, which informed the choice of descriptive statistical methods. All descriptive data was represented using mean, median, standard deviation, and ranges. The input data from a structured format was visualized in patterns using charts.
RESULTS
The research study was conducted to assess how ATT affected liver function tests in different individuals. Study was conducted among 75 subjects, 3 (4%) subjects were lost to follow-up during the course study in respiratory medicine ward of MVJ Medical College and Research Hospital.
3.1. Sociodemographic profile scale: During this study period a total 72 subjects diagnosed with tuberculosis were selected for study. Patients in this study were categorised based on their age, gender, alcohol consumption and tobacco smoking, history of liver disease, body mass index (BMI), and co morbid conditions respectively.
|
Characteristics |
No (n) |
Percentage (%) |
|
|
Age (years) |
18-25 yrs. |
10 |
13.9 |
|
26-40 yrs. |
23 |
31.9 |
|
|
41-60 yrs. |
19 |
26.4 |
|
|
61-75 yrs. |
17 |
23.6 |
|
|
Above 75 yrs. |
3 |
4.2 |
|
|
Gender |
Male |
50 |
69.4 |
|
Female |
22 |
30.6 |
|
|
BMI (kg) |
< 18.5 |
25 |
34.7 |
|
18.5-24.9 |
42 |
58.3 |
|
|
25-39 |
5 |
6.9 |
|
|
Alcohol Consumption |
Yes |
12 |
16.7 |
|
No |
60 |
83.3 |
|
|
Smoking Status |
Smoker |
14 |
19.4 |
|
Non-smoker |
58 |
80.6 |
|
Table 1 – Sociodemographic Profile Scale
3.1.1. Distribution based on Co morbidity: Among 72 subjects, 2 subjects (2.8%) have AIDS, 2 subjects (2.8%) have Pneumonia, 1subject (1.4%) have Asthma, 9 subjects (12.5%) have COPD, 19 subjects (26.4%) have Type 2 Diabetes mellitus, and 14 subjects (19.5%) have Hypertension.
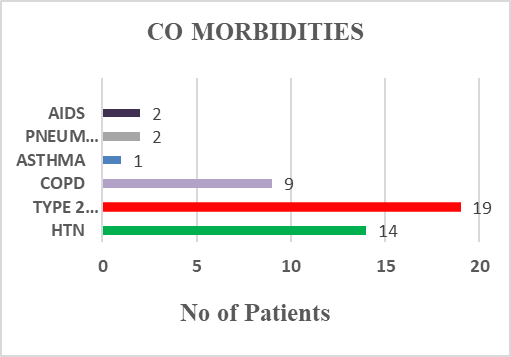
Fig 1 – Distribution based on Co morbidity
3.2. Liver function tests (LFT) changes: Pre and Post anti – tubercular therapy.
3.2.1. Changes in Serum Glutamic Pyruvic Transaminase (SGPT) Patterns: SGPT is elevated after 2 months of ATT moderately in 55.55% of patients and is >80 IU/L in 16.66% of patients. These values return to normal in maximum number of patients (i.e., 83.33%) after 6 months of treatment.
3.2.2. Changes in Serum Glutamic Oxaloacetic Transaminase (SGOT) Patterns: SGOT is elevated after 2 months of ATT moderately in 68.05% of patients and is >100 IU/L in 8.33% of patients. These values return to normal in maximum number of patients (i.e., 76.38%) after 6 months of treatment.
3.2.3. Changes in Alkaline Phosphatase (ALP) Patterns: ALP is elevated after 2 months of ATT moderately in 72.22% of patients and is >200 IU/L in 15.27% of patients. These values return to normal in maximum number of patients (i.e., 75%) after 6 months of treatment.
|
INVESTIGATIONS |
No of Patients |
Percentage |
||||
|
Before ATT |
2 months after ATT |
6 months after ATT |
Before ATT |
2 months after ATT |
6 months after ATT |
|
|
SGPT (IU/L) |
||||||
|
Normal (0-40) |
70 |
20 |
60 |
97.22% |
27.77% |
83.33% |
|
40-80 |
2 |
40 |
12 |
2.77% |
55.55% |
16.66% |
|
>80 |
0 |
12 |
0 |
0 |
16.66% |
0 |
|
SGOT (IU/L) |
||||||
|
Normal (0-40) |
71 |
17 |
55 |
98.61% |
23.61% |
76.38% |
|
41-100 |
1 |
49 |
17 |
1.38% |
68.05% |
23.61% |
|
>100 |
0 |
6 |
0 |
0 |
8.33% |
0 |
|
Direct Bilirubin (mg/dL) |
||||||
|
Normal (0-0.4) |
70 |
10 |
28 |
97.22% |
13.88% |
38.88% |
|
0.5-1 |
2 |
56 |
43 |
2.77% |
77.77% |
59.72% |
|
>1 |
0 |
6 |
1 |
0 |
8.33% |
1.38% |
|
Total Bilirubin (mg/dL) |
||||||
|
Normal (0.3-1.2) |
72 |
12 |
45 |
100% |
16.66% |
62.5% |
|
1.3-2 |
0 |
44 |
23 |
0 |
61.11% |
31.94% |
|
>2 |
0 |
16 |
4 |
0 |
22.23% |
5.55% |
|
ALP (IU/L) |
||||||
|
Normal (45-129) |
60 |
9 |
54 |
83.33% |
12.5% |
75% |
|
130-200 |
12 |
52 |
18 |
16.66% |
72.22% |
25% |
|
>200 |
0 |
11 |
0 |
0 |
15.27% |
0 |
|
Serum Albumin (gm/dL) |
||||||
|
Normal (<3.5) |
34 |
16 |
14 |
47.22% |
22.22% |
19.44% |
|
3.6-5.2 |
36 |
29 |
39 |
50% |
40.27% |
54.16% |
|
>5.2 |
2 |
27 |
19 |
2.77% |
37.5% |
26.38% |
Table 2 - Percentage Variation in LFT Levels: Pre and Post Treatment.
3.3. Complete Blood Count (CBC) changes: Pre and Post anti – tubercular therapy
3.3.1. Changes in Haemoglobin (Hb) Patterns: Percentage of patients with Hb < 12gm% increased from 34.7% to 47.2% before and after ATT respectively whereas the percentage of patients with Hb range 12-15 gm% reduced from 63.8% to 51.3% before and after ATT respectively.
3.3.2. Changes in Total Leukocyte Count (TLC) Patterns: Percentage of patients with TLC between the range 4000 – 11000 cells/cu.mm and >11000 cells/cu.mm were slightly elevated after ATT.
3.3.3. Changes in Red Blood Cells (RBC) Patterns: Percentage of patients with RBC<4.35million cells/cu.mm decreased from 29.1% to 26.3% before and after ATT respectively whereas the percentage of patients with normal RBC range increased from 65.2% to 72.2% before and after ATT respectively.
|
INVESTIGATIONS |
No of Patients |
Percentage |
||
|
Before ATT |
After ATT |
Before ATT |
After ATT |
|
|
Hemoglobin (gm%) |
||||
|
<12 |
25 |
34 |
34.7% |
47.2% |
|
12-15 |
46 |
37 |
63.8% |
51.3% |
|
15-18 |
1 |
1 |
1.3% |
1.3% |
|
TLC (cells/cu.mm) |
||||
|
<4000 |
2 |
0 |
2.7% |
0% |
|
4000-11000 |
36 |
37 |
50% |
51.8% |
|
>11000 |
34 |
35 |
47.2% |
48.6% |
|
RBC (million/cu.mm) |
||||
|
<4.35 |
21 |
19 |
29.1% |
26.3% |
|
4.35-5.65 |
47 |
52 |
65.2% |
72.2% |
|
>5.65 |
4 |
1 |
5.55% |
1.3% |
|
Platelet count (lakh/cu.mm) |
||||
|
<1.5 |
6 |
7 |
8.3% |
9.7% |
|
1.5-4.5 |
62 |
64 |
86.1% |
88.8% |
|
>4.5 |
4 |
1 |
5.5% |
1.3% |
|
Packed Cell Volume (%) |
||||
|
<32 |
10 |
24 |
13.89% |
33.34% |
|
32-47 |
58 |
46 |
80.5% |
63.89% |
|
>47 |
4 |
2 |
5.56% |
2.78% |
|
Mean Corpuscular Volume (MCV) (fL) |
||||
|
<82 |
24 |
19 |
33.3% |
26.3% |
|
82-96 |
37 |
37 |
51.3% |
51.3% |
|
>96 |
11 |
16 |
15.2% |
22.2% |
|
Mean Corpuscular Hemoglobin (MCH) (pg) |
||||
|
<27.5 |
30 |
38 |
41.6% |
52.7% |
|
27.5-32.2 |
37 |
27 |
51.3% |
37.5% |
|
>32.2 |
5 |
7 |
6.9% |
9.7% |
|
Mean Corpuscular Hemoglobin Concentration MCHC) (g/dL) |
||||
|
<32 |
26 |
52 |
36.1% |
72.2% |
|
32-36 |
39 |
16 |
54.1% |
22.2% |
|
>36 |
7 |
4 |
9.7% |
5.5% |
Table 3 - Percentage Variation in CBC: Pre and Post Treatment
|
INVESTIGATIONS |
Before ATT (mean±SD) |
2 months after ATT (mean±SD) |
6 months after ATT (mean±SD) |
|
SGPT (IU/L) |
18.28±8.53 |
57.63±23.34 |
32.27±9.05 |
|
SGOT (IU/L) |
19.47±7.23 |
54.73±28.16 |
31.47±10.83 |
|
ALP (IU/L) |
91.94±35.12 |
163.72±34.11 |
104.80±29.80 |
|
DIRECT BILIRUBIN (mg/dL) |
0.21±0.10 |
0.72±0.26 |
0.54±0.25 |
|
TOTAL BILIRUBIN (mg/dL) |
0.57±0.2 |
1.57±0.48 |
1.18±0.46 |
|
SERUM ALBUMIN (g/dL) |
3.47±0.67 |
4.49±1.21 |
4.34±1.01 |
Table 4 - Effect of anti – tubercular treatment before, after 2 months and after 6 months on LFT
|
INVESTIGATIONS |
Before ATT (mean±SD) |
After ATT (mean±SD) |
|
HEMOGLOBIN (gm%) |
12.21±1.96 |
12.17±2.01 |
|
TLC (cells/cu) |
11283.34±4404.70 |
10941.25±3859.52 |
|
RBC (million/cu) |
4.59±0.66 |
4.61±0.46 |
|
PLATELET COUNT (lakh/cu.mm) |
2.93±1.01 |
2.73±0.90 |
|
PCV (%) |
37.92±5.95 |
36.40±5.27 |
|
MCV (fL) |
86.2±8.91 |
88.29±9.66 |
|
MCH (pg) |
28.14±3.11 |
27.29±3.26 |
|
MCHC (g/dL) |
33.07±2.10 |
31.04±2.39 |
Table 5 – Effect of anti – tubercular treatment before and after 6 months on CBC
DISCUSSION
One of the most typical side effects of anti-TB treatment is drug-induced hepatitis. Thus, it is essential to regularly monitor liver function test results to avoid negative outcomes (19).
In the present study, the evaluation of demographics among the study subjects was performed. Most of the patients were between the age group 26-40 years, then 41-60 years. Male subjects had a higher frequency of tuberculosis than female subjects. The body mass index assessment was performed and it was found that over 50% of the individuals enrolled in the study had normal BMI whereas 34.7% of patients were underweight. The alcohol consumption and tobacco smoking status of the patients was also evaluated. Type-2-diabetes mellitus was found to be the most prevalent comorbidity followed by hypertension and COPD. Very few patients presented with asthma, pneumonia, and AIDS.
76% of patients in research by Rupam Kumar T A et al. had impaired concentrations of liver enzymes (that is, SGPT and SGOT). Just 16.7% and 28.9%, respectively, had no increment in SGPT and SGOT. Thus, the research population exhibited a common adaptive response to ATT (1). In the current study, the enzymes SGPT and SGOT showed elevations after an initial intensive phase of therapy which were normal before the start of therapy. These elevations tend to normalize as the therapy is continued.
The process of developing DILI is complex and involves both sequential and concurrent processes. Drug-specific pathways that are initiated by specific medications or their metabolites are among the important upstream events. An initiating event is most likely to be increased reactive metabolite production or detoxification failure. These reactive metabolites cause an overabundance of reactive oxygen species (ROS), which causes cell death and lipid per oxidation. Events that follow initial drug metabolism may have an impact on the occurrence and severity of liver damage. In recent times, studies have demonstrated that DILI might be mediated by inhibiting a histone change. Histone acetyltransferases are enzymes that facilitate histone acetylation, which opens the chromatin structure and allows genes to be read in that region (12).
The occurrence and natural history of this phenomena has been documented, which is sometimes referred to as "adaptation," using precise case definitions; the underlying processes of this phenomenon remain to be discovered (13).
In a study conducted by Kassa et al, medication-naïve TB patients had somewhat greater haemoglobin concentration and PCV than those receiving anti-TB medication. When anti-TB medication was started, the total number of white blood cells in TB patients was comparatively like the total white blood cell count at the conclusion of the intensive treatment phase. The MCV measurements before and after treatment did not significantly differ from one another. However, the differences in the MCH and MCHC values were statistically significant when the data were examined before and after the intensive stage of TB treatment ended (18).
In our current study, there is slight decrease in the haemoglobin and RBC levels after therapy compared to before initiation of treatment. A chronic infection, such as tuberculosis, can result in anaemia. Many Patho physiologies have been proposed for TB-associated anaemia, but most studies have demonstrated that inflammatory mediators decrease erythropoiesis, which is the root cause of anaemia (18).
It was observed that platelet counts slightly decrease after completion of therapy, but is not considered as an area of concern as it remains within the normal range. The MCV and MCH values remain normal and there were no obvious statistically significant changes in these levels before and after ATT. MCHC was slightly reduced below the normal range after completion of therapy.
5.6% (4 out of 72) of patients reported drug-induced hepatitis which was confirmed by evaluation of signs and symptoms and liver function tests. Five patients out of 114 treated cases in research by Rupam Kumar T A et al. developed hepatitis and had their therapy interrupted; the remaining patients were able to continue their treatment without experiencing any symptoms (1).
Drug-induced hepatotoxicity primarily results from hypersensitivity reactions, which might present clinically as fever, rash, or eosinophilia (14). The most common symptoms reported in our study include nausea, vomiting, loss of appetite, generalized weakness and urticaria. The treatment was interrupted due to incidence of drug-induced hepatitis for a period of 1-2 weeks during which the patients were closely monitored and retreatment was started after the liver enzymes returned to normal.
Since N-acetylcysteine shortens hospital stays, it may be a therapy option for liver damage caused by antituberculosis. In contrast, hepatoprotector medications are used in the treatment of antituberculosis liver damage patients in India (9). In our study, all the patients were prescribed with Pyridoxine Hydrochloride for prevention of peripheral neuritis as a neuroprotectant.
In this study, a female patient reported ATT induced GI intolerance and ethambutol induced ocular toxicity after 1 month of ATT with symptoms such as dyspepsia, haemoptysis, vomiting and blurring vision. The therapy was interrupted till the retrieval of symptoms and ethambutol was replaced with levofloxacin to prevent the progression of ocular degeneration.
Also, a male patient reported generalized xerosis with complaints of itching and scaling noted over the body after intensive treatment phase. This condition was treated with a suitable moisturizer to soothe dryness after which the continuation treatment phase was started.
4 out of 72 (5.6%) patients had to continue ATT for 3 more months after completion of continuation phase and the rest of the study subjects were treated successfully without any treatment interruption or complications. It is equally important to continue monitoring of LFT’s in these patients until completion of therapy.
LIMITATIONS
The study sample size was relatively small therefore; inference of the study has limited value and lower statistical power. Only individuals who were accessible and willing to participate at the time of study had their data collected. We were unable to evaluate how concurrent medication use and comorbidities affected the course of treatment.
CONCLUSION
The antitubercular therapy has a statistically significant effect on the liver function tests especially after intensive phase of therapy. DILI is the most frequent type of anomaly to which most of the patients were found to be well tolerant while few required intrusions in the therapy. Other rare events that were observed include skin complaints such as urticaria and generalized xerosis and ocular toxicity.
The impact of antitubercular therapy on blood picture was found to be relatively mild and does not lead to any significant changes on health outcomes.
The incidence of adverse effects may prolong hospital stay and has impact on both clinical as well as economic outcomes of the treatment. The treatment interruption may lead to development of drug resistance that is unintended. It also encounters economic impact such as increasing the cost of treatment.
Ethical Approval: Ethics Review Board of MVJ Medical College and Research Hospital, Bangalore has granted the approval with IEC No – MVJMC&RH/IEC-117/2024
Declaration of Competing Interest: None declared
Acknowledgements: No acknowledgements
Data Linking: The authors prefer not to provide the data collected in the study as it is unethical to reveal any patient specific information according to Institutional Ethics Committee.
REFERENCES


Rachana M. S.*, Manasa R., Prema S., Dr. Surabhi K. S., Effects Of Anti–Tubercular Drugs on Liver Function Tests – An Observational Study, Int. J. of Pharm. Sci., 2025, Vol 3, Issue 6, 3130-3139. https://doi.org/10.5281/zenodo.15716197
 10.5281/zenodo.15716197
