Vikas Institute of Pharmaceutical Sciences, Rajahmundry.
A simple, precise, and reliable Reverse Phase High-Performance Liquid Chromatography (RP-HPLC) method was developed and validated for the simultaneous estimation of Dorzolamide and Timolol in pharmaceutical formulations. Chromatographic separation was achieved using a Spursil C18-EP column (150 × 4.6 mm, 3 µm) with a mobile phase consisting of methanol and potassium dihydrogen phosphate buffer (70:30, pH 3.5) at a flow rate of 1.0 mL/min and detection at 223 nm. The retention times for Dorzolamide and Timolol were found to be 2.189 min and 3.136 min, respectively, with good peak symmetry and resolution. The method was validated as per regulatory guidelines for parameters including linearity, precision, accuracy, and robustness. The linearity range was found to be 20–100 ppm for Dorzolamide and 5–25 ppm for Timolol with correlation coefficients of 0.999 and 0.9993, respectively. Precision studies showed %RSD values within acceptable limits, indicating good repeatability. Accuracy studies demonstrated satisfactory recovery results within 98–102%. Robustness evaluation confirmed the method’s reliability under slight variations in analytical conditions. Overall, the developed RP-HPLC method was found to be simple, accurate, precise, and suitable for routine quality control analysis of Dorzolamide and Timolol in combined dosage forms.
Reverse Phase High-Performance Liquid Chromatography (RP-HPLC) is a powerful analytical technique widely used to separate and estimate compounds present in complex mixtures. It operates using a non-polar stationary phase and a polar mobile phase, where separation occurs mainly through hydrophobic interactions between analytes and the column. Because of its high sensitivity, precision, and reproducibility, RP-HPLC is extensively applied in pharmaceutical analysis and quality control. Method validation ensures that the developed analytical method is reliable and suitable for accurate, qualitative and quantitative estimation of compounds. International regulatory bodies such as the U.S. Food and Drug Administration, International Council for Harmonisation of Technical Requirements in Pharmaceuticals for human use, and United States Pharmacopeia provide guidelines defining validation parameters like linearity, accuracy, precision, specificity, detection limit, quantification limit, robustness, and ruggedness. Dorzolamide is a topical ophthalmic carbonic anhydrase inhibitor molecular formula is C10H16N2O4S3. IUPAC name is (4S,6S)-4-ethylamino-6-methyl-7,7-dioxo-4,5,6,7-tetrahydro-7λ6-thieno[2,3-b] thiopyran-2-sulfonic acid amide. it is available in ophthalmic formulations in combination with timolol. Carbonic anhydrase inhibitor; blocks enzyme regulating ion balance and fluid pressure in the eyes. Timolol maleate is a non-selective beta-adrenergic antagonist with molecular formula C13H24N4O3S, IUPAC name (S)-1-(tert-butylamino)-3-[(4-morpholin-4-yl-1,2,5-thiadiazol-3-yl) oxy] propan-2-ol. Timolol competes with adrenergic neurotransmitters for binding to beta (1)-adrenergic receptors in the heart and beta (2)-receptors in vascular and bronchial smooth muscle both indication Treatment of elevated intraocular pressure in ocular hypertension or open-angle for glaucoma. It can also be used in tablet form to treat hypertension and, in certain cases, for the prevention of migraine headache.
C13?H24?N4?O3?SMATERIALS AND METHODS:
HPLC grade water, formic acid, acetonitrile, methanol, monopotassium phosphate was used for estimation of dorzolamide and timolol and all drugs . An Electronic Balance (Model: SAB2032) manufactured by Scaletec , An Ultra-Sonicator (Model: SE60US) ,A Thermal Oven (Model: i-THERM A17782) , pH Meter (Model: Orion Star A111) , Filter papers of 0.45-micron pore size ,HPLC System (Model: Waters 2690 Separation Module)
HPLC METHOD DEVELOPMENT: Wavelength selection:
The wavelength selection was carried out by scanning a 10 µg/mL solution of Dorzolamide and Timolol in the diluent (mobile phase composition) using a UV spectrophotometer in the range of 200–400 nm to determine the suitable detection wavelength.
Optimisation of column:
During column optimization, the Spursil 3 µm C18-EP column (150 × 4.6 mm) was selected as it provided good peak shape and satisfactory resolution at a flow rate of 1.0 mL/min.
OPTIMIZED CHROMATOGRAPHIC CONDITIONS:
HPLC with an auto sampler and UV/DAD detector and a Spursil C18-EP column (150 × 4.6 mm, 3 µm) at ambient temperature. The mobile phase consisted of methanol and potassium dihydrogen phosphate buffer (pH 3.5) in the ratio 70:30, with a flow rate of 1.0 mL/min. Detection was performed at 223 nm using an injection volume of 10 µL, and the total run time was 15 minutes.
PREPARATION OF BUFFER AND MOBILE PHASE:
The buffer was prepared by dissolving 1.6 g of KH?PO? in 250 mL of HPLC-grade water.The mobile phase was prepared by mixing buffer and methanol (30:70), then degassed for 5 minutes, filtered through a 0.45 µm membrane filter, and used as the diluent for all solutions.
VALIDATION PARAMETERS:ASSAY:
A standard solution containing 20 mg Dorzolamide and 5 mg Timolol was prepared in 20 mL diluent, and 0.6 mL of this stock was diluted to 10 ml. Standard and sample solutions (20 µL) were injected into the HPLC system, and the peak areas were used to calculate the percentage assay.
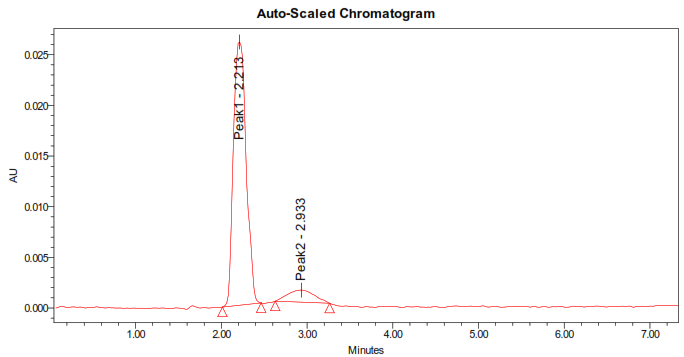
Figure 1: chromatographic conditions
Table 1: Results of Assay for Dorzolamide and Timolol
|
S.No |
Peak name |
Retention time |
Area |
Height |
USP Tailing |
USP plate count |
|
1. |
Dorzolamide |
2.189 |
2440781 |
248834 |
1.25 |
3302 |
|
2. |
Timolol |
3.136 |
224115 |
28834 |
1.22 |
3232 |
LINEARITY: Linearity was determined by preparing calibration solutions from the stock solution to obtain concentrations of 20–100 ppm for concentrations of 20–100 ppm for dorzalamide and 5-25 ppm. Dorzolamide and 5–25 ppm for Timolol. Each solution was injected into the chromatograph and calibration curves were plotted to determine the correlation coefficient.
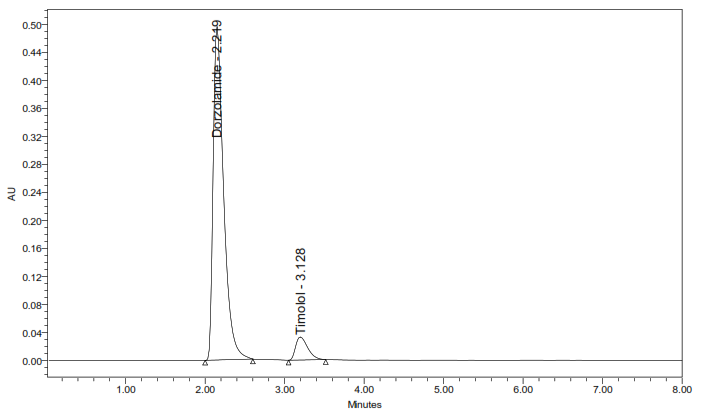
Figure 2: Chromatogram for Linearity
Table 2: Analytical Performance Parameters of Dorzolamide and Timolol
|
Parameters |
Dorzolamide |
Timolol |
|
Slope (m) |
40823 |
14929 |
|
Intercept (c) |
23810 |
1892.4 |
|
Correlation coefficient (R2) |
0.999 |
0.9993 |
PRECISION: Precision was assessed by preparing a working solution from the standard stock and injecting it six times into the HPLC system. The peak areas were recorded and the % relative standard deviation (%RSD) was calculated to evaluate method repeatability.

Figure 3: Chromatogram for Precision -6
Table 3: Results of Precision for Dorzolamide and Timolol
|
Injection |
Area of Dorzolamide |
Area of Timolol |
|
Injection-1 |
2440782 |
224115 |
|
Injection-2 |
2440781 |
223115 |
|
Injection-3 |
2460781 |
224115 |
|
Injection-4 |
2450781 |
225115 |
|
Injection-5 |
2540781 |
226215 |
|
Injection-6 |
2440781 |
227315 |
|
Average |
2462447.8 |
224998.3 |
|
Standard Deviation |
39200.2 |
1547.1 |
|
%RSD |
1.5 |
0.6 |
INTERMEDIATE PRECISION / RUGGEDNESS: Intermediate precision was evaluated by repeating the same analytical procedure on a different day within the same laboratory.
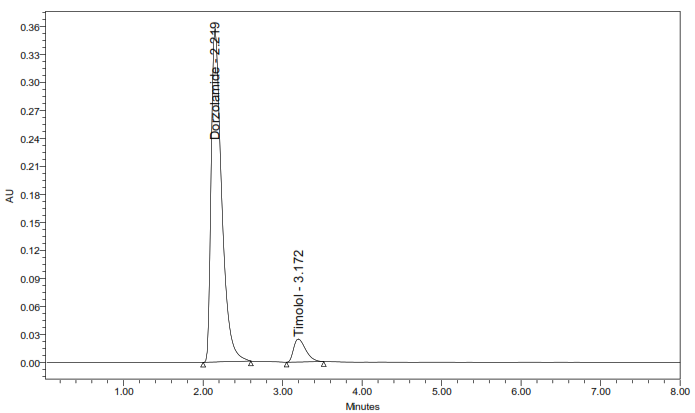
Figure 4: Chromatogram for ID Precision -6
Table 4 : Results of Intermediate precision for Dorzolamide and Timolol
|
Injection |
Area of Dorzolamide |
Area of Timolol |
|
Injection-1 |
2440782 |
224115 |
|
Injection-2 |
2440781 |
223115 |
|
Injection-3 |
2440781 |
224115 |
|
Injection-4 |
2450781 |
224115 |
|
Injection-5 |
2440781 |
224115 |
|
Injection-6 |
2440781 |
224115 |
|
Average |
2442448 |
223948.3 |
|
Standard Deviation |
4082.4 |
408.2 |
|
%RSD |
0.1 |
0.1 |
5. ACCURACY: Accuracy was evaluated by preparing three concentration levels of 50%, 100%, and 150% of the target assay concentration for Dorzolamide and Timolol. The solutions were injected into the HPLC system, and recovery values were calculated by comparing the amount added with the amount found to determine individual and mean recovery.
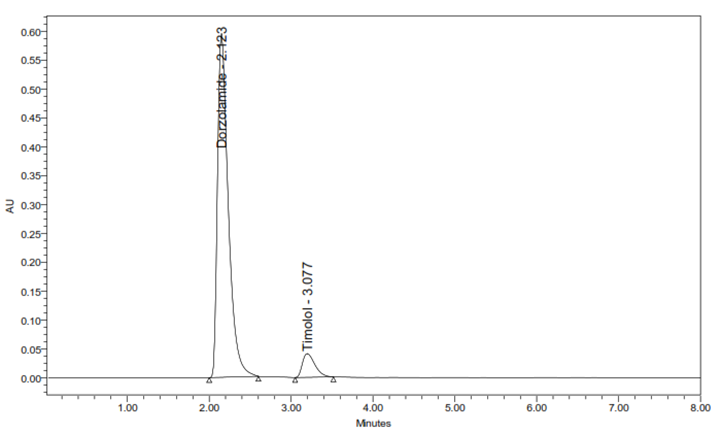
Figure 5: Chromatogram for Accuracy
Table 5: Accuracy (recovery) Data for Dorzolamide and Timolol
|
%Concentration (at specification Level) |
Area* of Dorzolamide |
Amount Added (mg) |
Amount Found (mg) |
% Recovery |
Mean Recovery |
|
50% |
1220390 |
10 |
9.98 |
98.9 |
99.03% |
|
100% |
2440781 |
20 |
19.80 |
99.9 |
|
|
150% |
3661171 |
30 |
29.5 |
98.3 |
|
%Concentration (at specification Level) |
Area* of Timolol
|
Amount Added (mg) |
Amount Found (mg) |
% Recovery |
Mean Recovery |
|
50% |
112057 |
2.5 |
2.45 |
98.0 |
98.9% |
|
100% |
224115 |
5 |
4.95 |
99.0 |
|
|
150% |
336172 |
7.5 |
7.48 |
97.3 |
ROBUSTNESS: Robustness was assessed by making deliberate variations in chromatographic conditions such as flow rate (0.8–1.2 mL/min) and mobile phase composition (30–70% organic phase). Standard solutions of Dorzolamide and Timolol (60 µg/mL) were analysed under these modified conditions to evaluate the reliability of the method.
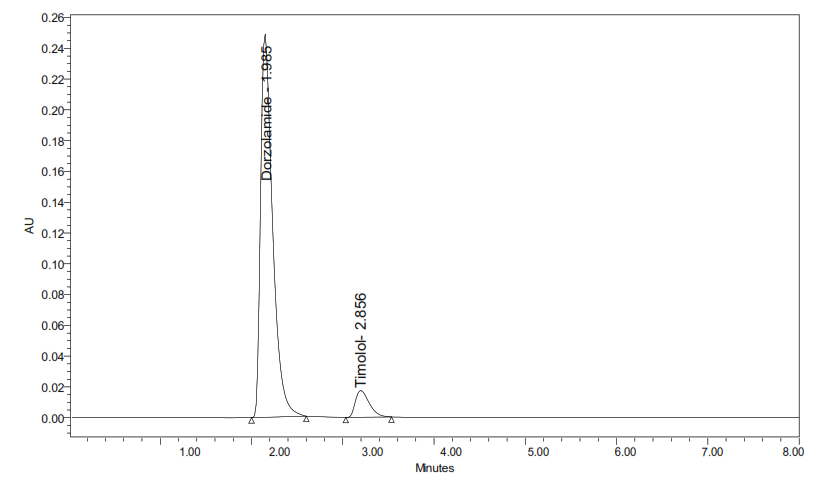
Figure 6: Chromatogram Showing More Organic Composition Mobile Phase
Table 6: Results for variation in flow for Dorzolamide and Timolol
|
S. No |
Flow Rate (ml/min) |
System Suitability Results of Dorzolamide |
|
|
USP Plate Count |
USP Tailing |
||
|
1 |
0.8 |
3299 |
1.21 |
|
2 |
1.0 |
3302 |
1.25 |
|
3 |
1.2 |
3312 |
1.23 |
|
S. No |
Flow Rate (ml/min) |
System Suitability Results of Timolol |
|
|
USP Plate Count |
USP Tailing |
||
|
1 |
0.8 |
3231 |
1.10 |
|
2 |
1.0 |
3232 |
1.22 |
|
3 |
1.2 |
3235 |
1.26 |
Table 7: Results for variation in mobile phase composition for Dorzolamide and Timolol
|
S. No |
Change in Organic Composition in the Mobile Phase |
System Suitability Results Dorzolamide |
|
|||||
|
USP Plate Count |
USP Tailing |
|
||||||
|
1 |
10% less |
3299 |
1.21 |
|
||||
|
2 |
*Actual |
3302 |
1.25 |
|
||||
|
3 |
10% more |
3312 |
1.23 |
|
||||
|
|
S. No |
Change in Organic Composition in the Mobile Phase |
System Suitability Results Timolol |
|||||
|
|
USP Plate Count |
USP Tailing |
||||||
|
|
1 |
10% less |
3231 |
1.10 |
||||
|
|
2 |
*Actual |
3232 |
1.22 |
||||
|
|
3 |
10% more |
3235 |
1.26 |
||||
REFERENCES


P. Geetha Bhavani, A. V. R Gayatri, B. Shanmukha Priya, B. Charishma, B. Revanth Dutt, B. Naga Santhosh, Validated Simultaneous Analysis of Dorzolamide and Timolol Anti-Glaucoma Opthalamic Solutions, Int. J. of Pharm. Sci., 2026, Vol 4, Issue 4, 875-882 https://doi.org/10.5281/zenodo.19493660
 10.5281/zenodo.19493660
