Dept. of Pharmaceutical Quality Assurance, D. S. T. S. Mandal’s College of Pharmacy Solapur
A simple, specific and sensitive UV-vis spectrophotometric method has been developed using buffer pH 1.2 as solvent for the estimation of voriconazole in tablet. The drug shows maximum absorbance at 256 nm. The technique demonstrated a linear response within a concentration range of 10-50 ?g/ml, achieving a correlation coefficient of 0.9999. The precision study shows the % RSD was 0.566. Recovery studies showed accuracy of 101%. The LOD and LOQ found to be 1.57 µg/mL and 4.77 µg/mL respectively. The validation parameter outcomes showed that the method demonstrated accuracy, precision, reproducibility, sensitivity. Therefore, this technique is beneficial for regular quality control assessments for determining voriconazole in solid dosage forms.
Voriconazole [(2R,3S)-2-(2,4-difluorophenyl)-3-(5-fluoropyrimidin-4-yl)-1-(1H-1,2,4-triazol -1-yl)butan-2-ol] is a triazole-based antifungal agent.1 It is BCS class II drug with low solubility and high permeability.2 Voriconazole is used in the treatment of oesophageal candidiasis, invasive pulmonary aspergillosis, and severe fungal infections caused by Scedosporium apiospermum and Fusarium species.3 It inhibits cytochrome P450 enzymes CYP2C9 and CYP3A4.
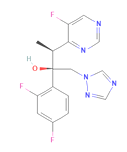
Figure 1 Structure of Voriconazole
The voriconazole is available in both oral and intravenous dosage forms.4 Literature revels that there are few UV-vis spectrophotometry method5,6,7,8 have been developed for the estimation of voriconazole using methanol and phosphate buffer (pH 2.0, 4.0, 6.8, and 7.0) as solvents. However, a method using buffer pH 1.2 has not been reported. Therefore, in the present study, an attempt was made to develop a simple and economical UV-vis spectrophotometric method for the analysis of voriconazole using buffer pH 1.2.
MATERIAL AND METHOD:
2.1 Material:
Voriconazole was obtained as gift sample from Hetero Labs Pvt Ltd, Hyderabad. Methanol and Sodium Hydroxide were from Merck Life Science Pvt. Ltd., while Potassium Chloride was from S D Fine-Chem Ltd. Chemicals and reagents are analytical grade. VorierTM200 was purchased from a local pharmacy. Double beam UV spectrophotometer (Shimadzu 1800) and analytical balance (Shimadzu AY-220) instruments were used.
2.2 Methods:
Preparation Buffer Solution pH 1.2
Weigh 2.982 grams of potassium chloride that has been dissolved in 100 ml of distilled water gives 0.2 M potassium chloride solution. Prepare 0.2 M hydrochloric acid by dissolving 18 ml of concentrated HCl in 1000ml volumetric flask and top it up with distilled water. 50 ml of 0.2M potassium chloride solution was transferred to 200 volumetric flask then 80 ml of 0.2M hydrochloric acid was added and volume was adjusted by distilled water. 9
Preparation of standard solution
10?mg of the voriconazole was weighed, dissolved, and diluted to 10?ml with methanol in a volumetric flask, resulting in a concentration of 1000?μg/ml. 1?ml of this solution was diluted to 10?ml with pH 1.2 buffer solution, yielding a concentration of 100?μg/ml.
Selection of maximum absorption
A 10?μg/ml solution of voriconazole scanned from 400-200 nm using the UV-vis spectrophotometer and λmax was determined from the spectrum.
Linearity
10, 20, 30, 40, and 50 μg/ml of voriconazole solutions were prepared by diluting 1, 2, 3, 4 and 5 ml of the standard solution to 10 ml using buffer pH 1.2 in 10 ml volumetric flasks. Absorbance of these solution was recorded at 256nm using buffer pH 1.2 as a blank reference.
Precision
The precision of an analytical method analyzed by repeatability determined by measuring how closely the results match when the same sample is tested multiple times under set conditions. Absorbance of 20 μg/ml voriconazole solution was recorded and repeated for six times.
Accuracy:
The accuracy of an analytical procedure expresses the closeness of agreement between the value which is accepted either as a conventional true value and the value found. For the recovery study, 1 mL of tablet powder solution B (100?μg/mL) was used. Standard voriconazole solution (100?μg/mL) was added in volumes of 1.6, 2, and 2.4?mL to achieve 80%, 100%, and 120% recovery levels, respectively. Each mixture was then diluted with buffer pH 1.2 to 10?mL in a volumetric flask, and absorbance was measured at 256?nm.
Preparation of tablet powder test solution:
Two voriconazole tablets were accurately weighed, and their average weight recorded. The tablets were triturated to a fine powder, from which 32.265?mg (equivalent to 10?mg of voriconazole) was dissolved and diluted to 10?ml with methanol to prepare Solution A (1000?µg/ml). After filtration, 1?ml of Solution A was diluted to 10?ml with pH 1.2 buffer to obtain Solution B (100?µg/ml).
Preparation for voriconazole tablet assay:
Solution B of 3?ml was further diluted to 10?ml with the same buffer to prepare (30?µg/ml) solution. Absorbance of this solution was measured at 256?nm.
LOD:
The detection limit of an individual analytical procedure is the lowest amount of analyte in a sample which can be detected but not necessarily quantitated as an exact value.
LOD = 3.3?SD/Slope
LOQ:
The limit of quantitation is a particular analytical method refers to the minimum amount of analyte in a sample that can be measured with suitable precision and accuracy. This limit is a vital consideration in quantitative assays aimed at detecting low concentrations of compounds within sample matrices, and it is particularly important for the identification of impurities and degradation products.
LOQ=10?SD/Slope
RESULTS AND DISCUSSION:
Selection of maximum absorption
The wavelength of maximum absorption (λmax) was selected based on the highest absorbance observed in the UV spectrum, identified at 256 nm.
Fig 2. Absorption Spectra of voriconazole
2.3 Validation of Methods:
The validation of developed method has done as per international conference on harmonization (ICH) guidelines. Different parameters including linearity and range, precision, accuracy, limit of detection and limit of quantitation were within the specification limit mentioned in ICH guidelines.10
Linearity and range:
Linearity was performed along the concentration range of 10-50 μg/ ml. A calibration curve graph was plotted with Absorbance on the X-axis and Concentration on the Y-axis Regression Analysis showed R2 value as 0.9999 and the linear equation as y = 0.0229x + 0.014.
Table 1 Results of Linearity
|
Sr no. |
Concentration (μg /mL) |
Absorbance |
|
1 |
10 |
0.246 |
|
2 |
20 |
0.474 |
|
3 |
30 |
0.696 |
|
4 |
40 |
0.930 |
|
5 |
50 |
1.165 |

Figure 3 Calibration curve graph of voriconazole
Figure 4 Overlay Spectra of Voriconazole
Precision:
For the precision study 20 μg/mL solution of voriconazole was used and its absorbance was measured at 256nm using UV spectrophotometer.
Table 2 Precision data of voriconazole standard solution
|
Samples Conc. (μg /mL) |
Absorbance |
|
20 |
0.739 |
|
20 |
0.752 |
|
20 |
0.742 |
|
20 |
0.743 |
|
20 |
0.745 |
|
20 |
0.748 |
|
Mean |
0.7448 |
|
Standard Deviation |
0.00421 |
|
%RSD |
0.56655 |
Accuracy:
The accuracy of the method was assessed by recovery studies. The sample solution is spiked with standards at 80%, 100% and 120% test concentration. The percentage recovery was found to be 101%.
Table 3 Results of accuracy study
|
Level of Recovery |
Tablet powder solution B |
Standard Solution 100µg/ml |
Absorbance |
Concentration (µg/ml) |
Amount found |
|
0 % |
1 ml |
0 ml |
0.222 |
9.08 |
|
|
100 % |
1 ml |
2 ml |
0.688 |
29.43 |
101.75% |
|
80 % |
1 ml |
1.6 ml |
0.600 |
25.58 |
103.12% |
|
120 % |
1 ml |
2.4 ml |
0.780 |
33.44 |
101.5 % |
|
0 % |
1 ml |
2 ml |
0.476 |
20.17 |
|
Limit of Detection:
Limit of detection was found to be 1.57 µg/mL.
Limit of Quantitation:
Limit of quantitation was found to be 4.77 µg/mL.
Results of voriconazole tablet assay
Percentage assay was found to be 94.1%. As per the specified in Indian Pharmacopoeia Voriconazole tablets contain not less than 90% and not more than 110%of the tablet amount of voriconazole.
CONCLUSION
The developed UV spectrophotometric method for the estimation of Voriconazole was successfully validated in accordance with ICH guidelines. The method demonstrated excellent linearity (R² = 0.9999) within the concentration range of 10–50?µg/mL, with peak absorbance observed at 256?nm. It complied with Beer-Lambert’s Law, showed high precision (%RSD < 2), and exhibited accuracy with recovery results of 101%. The method also proved to be robust and rugged, making it suitable for routine analysis of Voriconazole in tablet dosage form.
REFERENCES


Priyanka Bidave*, Mallinath Kalshetti, UV-vis Spectrophotometric Method for Estimation of Voriconazole in Tablet, Int. J. of Pharm. Sci., 2025, Vol 3, Issue 6, 1667-1671. https://doi.org/10.5281/zenodo.15619222
 10.5281/zenodo.15619222
