Abstract
We present a robust and sensitive RP-HPLC method for the simultaneous quantification of Dapagliflozin and Saxagliptin in pharmaceutical dosage forms. The method adheres to ICH guidelines, ensuring accuracy, precision, and reliability. Luna C18 (150 mm × 4.6 mm, 5 µm) serves as the stationary phase, with a mobile phase composed of Phosphate Buffer pH 3.0: Acetonitrile (45:55 v/v) delivered isocratically at a flow rate of 1.0 mL/min and detected at 228 nm UV wavelength. Results include LOD (Dapagliflozin: 0.171 µg/mL, Saxagliptin: 0.267 µg/mL) and LOQ (Dapagliflozin: 0.519 µg/mL, Saxagliptin: 0.808 µg/mL). The method demonstrates sufficient responsiveness for analyte identification in samples. Retention times are 6.90 min (Dapagliflozin) and 2.36 min (Saxagliptin). The percentage relative standard deviation (RSD) is 0.87 (Dapagliflozin) and 0.27 (Saxagliptin). Recovery percentages are 99.99% (Dapagliflozin) and 98.57% (Saxagliptin). Regression equations are as Dapagliflozin: (y = 38.3465x + 3.7698) Saxagliptin: (y = 44.32317x + 0.05454). The method is suitable for standard quality control tests in the pharmaceutical industry due to reduced retention times and cost-effectiveness.
Keywords
Dapagliflozin, Saxagliptin, HPLC, Validation, ICH guidelines
Introduction
Diabetes mellitus, a widespread medical condition, is characterized by increasing rates of obesity, physical inactivity, and urbanization. In July 2009, the US Food and Drug Administration (FDA) approved saxagliptin, a dipeptidyl peptidase-4 (DPP4) inhibitor, for treating type 2 diabetes mellitus (T2DM).
Saxagliptin monohydrate, a non-hygroscopic crystalline powder, inhibits DPP4, thereby enhancing incretin hormone concentrations and reducing glucose levels in a glucose-dependent manner. Simultaneously, dapagliflozin—an orally active sodium-glucose cotransporter 2 (SGLT2) inhibitor—improves glycemic control by promoting glucose elimination via the kidneys. Its insulin-independent mechanism complements existing antidiabetic drugs.
Saxagliptin belongs to the dipeptidyl peptidase-4 (DPP-4) inhibitor class. It prolongs the action of incretin hormones (GLP-1 and GIP) by inhibiting their degradation. This results in enhanced insulin secretion and reduced glucagon release.
Clinical Use: Saxagliptin helps improve glycemic control without causing significant weight gain. It is commonly prescribed as part of combination therapy for T2DM. Saxagliptin helps improve glycemic control without causing significant weight gain. It is commonly prescribed as part of combination therapy for T2DM. Dapagliflozin is effective in lowering blood glucose levels, promoting weight loss, and reducing cardiovascular risks. It is often used as an adjunct to diet and exercise in patients with type 2 diabetes. Dapagliflozin inhibits the sodium-glucose co-transporter 2 (SGLT2) in the renal tubules. By doing so, it reduces glucose reabsorption, leading to increased urinary glucose excretion. This study explores analytical methods for quantifying saxagliptin and dapagliflozin, both individually and in combination. Additionally, we discuss the FDA-approved fixed-dose combination of these agents known as Qtern. Furthermore, we highlight the need for robust detection methods, including RP-HPLC and mass spectrometry, for assessing pharmaceutical dosage forms.
The proposed method, validated according to ICH guidelines, holds promise for stability studies, impurity profiling, and pharmacokinetic investigations.
MATERIALS AND METHODS
Chemicals and Reagents: Dapagliflozin and pioglitazone hydrochloride were sourced from Sinochem, China. We used HPLC-grade orthophosphoric acid (85%) from Fluka chemicals, acetonitrile from Fisher chemicals, potassium dihydrogen orthophosphate from EL Nasr Pharmaceuticals Chemicals, and HPLC-grade hydrochloric acid (37%) from Merck. Distilled water was used throughout the experiments. Chromatographic System: We utilized an Agilent 1200 HPLC system equipped with a diode array (DA) detector. The separation and quantitation were performed on a Luna C18 column (150 mm × 4.6 mm, 5 µm particle size). The mobile phase consisted of a mixture of Phosphate Buffer pH 3.0 and acetonitrile in a ratio of 45:55 (v/v). The buffer solution was prepared by dissolving 6.8 g of potassium dihydrogen orthophosphate in 900 mL of water, adjusting the pH to 3.0 using orthophosphoric acid, and completing the volume to 1000 mL with water. The mobile phase was filtered using a 0.45 µm nylon membrane filter (Chrom Tech).
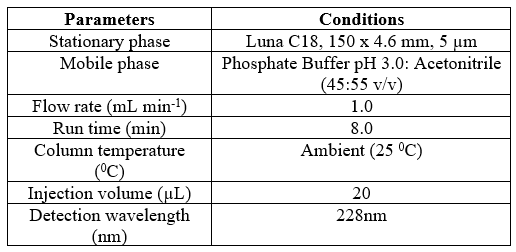
Table 1 Optimized chromatographic conditions
Preparation of Standard Solutions
For the preparation of standard solutions:
- Pioglitazone Working Standard (S1 Solution):
- Accurately weigh 30 mg of pioglitazone working standard and transfer it into a 100 ml volumetric flask.
- Add 75 ml of diluent, sonicate for 5 minutes, then cool.
- Complete the volume with diluent to obtain the desired concentration (S1 solution).
- Dapagliflozin Working Standard (S2 Solution):
- Weigh 40 mg of dapagliflozin working standard and transfer it into a 100 ml volumetric flask.
- Add 75 ml of diluent, sonicate for 5 minutes, then cool.
- Complete the volume with diluent to obtain the desired concentration (S2 solution).
- Sample Solution Preparation:
- Weigh and grind not less than 10 tablets.
- Transfer an accurately weighted portion of the powder equivalent to one tablet into a 100 ml volumetric flask.
- Add 75 ml of diluent, sonicate for 20 minutes, then cool at room temperature.
- Complete the volume with diluent.
- Dilute 5 ml of the resulting solution to a 25 ml volumetric flask, then complete to volume with mobile phase.
- Filter the solution through a 0.45 µm syringe filter into HPLC vials, rejecting the first portion of the filtrate, and inject it into the HPLC system.
- Diluent Composition:
- The diluent consists of a 0.1 N concentration of hydrochloric acid in acetonitrile (1:9).
Linearity:
Linearity of an analytical procedure refers to its ability to produce test results that are directly proportional to the concentration of the analyte in the sample. For single-point standardization, linearity should extend at least 20?yond the specification range and include the target concentration. We evaluated linearity by preparing a minimum of five different concentrations (50%, 80%, 100%, 120%, and 150%) of the working standard solution and making three replicates of each concentration.
Accuracy:
Accuracy was assessed by spiking the standard solution. We measured concentrations of Dapagliflozin and Saxagliptin around the target concentration. Specifically, we spiked the placebo (except for the active ingredient) with known quantities of Dapagliflozin and Saxagliptin working standard. Accuracy was evaluated using four determinations over three concentration levels, covering the specified range (i.e., three concentrations and three replicates).
Specificity:
- Specificity provides an indication of the selectivity and specificity of the procedure. The method is considered selective if the main peak is well resolved from any other peak by a minimum resolution.
- We achieved this by injecting placebo and comparing it with the standard and placebo spiked with the standard and sample. Then, we ascertained peak purity using a photodiode array (PDA).
System Suitability:
System suitability was verified by injecting six replicates of the standard solution at 100% of the test condition to assess the precision of the chromatographic system. The proposed HPLC method allows the concurrent determination of Dapagliflozin and Saxagliptin in the sample drug, as they exhibit different retention times. System suitability data are provided in Table 2.

Table 2 System suitability parameters for Dapagliflozin and pioglitazone HCl
RESULTS AND DISCUSSION
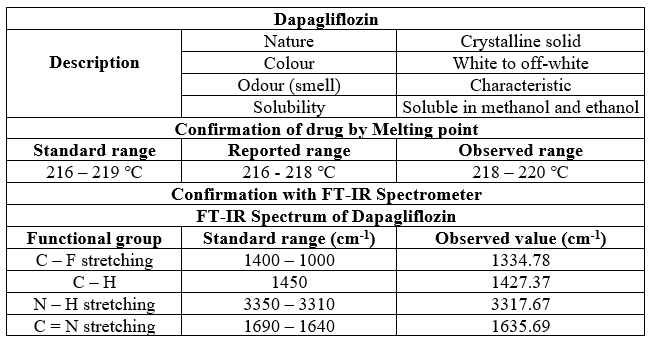
Table 3 Physiochemical data of Dapagliflozin
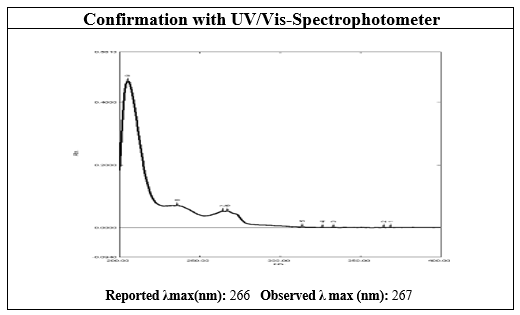
Figure 1 UV-Vis-Spectrum of Dapagliflozin

Table 4 Physiochemical data of Dapagliflozin
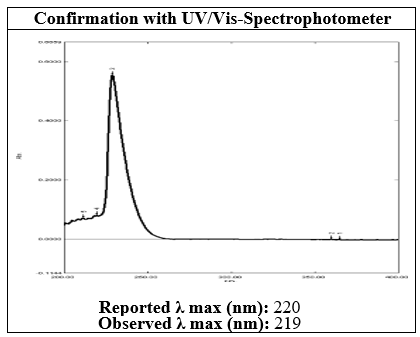
Figure 2 UV-Vis-Spectrum of Saxagliptin
The proposed HPLC method required fewer reagents and materials, and it is simple and less time consuming. This method could be used in quality control test in pharmaceutical industries. The chromatogram of Dapagliflozin and Saxagliptin was shown in Fig. 2, 3. There was clear resolution between Dapagliflozin and Saxagliptin with retention time of 6.90 and 2.36 minutes; respectively. The developed chromatographic method was validated using ICH guidelines. Validation parameters include linearity, accuracy, precision, robustness, specificity, limit of detection and quantitation.
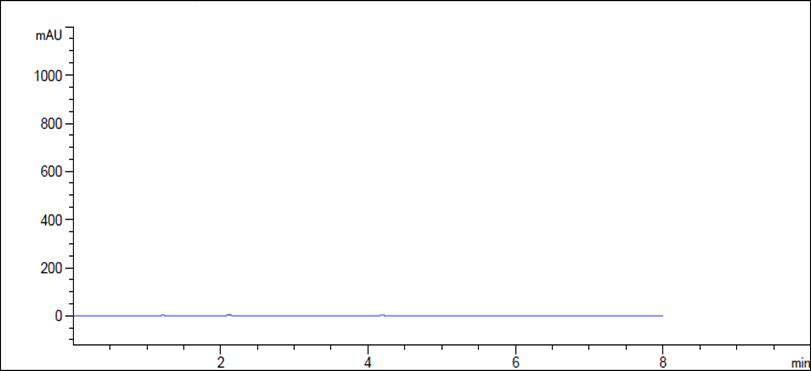
Figure 3 HPLC chromatogram of placebo.

Figure 4 HPLC chromatogram for Dapagliflozin and Saxagliptin (standard drug)
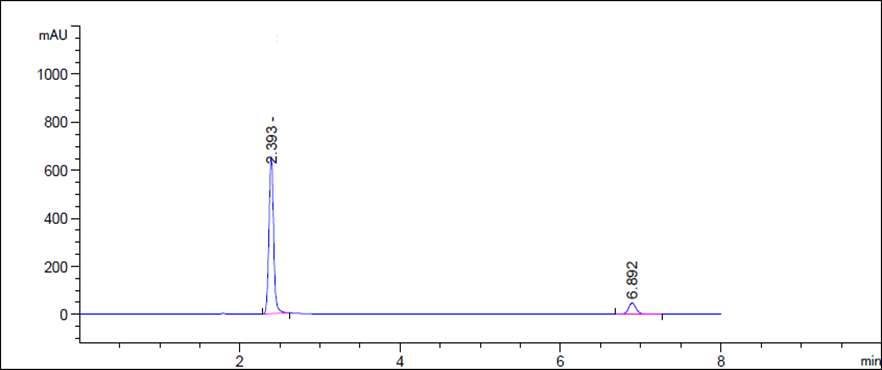
Figure 5 HPLC chromatogram for Dapagliflozin and Saxagliptin (sample drug)
Linearity
Linear calibration plots for the proposed method were obtained in concentration ranges of 4.00-12.00 µg mL-1 (4.00, 6.40, 8.00, 9.60 and 12.00 µg mL-1) for Dapagliflozin and as shown in Fig. 5 and data are shown in Table 3 and 30.00-90.00 µg mL-1 Saxagliptin (30.00, 48.00, 60.00, 72.00 and 90.00 µg mL-1) as shown in Fig. 6 and data are shown in Table 4.
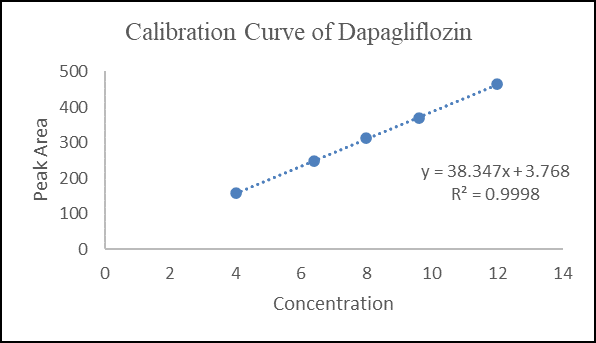
Figure 6 Calibration Curve of Dapagliflozin

Table 5 Statistical data for calibration curves of Dapagliflozin
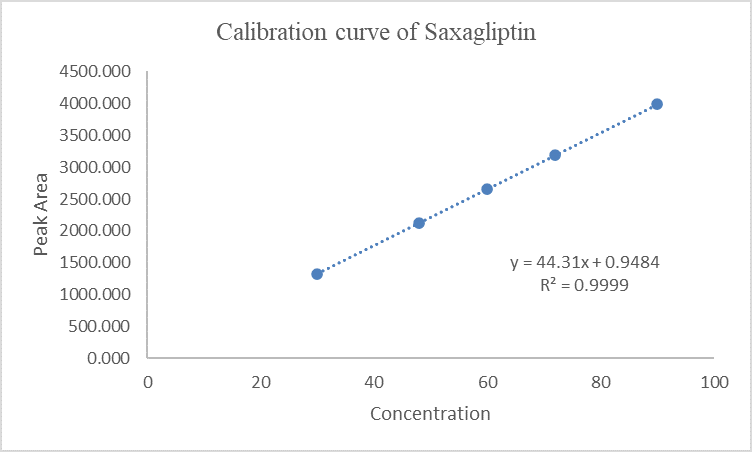
Figure 7 Calibration curve of Saxagliptin
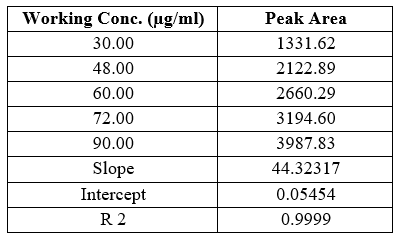
Table 6 Statistical data of calibration curves of Saxagliptin
Each of the concentrations was injected in triplicate to get reproducible response. Calibration curves were constructed by plotting peak area versus concentration. Each reading was average of three determinations. They were represented by the linear regression equation.
Y Dapagliflozin = 38.3465x +3.7698, r2 = 0.9998
Y Saxagliptin = 44.32317x +0.05454, r2 = 0.9999
Slopes and intercepts were obtained by using regression equation (Y = mx + c) and least square treatment of the results used to confirm linearity of the method developed.
The limit of detection (LOD) and quantitation (LOQ)
The LOD and LOQ were established through serial dilutions. For Dapagliflozin and Saxagliptin:
LOD:
Dapagliflozin: 0.171 µg/mL (signal-to-noise ratio of 3:1)
Saxagliptin: 0.267 µg/mL (signal-to-noise ratio of 3:1)
LOQ:
Dapagliflozin: 0.519 µg/mL (signal-to-noise ratio of 10:1)
Saxagliptin: 0.808 µg/mL (signal-to-noise ratio of 10:1)
Accuracy
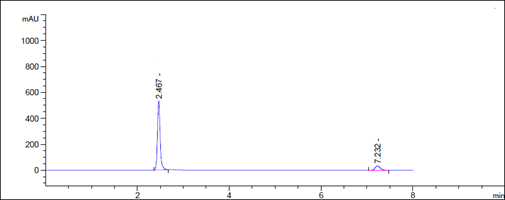
Figure 8 Accuracy chromatogram for Dapagliflozin and Saxagliptin
Accuracy Assessment: Recovery Study
To evaluate accuracy, we conducted a recovery study by adding standard drugs to reanalyzed samples at three different concentration levels. The percentage recoveries were then calculated. According to ICH guidelines, the standard limit for percentage recovery should fall within the range of 98% to 102%.
Our findings indicate that the recovery study for Dapagliflozin and Saxagliptin aligns with the standard ICH guideline. The accuracy results are supported by the data presented in Tables 7 and 8.

Table 7 Accuracy and recovery results for determinations of Dapagliflozin

Table 8 Accuracy and recovery results for determinations of Saxagliptin
Precision
In both intra-day and inter-day variability testing for precision data, the method demonstrated high accuracy across the tested ranges for Dapagliflozin and Saxagliptin. The peak area of the sample solution closely matched that of the standard solution in both cases, with a relative standard deviation (RSD) of less than 2%. Specifically, Dapagliflozin had an RSD ranging from 0.02% to 1.22% in intra-day studies, while Saxagliptin had an RSD ranging from 0.04% to 0.48%. In inter-day studies, Dapagliflozin exhibited an RSD of 0.02% to 0.76%, and Saxagliptin had an RSD of 0.07% to 1.42%. These results indicate high precision and minimal variation.

Table 9 Precision data of intra-day variability of Dapagliflozin
Conc., Concentration; RSD, relative standard deviation

Table 10 Precision data of intra-day variability of Saxagliptin

Table 11 Precision data of inter-day variability Dapagliflozin
Conc., Concentration; RSD, relative standard deviation

Table 12 Precision data of inter-day variability Saxagliptin
CONCLUSION
In our comprehensive investigation of the physical parameters of Dapagliflozin and Saxagliptin, we uncovered essential details for pharmaceutical quality control. Dapagliflozin, characterized as a white crystalline powder with a distinct fishy smell, exhibited solubility in methanol and 95% alcohol. Its melting point fell within the range of 224-226°C, slightly lower than the reported values. The FT-IR spectrum confirmed the presence of specific functional groups, aligning with established standards.
Similarly, Saxagliptin, described as a white to yellow crystalline powder with a characteristic odor, demonstrated solubility in methanol. Its melting point ranged from 98°C to 100°C, also slightly below the reported range. The FT-IR spectrum revealed functional groups consistent with expectations. Furthermore, our developed and validated high-performance liquid chromatography (HPLC) method facilitated quantitative analysis. Clear resolution between Dapagliflozin and Saxagliptin was achieved, with retention times of 6.90 and 2.36 minutes, respectively. The method met stringent validation parameters, including linearity, accuracy, precision, robustness, specificity, limit of detection (LOD), and limit of quantitation (LOQ).
REFERENCE
- Desai Saloni, Maradia Bhikhubhai Rajnikant, Suhagia N Bhanubhai, A Comprehensive and Critical Review on Analytical and Bioanalyticalmethods for Metformin Hydrochloride, Dapagliflozin, and Saxagliptin, Current Pharmaceutical Analysis; Volume 19, Issue 1, Year 2023, e101022209767.DOI: 10.2174/1573412918666221010111801
- Donepudi S, Achanta S. Simultaneous Estimation of Saxagliptin and Dapagliflozin in Human Plasma by Validated High Performance Liquid Chromatography - Ultraviolet Method. Turk J Pharm Sci. 2019 Jun;16(2):227-233. doi: 10.4274/tjps.galenos.2018.46547.
- J. M. Green. “A Practical Guide to Analytical Method Validation.” Anal. Chem. News & Features, pp. 305A–309A; 1 May 1996.
- R. Gurudeep Chatwal, K. Shyam Anand. “Instrumental Method of Chemical Analysis.” In Instrumental Methods of Chemical Analysis, 5th Edition, pages 1.1-1.5; 2008.
- Azim Md. Sabir, Mitra Molony, Bhasinn Panninder. “HPLC Method Development and Validation: A Review.” International Research Journal of Pharmacy, ISSN 2230-8407, 2013.
- Murugan S, Elayaraja A, Niranjan Babu M, Chandrakala K, Prathap Naik K, Ramaiah P. “A Review on Method Development and Validation Using HPLC.” International Journal of Novel Trends in Pharmaceutical Sciences, ISSN: 2277–2782, Oct 2013.
- Patel D. P. et al. “Development and Validation of UV Spectrophotometric Method for Simultaneous Estimation of Cefixime and Linezolid in Combined Dosage Form.” International Journal of Pharma Research Scholar, 2012; 1:112-118.
- Patel R. K., Parmar R. R., Patel V. M. “Method Development and Validation of Cefixime and Moxifloxacin in Pharmaceutical Dosage Form by UV Spectrophotometric Method.” International Journal of Pharma Research and Biosciences, 2012; 1(2):81-93.
- Kandikonda S, Akula G, Pandey V. P., Reddy S. “Validation of RP-HPLC Method for Estimation of Cefixime in Cefixime Oral Suspension.” International Journal of Pharma and Tech, 2011; 2(2):385-395.
- Phani R. S. Ch, K. R. S. Prasad, Useni Reddy Mallu. “Scientific Approach for RP-HPLC Method Development: A Complete Review.” International Journal of Science Innovations and Discoveries, 2012.
- Patwekar SL, Sakhare RS, Nilesh N. Nalbalwar. “HPLC Method Development and Validation: A General Concept.” International Journal of Chemical and Pharmaceutical Sciences, Vol. 6 (1); 2015.
- Durga Aruna R. “Method Development and Validation Parameters of UV: A Commentary.” Research and Reviews: Journal of Pharmaceutical Analysis, Page: 2347-2340, 201.
- Kalyankar, T. M., R. D. Chidrawar, M. S. Attar, and S. D. Deosarkar. “Simultaneous Estimation of Repaglinide and Metformin by UV-Visible Spectrophotometry.” FS Journal of Pharmacy Research, vol. 1, no. 3, 2012.
- Kalyankar, T. M., V. B. Ingle, M. S. Attar, and S. S. Pekamwar. “UV-Visible Spectrophotometric Method for Simultaneous Estimation of Glibenclamide and Metformin.” Analytical Chemistry: An Indian Journal, vol. 12, no. 3, 2013, pp. 89-93.


 Dr. Vivek B. Panchabhai*
 Komal Chavan
 Moein S Attar
 Dr. Ram S. Sakhare


 10.5281/zenodo.13171545