Department of Pharmacy-KBHSS Trust’s Institute of Pharmacy, Malegaon – 423105
This study reports the Method Development and Validation for Anti Diabetic Drugs by Rp- Hplc. The drug analysis is playing an vital position within the improvement of medicine, their manufacture and therapeutic use For the simultaneous estimation of medicine present in dosage forms, lot, of suitable techniques are adopted like uv – spectrophotometer HPLC. Those techniques are powerful rugged technique. they’re additionally extraordinarily specific, specific, correct, linear and speedy. A pharmaceutical industry depends upon quantitative chemical analysis to make sure that the raw material used and the final product obtained meets the required specification. The drugs will occur as a unmarried factor or multi issue dosage paperwork. The later proves to be effective because of its mixed mode of movement at the body.
Analytical chemistry may be described because the technology and art of figuring out the composition of materials in phrases of the factors of composition contained. Pharmaceutical analysis is a bench of technology that offers with the analytical methods used to decide the purity, safety and excellent of medication and chemical substances. It includes techniques to determine the identity, electricity, fine and purity of new compounds. It also includes methods for separating, identifying, and determining the relative amounts of the additives in sample of depend. First-rate guarantee plays a key position in finding the protection and efficiency of drug treatments. It has especially unique and sensitive analytical methods for the layout, development, standardization and first-rate control of medicinal merchandise. They’re equally essential for the pharmacokinetics and drug metabolism studies, each which are important for the evaluation of bioavailability and clinical response. (1) Cutting-edge physical approaches of evaluation are extraordinarily touchy even for small amount of samples of substances .it can be swiftly carried out and may simply amenable to automation. So it's far extensively used in the product development and inside the manage of manufacture, formulation and also in monitoring the use of drugs and medicines.
Optical methods
Some of the optical methods are
Electro analytical strategies:
Some of the electro analytical techniques are:
Separation methods/chromatography a number of chromatographic techniques are
One of the primary choices to be made by way of an analyst is the selection of the simplest process for a given analysis, for this he ought to be acquainted with the sensible details, the theoretical principles and also that he ought to be conversant with the circumstance under which every technique is dependable, aware about possible interferences which may additionally arise and capable of demising method of circumventing such troubles
One of the primary choices to be made by way of an analyst is the selection of the simplest process for a given analysis, for this he ought to be acquainted with the sensible details, the theoretical principles and also that he ought to be conversant with the circumstance under which every technique is dependable, aware about possible interferences which may additionally arise and capable of demising method of circumventing such troubles . The instrumental separative strategies are divided into two categories.
Chromatography (5)
Chromatography is a way by which a combination is separated into its components as a result of the relative potential of each aspect to be eluted alongside or via the desk bound section by using cell phase .The pattern is located on fringe of the stationary section (a solid or liquid) and a cellular section is authorized to flow over the desk bound phase to sweep the pattern along the period of the stationary section. Factor that are strongly adsorbed to the stationary segment are swept much less hastily along the duration of the desk bound segment than the ones additives which can be less strongly adsorbed to desk bound section.
LIQUID CHROMATOGRAPHY (HPLC) (6)
The approach of excessive overall performance liquid chromatography (HPLC) became advanced within the later Sixties and early 1970s from information of the theoretical concepts that already had been installed for in advance chromatographic techniques specially for column chromatography. The method is based totally on the identical modes of separation as classical column chromatography. I.e. Adsorption, partition (together with reverse phase partition), ion trade and gel permeation. HPLC fluctuate from column chromatography in that cell segment is pumped through the packed column underneath high strain. The fundamental advantages of HPLC in comparison to classical (gravity feed) column chromatography are advanced resolution of the separated materials, quicker separation times and the multiplied accuracy, precision and sensitivity with which the separated substances may be quantified.
Basic precept of HPLC (7)
Excessive performance liquid chromatography (HPLC) is a separation approach utilizing differences in distribution of compounds in levels known as desk bound segment and cellular section. The desk bound section designates a thin layer created on the floor of great particles and the cell section designates the liquid flowing over the debris.
Instrumentation for HPLC (9)
VALIDATION (15)
Validation is a key manner for powerful first-class warranty. “Validation is established documented evidence, which gives unique a high degree of assurance that a system of system will continuously produce a product or result meeting its predetermined specs and quality attributes”.
Definition: USFDA defines validation as “established documented evidence which presents a high degree of assurance that a specific method will continually produce a made from predetermined specs and fine attributes”.
Importance of validation
Types of validation
The following are often required to be confirmed on a pharmaceutical method
PARAMETERS USED FOR ASSAY VALIDATION
The validations of the assay system are carried out the usage of following parameters.
SPECIFICITY:
Specificity is the potential to asses unequivocally analyte in the presence of impurities, degradants, matrix, and so on which can be anticipated to be present. Lack of specificity of an individual analytical method can be compensated through other supporting analytical processes.(20)
PRECISION:
Definition:
The precision of an analytical process express the closeness of the agreement among a chain of measurements obtained from more than one sampling of the identical homogenous sample underneath the prescribed conditions. The precision of an analytical procedure is typically expressed as the variance, standard deviation or co-green of variation of a chain dimension.(21)
Machine precision
A system precision is evaluated by measuring the height reaction for the six replicable injection of the same well-known solution organized as in line with the proposed technique .The %RSD is calculated and it should no longer be more than 2%.
Method precision
A method precision is evaluated by using measuring the height reaction for six replicate injection of six distinctive weigh of pattern solution organized as in step with proposed technique. The %RSD is calculated and it ought to no longer be more than 2%.
Willpower The precision of an analytical approach is decided through assaying a sufficient wide variety of aliquots of a homogenous pattern so as to calculate statistically valid estimates of fashionable deviation or relative well-known deviation.(22)
ICH requirements
The ICH files recommended that repeatability must be assessed using a minimum quantity of 9 determinations masking the specified variety of the procedure (I, e., 3 concentrations and there replicates of each concentrations or the use of not less than six determinations at one hundred% of the test awareness).
The ICH documents encouraged that accuracy should be assessed using at the very least nine determinations over at least three awareness ranges, covering the specified range (i.e., three awareness and three replicates of each concentration).
LINEARITY (25)
Definition:
The linearity of an analytical technique is its capability (with in a given variety) to achieve the check results which might be at once proportional to the awareness (amount) of analyte inside the pattern.
Dedication: Linearity of an analytical method is mounted minimum of five concentrations. it is established to start with by means of visual exam of plot of signals as a function of analyte awareness of content material .If there appears to be a linear dating ,take a look at outcomes are hooked up via suitable statistical methods(i.e., by calculation of the regression line with the aid of the technique of least squares).
RESTRICT OF DETECTION (LOD) (26)
Definition: LOD is the decrease concentration of the substance that the technique can locate however not always quantify. LOD sincerely suggests that the pattern beneath or above a sure degree. Dedication
For non-instrumental strategies, the detection limit is usually determined by way of the analysis of samples with known awareness of analyte and by way of establishing the minimal degree at which the analyte may be reliably detected.
The ICH describes a commonplace approach, that is to examine measured signal from samples with recognized concentrations of analyte with the ones of clean samples. The minimum attention at which the analyte can reliably be detected is installed. Commonly suitable sign-to-noise ratios are 2:1 or 3:1.
RESTRICT OF QUANTITATION (LOQ) (27)
Definition:
LOQ is the bottom concentration of the substance that may be expected quantitatively with suitable precision, accuracy and reliability with the aid of the proposed approach. LOQ is determined by the analysis of samples containing lowering known quantity of the substance and figuring out the lowest degree at which suited degree of accuracy and precision is attained.
Determination
For non-instrumental techniques, quantization limit is generally determined via the analysis of samples with known concentration of analyte and by organising the minimal level at which the analyte may be determined with appropriate accuracy and precision.
Range Definition
The range of an analytical manner is the interval among the top and the lower concentration (quantities) of analyte in the pattern (which includes these concentrations) for which it has tested that the analysis process has the right level of accuracy, precision and line.
Willpower
The variety of the method is proven through verifying that the analytical approach affords applicable precision, accuracy and linearity while implemented to samples containing analyte at the extremes of the range in addition to within the variety.
ROBUSTNESS Definition
The robustness of an analytical technique is a measure of its capability to stay unchanged through small however deliberately versions in technique parameters and presents an illustration of its reliability in the course of regular utilization.
Dedication
The robustness of method determined by way of performing the assay by means of deliberately changing parameters (alternate in go with the flow rate ±10%, alternate in cellular phase ratio ±2, exchange in pH of mobile segment ±0.2, change in wave length detection ±5nm, trade in temperature ±1 to 50) that the results are not have an impact on by way of the modifications in the above parameters.
RUGGEDNESS Definition
The ruggedness of an analytical technique is the diploma of reproducibility of test results obtained by the evaluation of the samples beneath a ramification of situations, together with distinct laborites, different analyst, different units, one of a kind plenty of reagents, exceptional elapsed assay times, one of a kind assay temperatures, distinctive days and many others.(27)
Willpower: The ruggedness of analytical technique is decided with the aid of the evaluation of aliquots from homogenous lots in distinctive laboratories, by means of specific analysis, using operational and environmental condition which can fluctuate however are nonetheless in the targeted parameters of the assay .The diploma of reproducibility of the outcomes is that decided as a function of assay variables. This reproducibility may be as compared to the precision of assay under ordinary situation to achieve a degree of the ruggedness of the analytical method.
Pattern answer balance
Solution stability of the drug substance or drug product after coaching in step with the take a look at approach must be evaluated. Maximum laboratories utilize automobile samples with overnight runs and the pattern can be in solution for hours inside the laboratory surroundings earlier than the relaxation process is completed. That is challenge mainly for pills that may go through degradation with the aid of hydrolysis, photolysis, and adhesion to glassware.
DEVICE SUITABILITY SPECIFICATION AND ASSESSMENTS (28)
The accuracy and precision of HPLC records collected begin with a properly behaved chromatographic device. The gadget suitability specs and assessments are parameters that offer help in accomplishing this reason. It consists of following factors:
1. Capacity element (okay’) okay’ = (tR-tO/tf)
The ability component is a measure of wherein the height of interest is placed with recognize to the void volume i.e., elution time of the non-retained additives.
2. Precision/Injection repeatability (RSD)
Injection precision expressed as RSD (relative fashionable deviation) shows the performance of the HPLC which incorporates the pumping, column and the environmental situations, at the time the samples are analyzed .It have to be stated that pattern practice and production variations aren't considered.
3. Relative retention (α) α = ok’1/ok’2
Relative retention is a degree of the relative place of peaks.
This is not an important parameter so long as the decision (Rs) is stated.
4. Decision (Rs)
Rs = (tR2-tR1)/(half)(tw1+tw2)
Rs is a degree of how properly peaks are separated. For dependable quantitation nicely separated peaks are vital for quantitation. That is a completely useful parameter if capability inference peaks (s) may be challenge.
5. Tailing component
T = Wx/2f
The accuracy of quantitation decreases with increases in height tailing due to the problems encountered via the integrator in determine wherein/while the height ends and for this reason the calculation of the place underneath the height. Integrator variables are gift through the analyst for max calculation of the place for the peak of interest. If the integrator is unable to decide exactly whilst an upslope for down slope takes place, accuracy drops.
Theoretical plate range (N)
N = sixteen(tR/tw) 2 = L/H
Theoretical plate wide variety is a measure of column efficiency, that is, what number of peaks can be placed according to unit run-time of the chromatograph. N- constant for every peak on the chromatogram with a hard and fast set of running situations. H- peak equal of a theoretical plate. L- duration of column
MATERIALS AND METHOD
DRUG PROFILE
DRUG NAME: Gliclazide Hcl
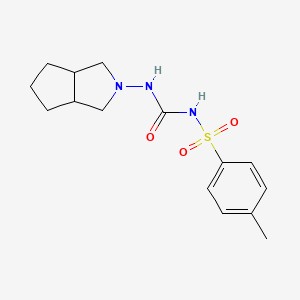
Gliclazide Hcl
Molecular Formula: C15H21N3O3S
Molecular weight: 323.4
IUPAC Name:
1-(3, 3a, 4, 5, 6, 6a-hexahydro-1H-cyclopenta[c]pyrrol-2-yl)-3-(4- methylphenyl)sulfonylurea
Solubility: Insoluble in water. Soluble in dichloromethane, chloroform, methanol,
DMSO
Category: Type 2 diabetes mellitus.
Dose: The total
Appearance White Crystal Powder daily dose may vary from 40 to 320 mg taken orally.
Mechanism of action: Gliclazide is an effective hypoglycemic sulfonylurea antidiabetic ingredient that differs from other compounds related to the N- heterocyclic ring with endocyclic bond. Gliclazide lowers blood sugar levels by stimulating insulin production in β-cells in the Langerhans islands. The increase in postprandial insulin and C-peptide secretion continues after two years of treatment.
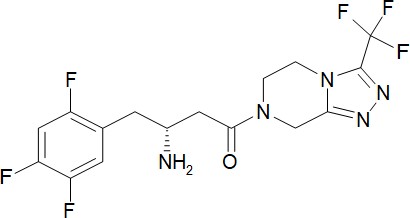
Sitagliptin Molecular
formula: C16H15F6N5O
Molecular Weight: 407.314
(R)-4-oxo-4-[3-(trifluoromethyl)-5,6 dihydro[1,2,4]triazolo[4,3-a]pyrazin 7(8H)- yl]-1(2,4,5-)butan-2-amine
Category: Antidabetic
Dose: 25 to 100 mg.
Solubility: Water-soluble and N, N Dimethyl formamide;
Storage: Store in well-closed containers.
Mechanism of action:
Sitagliptin works to block the enzyme dipeptidyl peptidase 4 (DPP-4).. This enzyme breaks down the incretins GLP-land GIP, gastrointestinal hormones released in response to a measure. By blocking the activation of GLP-1 and GIP, they are able to stimulate insulin production and suppress glucagon release by pancreas.
|
Instrumentation: 1 S. No. |
Name of instrument |
Model |
Make |
|
1 |
Semi micro balance |
CPA225D |
Sartorius |
|
2 |
pH meter |
Metler Toledo |
Thermo Orion |
|
3 |
HPLC |
LC-20 AT |
Shimadzu |
|
4 |
C 18 Column |
Phenomenex |
Gemini |
|
5 |
Sonicator |
USB |
Spectro lab |
|
6 |
UV |
1700 series |
Shimadzu |
OPTIMIZATION OF CHROMATOGRAPHIC CONDITIONS
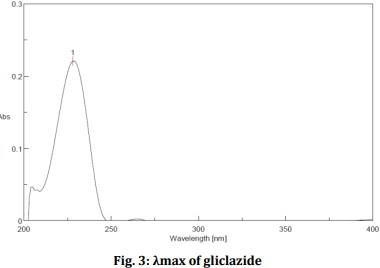
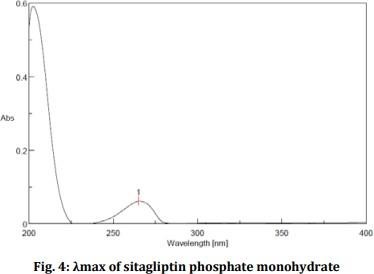
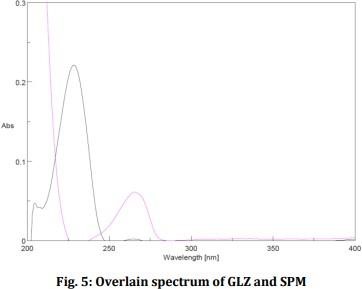
1. Selection of wavelength for detection of components
Gliclazide 10 mg (GLZ) and Sitagliptin phosphate monohydrate (SPM) 10 mg were accurately measured and transferred to 10 ml of two different volumetric flask, dissolved in a few drops of methanol and the required amount of water was added to obtain a stock solution. 1000 μg / ml. each.The stock solutions of both drugs were also diluted separately with a solvent to obtain a solution of 10μg / ml each and scanned in spectrum mode from 200-400 nm.
2. Selection of chromatographic method
The choice of method depends on the nature of the sample (ionic or ionic or neutral oms), its molecular weight, pka value and stability. Chromatography can be used. The HPLC retreat category was selected for the first division because of its simplicity and suitability. In the literature review of the properties of selected drugs, the Phenominex Gemini C18
(250 × 4.6mm) 5μ column was selected as the vertical and the moving phase. With different compositions such as Methanol was used. Separation was not detected so buffer use was abolished. For all the noted, acquired and available data the initial classification state was set to work round. 1. The first state of separation Subsequent chromatographic conditions were adjusted initially to improve the separation of both drugs.
TRAILS
Trail-1
The trail was performed by using Mobile phase in the ratio 30:35:30 using
Phenomenex C18 (250 x 4.6 mm, 5μ) with flow rate of 1.2ml/min.
In this trail, the retention time of Metformin HCL and Sitagliptin peak was found to be 0.9, and 4.0 min respectively.
Trail-2
The trail 2 was performed using by Mobile phase in the ratio 30:40:30 using Phenomenex C18 (250x 4.6 mm, 5μ) with flow rate of 1.2 ml/min.
In this trail, the retention time of Metformin HCL and Sitagliptin peak was found to be 0.7 and2.4 min. respectively.
Trail-3
Route 3 is made using the mobile section at 55:45 scale
Phenomenex C18 (250x 4.6 mm, 5μ) with a flow rate of 1.2 ml / min. In this trail, the retention time of Metformin HCL and Sitagliptin peak was found to be 4.28and 7.485min respectively.
Trial-4:
Trail 4 is made using the mobile category at 40:40:20
using Phenomenex (250 x 4.6 mm, 5 μ) with a flow rate of 1 ml / min. On this route, only two peaks were shown in 2 and 3.2 min.
Of the 4 routes made in the lab, Route 3 was selected for further studies because compared to other routes, Route 3 was found to have less storage time and was within the acceptance process.
1. Effect of ratio of mobile phase
Under the chromatographic conditions mentioned above different cell class measurements were attempted .Chromatograms where they are detected in each test, from 30: 35:35 i.e. .; 30 Buffer: 35 Methanol: 35 Acetonitrile is selected as the separation is achieved with a short storage time
Effect of pH of mobile phase
A few experiments were performed using different pH wide range bath solutions The best separation was achieved when adjusting the pH to 4.5 with orthophosphoric acid.
Effect of flow rate on separation
3. Cell class comprising buffer: methanol: acetonitrile was used and chromatograms were recorded at flow rates of 1ml / min, 1.2ml / min.
4. Effect of column (stationary phase) on separation
Cell class comprising buffer: methanol: acetonitrile was used and chromatograms were recorded at flow rates of 1ml / min, 1.2ml / min. The sharpest peaks were obtained at a flow rate of 1.5ml / min.
5. Reference standards
To keep all the rest in a stable condition, an external standard was used.
6. Optimized condition
The following advanced parameters were used simultaneously with Metformin HCL and Sitagliptin simultaneously.
Instrument: Shimadzu Prominence
Column: Phenominex C18 (250 × 4.6mm), 5μ. Column oven temperature: Ambient
Wavelength: 260nm Flow rate: 1ml/min Injection volume: 20μl Run time: 10
min
Mobile phase: Solvent a - Buffer Solvent b- Acetonitrile Solvent Ratio: 55:45% V/V of A: B
2. Effect of pH of mobile phase
A few experiments were performed using different pH wide range bath solutions. The best separation was achieved when adjusting the pH to 4.5 with orthophosphoric acid.
Effect of flow rate on separation
3. Cell class comprising buffer: methanol: acetonitrile was used and chromatograms were recorded at flow rates of 1ml / min, 1.2ml / min.
4. Effect of column (stationary phase) on separation
Cell class comprising buffer: methanol: acetonitrile was used and chromatograms were recorded at flow rates of 1ml / min, 1.2ml / min. The sharpest peaks were obtained at a flow rate of 1.5ml / min
RESULTS AND DISCUSSION
QUANTITATION
Samples obtained from local market. Gliclazide HCL -500mg, Sitagliptin-50mg
Preparation of Dipotassium hydrogen phosphate buffer pH 4.5
Prepare about 0.02M dipotassium hydrogen phosphate in a suitable conical flask and adjust the pH to 4.5 with orthophosphoric acid.(0.02M of di potassiumhydrogen phosphate is prepared by taking 1.3601mg of dipotassiumhydrogen phosphate in a volumetric flask , and make up to 1L with water).
Preparation of mobile phase:
Prepare a bath mixture of 4.5 pH, and acetonitrile at a rate of 55:45 filter with a membrane 0.45μ filter and remove
Diluent Adjustment: Buffer 4.5 pH, with acetonitrile in a ratio of 55:45
Standard preparation
Accurately measure approximately 50mg of Gliclazide, 50mg of active Sitagliptin up to 100ml of volumetric flask. Complete it completely and sonicate it. Make up to 100ml mobile category. Take 3ml in the upper flask and make up to 50ml per cellphone.
Sample preparation:
Accurately weigh 20 tablets equivalent to 92.4mg to 100ml volumetric flask. Cellular phase to completely disperse and sonicate for 10 minutes with medium movement Make up to 100ml per cellular phase and filter with 0.45 GHP filter μ. Mix again 3ml with 50ml cellular phase.
Calculation
Determine the % amount of Gliclazide HCL and Sitagliptin in tablets according to the following formula.
AT ×W R × 3 × 100 × 50 × PR × Average Weight
%Assay = × 100
AR × 100 × 50 × WT × 3 × 100 × LA
There, AT = Location in the test solution AR = Location in the standard solution
WR = Standard solution weight (mg)
WT = Sample weight in test preparation (mg) PR = Performance purity (%)
LA = Labeled amount of Gliclazide HCL and Sitagliptin per Tablets. METHOD DEVELOPMENT AND VALIDATION FOR ANTI DIABETIC DRUGS BY RP- HPLC
VALIDATION OF THE DEVOLOPED METHOD SPECIFICITY
Determination is the ability to accurately and precisely measure an interest analyst in the presence of other components that may be expected to be present in a matrix sample. The other part may include utensils, impurities, destructive product etc.
High purity tests may be useful to show that the chromatographic analyte height is given to more than one component (eg .diode array, mass, spectroscopy).
Standard preparation:
Weigh accurately about 50mg of Gliclazide, 50mg Sitagliptin working standard to a 100ml volumetric flask. Dissolve it completely and sonicate it. Make up to 100ml mobile phase. Taken 3ml of the above flask and volume make up to 50ml with mobile phase.
LINEARITY:
Linearity is the ability of a method of obtaining test results that directly equates to analyzing focus within a given range.
Linearity Graph RANGE:
Range is the interval between the upper and the lower levels of analyte that have been demonstrated to be determined with precision, accuracy and linearity using the method. The scope is usually expressed by the same unit as the test results obtained by the method. The ICH guideline specify a minimum of five concentration levels, along with certain minimum specified ranges .For assay tests the minimum specified range is 80 – 120%of the target concentration
LIMIT OF DETECTION (LOD)
Acquisition limit (LOD) is defined as the low concentration of the analyst in the detectable sample, albeit not really measured. A limit test that determines whether the analyst is above or below a certain value or not.
The ICH recommended a specific method for determining adoption limits. The path may be metal or metal. That's right
Visual Assessment
Signal - to - Sound rating
LIMIT OF QUANTITATION (LOQ)
The Quantitation Limit (LOQ) is defined as the analyst's low concentration in a sample that can be determined with the accuracy and precision acceptable under the specified operating conditions. The Quantitative Census Limit (LOQ) is also based on the standard deviation of the response and the slope of the measurement curve.
RUGGEDNESS
Difficulty in the method of analysis of the frequency of results obtained by analyzing the same samples under different test conditions such as different laboratories, analysts, instruments, temperature, different days etc.
SYSTEM SUITABILITY
To verify whether the analytical system is working properly or it can give accurate and precise results, the system suitability parameters are to be set. Inject separately 20 L each of the following solutions into the HPLC.
Acceptance criteria as follows:
In the chromatogram obtained with Standard, standard solution should not be more than 2.0.

Spectra For Sitagliptin
Over Lapping Gliclazide &Sitagliptin
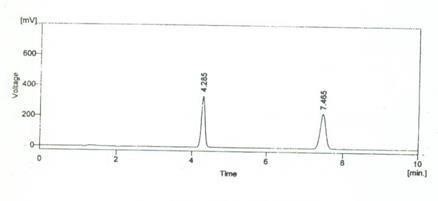
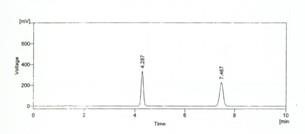
Chromatogram 4
Sample Name: Sample Precision System
: Hplc
Detector: Uv-Vis
Type Of Analysis: Percentage On Area
|
Result Table 16 ( GZD-SIT ) S. No |
Reten time ( Min ) |
Area (MV) |
Area % |
||
|
1 |
4.286 |
1996.901 |
51.8 |
||
|
2 |
7.474 |
1848.657 |
48.2 |
||
|
Total |
|
3845.558 |
|
100.0 |
|
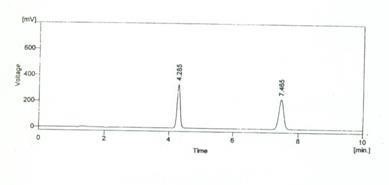
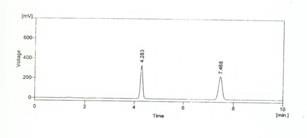
Chromatogram 5
Sample Name : Sample Precision System
: Hplc
Detector :Uv-Vis
Type Of Analysis : Percentage On Area
|
S. No |
Reten time ( Min ) |
Area (MV) |
|
Area % |
|
|
1 |
4.285 |
2218.084 |
|
52.0 |
|
|
2 |
7.465 |
2051.30 |
|
48.0 |
|
|
Total |
|
4269.384 |
|
100.0 |
|
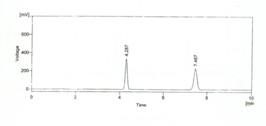
Chromatogram 6
Sample Name : Sample Precision System
: Hplc
Detector :Uv-Vis
Type Of Analysis : Percentage On Area
Chromatogram 7
Sample Name : Sample Precision System
: Hplc
Detector :Uv-Vis
Type Of Analysis : Percentage On Area
Chromatogram 8
Sample Name : Sample Precision System
: Hplc
Detector :Uv-Vis
Type Of Analysis : Percentage On Area
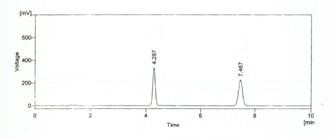
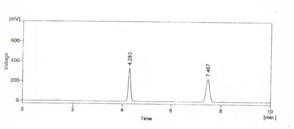
Chromatogram 9
Sample Name : Sample Precision System
: Hplc
Detector :Uv-Vis
Type Of Analysis : Percentage On Area
|
S. No |
Reten time ( Min ) |
Area (MV) |
Area % |
||
|
1 |
4.283 |
2212.80 |
51.8 |
||
|
2 |
7.467 |
2043.95 |
48.2 |
||
|
Total |
4256.75 |
100.0 |
|||
Chromatogram 10
Sample Name : Sample Precision System
: Hplc
Detector :Uv-Vis
Type Of Analysis : Percentage On Area
REFERENCES


Najiya Mansuri*, Pratiksha Awari, Ziyaur Rahman, Method Development and Validation for Anti Diabetic Drugs, Int. J. of Pharm. Sci., 2025, Vol 3, Issue 5, 1210-1226. https://doi.org/10.5281/zenodo.15364192
 10.5281/zenodo.15364192
