Bhagwan Mahavir Center for Advance Research, BMEF Campus, Nr. Aakash E-space, Bharthana, Vesu, Surat 395017.
This study aimed to develop and evaluate a nanosuspension-based gel designed for transfollicular delivery of baricitinib, enhancing its solubility, permeability, and sustained release. The nanosuspension was formulated using a media milling technique with zirconium dioxide as the milling medium, while poloxamer 188 and 407 served as stabilizers. Various process parameters, including stirring time, stirring speed, and the concentrations of poloxamer, drug, and milling beads, were optimized to achieve the desired formulation. Once optimized, the nanosuspension was incorporated into a topical gel using Carbopol 934 as a gelling agent to facilitate prolonged drug release. Particle size analysis revealed that increasing the surfactant and drug concentration led to a reduction in particle size. Scanning electron microscopy (SEM) confirmed that the baricitinib nanosuspension had a spherical morphology. In-vitro permeation studies demonstrated that a 10% concentration of the baricitinib nanogel allowed for 96.17% drug permeation over 24 hours, whereas the nanosuspension alone achieved 98.27% permeation within just 12 hours. This indicates that the gel formulation effectively sustained drug release for up to 24 hours. The nanosuspension-loaded gel appeared clear, exhibited good homogeneity, and maintained a pH of approximately 5.5—compatible with the natural pH of hair. The incorporation of Carbopol 934 in the gel formulation significantly extended drug release compared to the nanosuspension alone. Additionally, the nanosuspension-based hair gel enhanced the drug’s saturation solubility and sustained its release, making it a promising candidate for scalp applications in treating alopecia. These findings suggest that the developed nanogel could serve as an effective transfollicular drug delivery system in nanomedicine.
1.1 Hair Follicle
Hair follicles and sebaceous glands, the largest appendages of the skin, offer an alternative route for drug delivery, allowing substances to bypass the stratum corneum barrier. The hair follicle itself is a specialized organ embedded in the dermis and extending outward through the epidermis. Hair is primarily composed of proteins, lipids, water, trace elements, and pigments. The key structural protein found in hair is keratin. There are two main types of hair:
The portion of hair visible above the skin is known as the hair shaft, which consists of three layers: the cuticle, cortex, and medulla. Research indicates that hair diameter varies across different body areas. For instance, in Caucasian adults, scalp hair typically has a diameter of around 70 µm, whereas beard hair is thicker, measuring about 126 µm. Despite accounting for only 0.1% to 1% of the total skin surface, hair follicles and sweat glands provide a pathway for targeted drug delivery. The part of the hair located beneath the skin is called the hair root, with its lower bulbous section referred to as the hair bulb. This is where essential biological processes, including cell division, occur. The hair bulb is housed in a tubular pocket called the hair follicle, which is highly responsive to hormones like androgens. Androgens play a dual role in hair growth: they can stimulate growth in certain areas while inhibiting it on the scalp, contributing to androgenetic alopecia (AGA). This condition results from androgens triggering the gradual miniaturization of scalp hair follicles, ultimately leading to hair thinning and loss. The effects of androgens on hair growth vary depending on the body site, making their impact highly specific to each follicle.
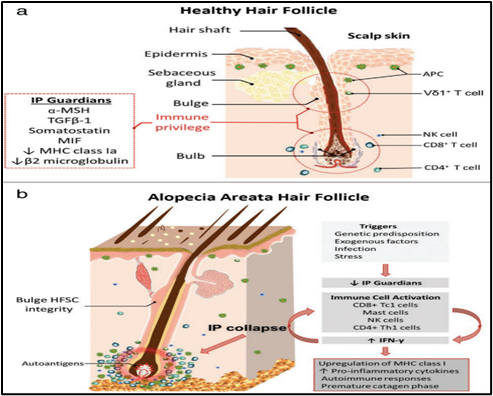
Fig No. 1 Structure of the Hair follicles
1.2 Nanosuspensions
Nanosuspensions are colloidal dispersions made up of nano-sized drug particles stabilized by surfactants. They are essentially biphasic systems where pure drug particles are dispersed in an aqueous medium, with the suspended particles measuring less than 1 ?m in diameter. These formulations are particularly useful for improving the solubility of drugs that have poor water and lipid solubility. By enhancing solubility, nanosuspensions help increase the dissolution rate of the active compound, allowing it to reach peak plasma concentration more quickly. This makes them a superior option compared to other solubility-enhancing techniques. Nanosuspensions are especially beneficial for drugs with low solubility, low permeability, or both—challenges that often complicate drug formulation. Unlike nanoparticles, which are polymer-based colloidal drug carriers (such as nanospheres and nanocapsules), or solid lipid nanoparticles (SLNs), which rely on lipid-based carriers, nanosuspensions consist of pure drug particles stabilized in a liquid medium. Pharmaceutical nanosuspensions are versatile and can be administered orally, topically, or through parenteral and pulmonary routes. The solid particles within these suspensions typically measure less than one micron, with an average size ranging between 200 and 600 nm. Due to their nano-scale size, these particles exhibit increased dissolution velocity and enhanced saturation solubility, largely due to the vapor pressure effect.
1.2.1 Advantages of nanosuspensions
The major advantages of nanosuspension technology are:
1.2.2 Method of Preparation for Nanosuspension
Bottom-up technology:
In this technique, the drug is first dissolved in a suitable solvent and then mixed with another solvent in which the drug is insoluble, all in the presence of a surfactant. When this drug solution is rapidly introduced into the insoluble solvent—typically water—it results in immediate supersaturation, leading to the formation of ultra-fine drug particles, which may be either amorphous or crystalline. The process relies on two key mechanisms: nucleation and crystal growth, both of which are highly influenced by temperature. For achieving a stable suspension with the smallest possible particle size, the formulation must have a high nucleation rate and a low crystal growth rate. These factors play a crucial role in ensuring the effectiveness and stability of the nanosuspension.
Advantages:
Disadvantages:
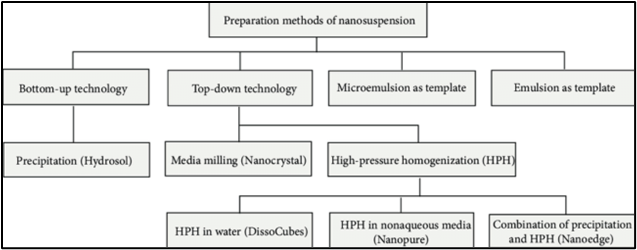
Fig No.2 Method of Preparation of Nanosuspension
Top-down Technology The techniques in which Nano size range of particles is obtained by reduction in size of larger particles
Milling Technique (Media Milling)
This proprietary technology, initially developed by Liversidge et al. in 1992, was originally owned by Nano Systems but has since been acquired by Elan Drug Delivery. The method involves producing nanosuspensions using high-shear media mills or pearl mills. These mills typically consist of a milling chamber, a milling shaft, and a recirculation chamber. During the process, the milling chamber is filled with milling media, water, the drug, and a stabilizer. The milling media—often referred to as pearls—are then rotated at an extremely high shear rate under controlled temperature conditions.
Principle
The technique relies on intense energy and shear forces generated by the milling media colliding with the drug particles. This impact provides the necessary energy to break down microparticles into nano-sized drug particles. The milling media used in this process can be made of materials such as glass, zirconium oxide, or highly cross-linked polystyrene resin. The milling process can be carried out in two different modes: batch mode or recirculation mode. In batch mode, achieving dispersions with a uniform particle size distribution and an average diameter of less than 200 nm typically takes between 30 to 60 minutes. This method is effective for processing both micronized and non-micronized drug crystals. Once the formulation and process parameters are optimized, batch-to-batch variations in dispersion quality are minimal, ensuring consistency and reliability in the final product.
Advantages
Disadvantages
2 MATERIALS AND METHODS
2.1 MATERIALS
Table No. 1 Drug Profile of Baricitinib
|
Parameters |
Description |
|
Generic Name |
Baricitinib |
|
Chemical formula |
C16H17N7O2S |
|
Structure |
|
|
Molecular weight |
371.42 g/mol |
|
Description |
Baricitinib is a Janus kinase (JAK) inhibitor. JAKs are tyrosine protein kinases that play an important role in pro-inflammatory signalling pathways. By inhibiting the actions of JAK1 and JAK2, baricitinib attenuates JAK-mediated inflammation and immune responses. |
|
Solubility |
|
|
BCS Class |
It belongs to class III of biopharmaceutical classification system (BCS), which means that it is highly soluble and poorly permeable drug, however, the same report also mentioned that baricitinib is practically insoluble. |
Baricitinib was gifted from Bulat Pharma Pvt. Ltd, Gurugram, Haryana. Poloxamer 407 was obtained from Zeel Pharmaceuticals Ltd Mumbai, Poloxamer 188 was obtained from Balaji Drugs Surat, Glycerol was obtained from Vishal Chemicals Mumbai, Zirconium dioxide beads was obtained from Jyoti Ceramics Nasik. All the chemicals and excipients used were of analytical grade.
3 Pre-Formulation Studies
Drug and excipient compatibility studies using Fourier Transform Infra-Red (FTIR) Spectroscopy, the spectrum analysis of pre-owned formulations of Baricitinib and excipients was investigated. The facility of Shimadzu Company (Kyoto, Japan) was utilized to produce potassium bromide (KBr) discs, which were then utilized to generate FTIR spectra (model - 8400S). To ensure that the drug and excipients were compatible, FTIR analysis was performed.
4.Method Of Preparation
4.1 Formulation of Nanosuspension: (Media Milling Method)
Accurately weighed amount of Baricitinib API was dispersed in an aqueous solution (Distilled water 10ml) containing Glycerol and different ratio of Poloxamer in 30ml vial. The resulting coarse pre-dispersion was continued using Zirconium oxide beads i.e. milling media on a magnetic stirrer at about 1000rpm for 24hrs. The prepared Nanosuspension was separated from Zirconium oxide beads by decanting the suspension followed by washing the beads with Distilled water. Various formulations were prepared by varying the sizes of Zirconium oxide beads, concentrations of Poloxamers, types of Poloxamers (407 and 188), volumes of Zirconium oxide beads.
Table No. 2 Formula for BRB Nanosuspension
|
Sr. no. |
Materials |
Quantity |
Use |
|
1 |
Baricitinib |
2 mg |
JAK inhibitor |
|
2 |
Poloxamer 407 |
1-5 % |
Surfactant |
|
3 |
Poloxamer 188 |
1-5 % |
Stabilizer |
|
4 |
Glycerol |
5.0-15.0% |
Cosolvent/Wetting agent |
|
5 |
Water |
q.s |
Solvent |
4.2 Formulation of Nanosuspension Gel
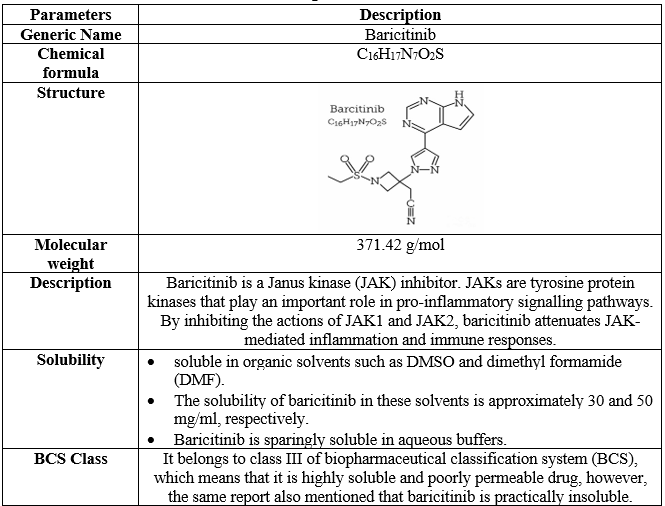
Fig No. 4 Steps for preparation of BRB loaded Nanosuspension gel
5. Box-Behnken design optimization of Baricitinib loaded Nanosuspension
Using a Box-Behnken design, a number of the possession’s constituents, including stabilizer concentration, stirring speed, and milling media volume, were examined at varying levels, with each level representing an independent variable (+1, 0 & - 1). As the response (dependent variable), studies on zeta potential, particle size and ?R were utilized. Utilizing the Design Expert-12 software. The created formulations were studied further for drug content and entrapment efficiency, ex-vivo experiment. The software Design of Experts 12 produced various permutation combinations. Concentration of stabilizer is factor 'A', stirring speed is variable 'B', and milling media is independent variable 'C'. One level is higher than the other and both levels are utilized. The concentration of stabilizer utilized ranges between 100 mg and 200 mg. Stirring speed is 2000 at the higher level and 1000 at the lesser level. Media milling is 75 at the higher level and 25 mg at the lesser level.
Table No. 3 Screening studies using Box-Behnken design for Nanosuspension
|
Box Behnken Design |
|||
|
Independent Variables |
|||
|
Independent Variables |
Level |
||
|
Low |
Medium |
High |
|
|
Conc. of Stabilizer (mg) (X1) |
100 |
150 |
200 |
|
Stirring Speed (rpm) (X2) |
1000 |
1500 |
2000 |
|
Milling media (X3) |
25 |
50 |
75 |
|
Dependent Variables |
|||
|
Y1 =Particle Size (m) |
|||
|
Y2= Zeta potential (mV) |
|||
|
Y3= ?R |
|||
Table No. 4 (Box-Behnken permutation combination)
|
Run |
Formulation |
Independent Variables |
||
|
Coded Value |
||||
|
X1 |
X2 |
X3 |
||
|
1 |
F1 |
-1 |
+1 |
+1 |
|
2 |
F2 |
0 |
-1 |
-1 |
|
3 |
F3 |
+1 |
-1 |
-1 |
|
4 |
F4 |
-1 |
0 |
0 |
|
5 |
F5 |
0 |
0 |
0 |
|
6 |
F6 |
+1 |
0 |
0 |
|
7 |
F7 |
-1 |
+1 |
+1 |
|
8 |
F8 |
0 |
+1 |
+1 |
|
9 |
F9 |
+1 |
+1 |
+1 |
|
10 |
F10 |
-1 |
-1 |
-1 |
|
11 |
F11 |
0 |
-1 |
-1 |
|
12 |
F12 |
+1 |
-1 |
-1 |
|
13 |
F13 |
-1 |
0 |
0 |
|
14 |
F14 |
0 |
0 |
0 |
|
15 |
F15 |
+1 |
0 |
0 |
Table No. 5 Box-Behnken runs formulae
|
Factorial Batches |
Drug (BRB) |
Conc. of Stabilizer (X1) |
Milling Media Value (%) |
Total Volume (ml) |
Stirring Speed (rpm)(X2) |
Stirring Time (HRS) |
|
F1 |
2 |
150 |
15 |
25 |
2000 |
24 |
|
F2 |
2 |
150 |
15 |
25 |
1000 |
24 |
|
F3 |
2 |
150 |
15 |
25 |
2000 |
24 |
|
F4 |
2 |
100 |
15 |
25 |
1500 |
24 |
|
F5 |
2 |
100 |
15 |
25 |
1500 |
24 |
|
F6 |
2 |
150 |
15 |
25 |
1500 |
24 |
|
F7 |
2 |
200 |
15 |
25 |
1500 |
24 |
|
F8 |
2 |
200 |
15 |
25 |
2000 |
24 |
|
F9 |
2 |
200 |
15 |
25 |
1000 |
24 |
|
F10 |
2 |
150 |
15 |
25 |
1000 |
24 |
|
F11 |
2 |
200 |
15 |
25 |
1500 |
24 |
|
F12 |
2 |
150 |
15 |
25 |
1500 |
24 |
|
F13 |
2 |
100 |
15 |
25 |
2000 |
24 |
|
F14 |
2 |
150 |
15 |
25 |
1500 |
24 |
|
F15 |
2 |
100 |
15 |
25 |
1000 |
24 |
The formulas for each experiment are displayed in Table 5. In the above formulas, three factors were varied at three different levels, while the consolidation of the drug and the volume of dispersion in water were held constant across all runs.
6. Characterization of Nanosuspension of Baricitinib:
6.1 Particle Size & Size Distribution (PDI):
The mean particle diameter and size distribution of the prepared nanosuspension was measured using Malvern particle size analyzer.
6.2 Polydispersity Index:
Polydispersity Index is an index of width or spread or variation within the particle size distribution. Monodisperse samples have a lower PDI value, whereas higher value of PDI indicates a wider particle size distribution and the polydisperse nature of the sample. PDI is calculated by the using following formula:
|
PDI = ?d/davg |
where, ?d is the width of distribution and davg is the average particle size.
The usual range of PDI values are as follows.
Table No.6 Standard DI values for Nanosuspension
|
Polydispersity Index |
Type of Dispersion |
|
0-0.05 |
Monodisperse standard |
|
0.05-0.08 |
Nearly monodisperse |
|
0.08-0.7 |
Midrange polydisperse |
|
>0.7 |
Very polydisperse |
6.3 Scanning Electron Microscopy (SEM):
The morphology of Nanosuspension was estimated with a scanning electron microscope (ESEM EDAX XL-30 Philips, Netherlands) operating at 15Kv. The sample were kept on a metal stub with double adhesive tape and coated with platinum/palladium alloy under vacuum. SEM photograph recorded at magnification of 1000X and 2500X.
6.4 Zeta Potential Determination:
Zeta potential of the nanosuspension is measured by Malvern zeta sizer using the Helmholtz-Smoluchowski equation. The zeta sizer mainly consists of laser which is used to provide a light source to illuminate the particles within the sample. For these light splits to provide an incident and reference beam, the incident laser beam passes through the center of the sample cell and the scattered light at an angle of about 130 is detected. Zetasizer software produces a frequency spectrum from which the electrophoretic mobility occurs.
A good physical long-term stability of the dispersion is normally predicted by a zeta potential ranging from ±10mV to ±20mV. Zeta potential was measured by Zeta sizer.
6.5 Differential Scanning Colorimetry:
Differential scanning calorimetry (DSC) is a thermal analysis technique used to measure the heat flow of a sample as a function of temperature or time. It can provide information about the thermal stability, melting, and crystallization behavior of drug. The drug sample and reference pans were sealed and were heated at rate of 10°C per minutes and scanned between 20°C to 300°C. Empty sealed aluminum span was taken as reference.
6.6 pH measurement:
pH measurement of formulated nanosuspension was done by using the calibrated pH meter. The skin pH is in range from 4.7 to 5.0. In this type of formulation, the pH measurement is necessary because if the formulation pH is not in range of skin pH so it can lead to patient inconvenience. Thus, the pH of the formulation is in range from 4.7 to 5.0.
6.7 Determination of drug content:
The solid dispersion system was accurately weighed and dissolved in a methanol. The solutions were filtered and diluted based on the dilution scheme. Then the absorbance of solutions was measured at 250 nm in UV spectrophotometer.
%Drug Content = Amount of Drug Obtained x 100 / (Initial amount of drug)
6.8 Entrapment Efficiency (%):
The entrapment efficiency of nanosuspension dispersion was determined by the centrifugation method. Nanosuspension dispersion (containing an equivalent to 5 mg of drug) was centrifuged at 20000 rpm for one hour in a refrigerated centrifuge to collect the supernatant liquid. The collected liquid was filtered to finding the free drug concentration after appropriate dilution with a fresh phosphate buffer saline pH 7.4. The absorbance was measured at 250nm. The percentage entrapment efficiency (?) was calculated by using the following formula:
? = Total drug content ? Free drug /Total drug content × 100
6.9 In-Vitro Drug Release Study of Nanosuspension:
In vitro release of Baricitinib nanosuspension was assess by the dialysis bag diffusion technique. The drug release studies of nanosuspension were performed in PBS (pH6.4). The nanosuspension was introduced in a cellulose dialysis bag and then tied at both ends. The dialysis bag was immersed in the receptor compartment containing 50 ml of in PBS (pH 6.4) and this dialysis bag immersed in to the dissolution apparatus USP-II Type which was stirred at 100 rpm and maintained at 37 ± 0.5°C. The receptor chamber was covered for the prevention the evaporation of dissolution medium. Samples were withdrawn (5ml) at regular time intervals (2 hours) and the same volume was replaced by freshly prepared dissolution medium. The samples were analyzed using a UV-visible spectrophotometer set at 210nm and 240 nm respectively.
7. Incorporation of optimized transferosomal formulation in gel
Preparation of Carbopol gel
Carbopol gel were created by immersing Carbopol in water and neutralizing it to a pH of 6.8 with triethanolamine. Methyl and propyl paraben were weighed and added to water prior to the addition of Carbopol while agitating continuously until a homogenous product was formed. It was filled with distilled water and vigorously stirred.
8. Characterization of Nanosuspension based gel
8.1 Physical Appearance
The physical appearance of the formulation was checked visually which comprised of:Colour: The colour of the formulations was checked out against white background.
Consistency: The consistency was checked by applying on skin.
Greasiness: The greasiness was assessed by the application on to the skin.
8.2. Viscosity Determination
The viscosity of the prepared gel formulations was measured at room temperature by Brookfield viscometer attached with spindle 4. The spindle was rotated at varying rpm and readings were recorded to study the effect of shearing stress on viscosity.
8.3 Spreadability
Spreading coefficient was determined by apparatus prepared by two glass plate. It consists of a glass plate; one end is attached to a pulley. On the basis of ‘Slip’ and ‘Drag’ characteristics of nanosuspension gels Spreading coefficient was measured. The excess of nanosuspension gel (about 2g) sandwiched between two glass slides. A ground glass slide was fixed. The second glass slide is attached with the hook. Measured weight was placed in the pan attached to the pulley with the help of hook. The distance drag by top slide and time (in second) was noted. A shorter interval indicates better spreading coefficient.
It was calculated using formula:
S=M×LT
where,
S= Spreadability,
M= Weight tied to upper slide,
L= Length of glass slide,
T= Time taken to separate the slides completely from each other.
8.4 Extrudability Study
It is a usual empirical test to measure the force required to extrude the material from tube. The method applied for determination of applied shear in the region of the rheogram corresponding to a shear rate exceeding the yield value and exhibiting consequent plug flow. In the present study, the method adopted for evaluating nanosuspension gel formulation for Extrudability is based upon the quantity in percentage of nanosuspension gel and nanosuspension gel extruded form lacquered aluminium collapsible tube on application of weight in grams required to extrude at least 0.5 cm ribbon of nanosuspension gel in 10 seconds. More quantity extruded better is Extrudability.
The measurement of extrudability of each formulation is in triplet and the average values are presented. The Extrudability is than calculated by using following formula:
Extrudability=applied weight to extrude nano-suspension gel from tube(gm)Area(cm2)
8.5 Texture Analysis
Texture Analysis itself is the study of the deformation and flow of a gel when under the influence of stress and includes the assessment of raw materials, intermediate components and finished products. Texture analysers are used to measure many properties, such as Hardness, Brittleness, Spreadability, Adhesiveness, Tensile Strength, Extensibility of nanosuspension gel.
8.6 In-vitro Drug Release Study
Franz Diffusion cell was used to determine the release profile of drug from topical gel. The cell consisted of two chambers, the donor and the receptor compartment between which a diffusion membrane (egg membrane) was mounted. The donor compartment, with inner diameter 24 mm, was open i.e. exposed to the atmosphere at one end and the receptor compartment was such that it permitted sampling. The diffusion medium used was phosphate buffer solution pH 7.4 (PBS). 1 gm of the drug containing topical gel was placed in the donor compartment separated from the receptor compartment by the egg membrane. The egg membrane was previously soaked for 24 hrs. in PBS. The donor and receptor compartments were held together using a clamp. The position of the donor compartment was adjusted so that egg membrane just touches the diffusion medium. The whole assembly was fixed on a magnetic stirrer. The receptor compartment with 100 ml PBS was placed on a thermostatically controlled magnetic stirrer. It was maintained at 37± 0.5?C and stirred constantly at 50 rpm. Sample of 1ml were collected at predetermined time intervals and analyzed for drug content by UV Spectrophotometer at ?max against blank. The receptor phase was replenished with an equal volume of PBS at each time of sample withdrawal.
9. RESULT AND DISCUSSION
9.1 Experimental design
Analysis of the Box-Behnken structure
Using the media milling method, nanosuspension were prepared, characterized for various parameters, and optimized using Box–Behnken design, a three-factor, three-level, suitable statistical instrument (Design-Expert 12). The purpose of the experimental design was to investigate the effects of process variables such as stabilizer concentration (mg), stirring speed (rpm), and milling media and their interactions using ANOVA at the 0.05 level. Using data from 15 experimental trials, the design expert software would generate a design matrix. The results of the 15 formulations were compiled and presented in table. Figure depicts the three-dimensional graphs for each of the three responses of R1, R2 and R3. There diagrams are well known for researching the interconnections between variables and responses and the combined effects of two factors on a response. The experimental response values obtained would illustrate the quantitative comparisons between Figure 4 and the predicted values.
9.2 Characterization of Box Behnken Design Batches
Table No. 7 Characterization of Box Behnken Design Batches (F1-F15)
|
Factorial Batch |
Particle Size (Y1) |
Zeta Potential (Y2) |
?R (Y3) |
|
F1 |
285 |
14.9 |
84.8 |
|
F2 |
295 |
14.1 |
85.9 |
|
F3 |
289 |
16.6 |
86.7 |
|
F4 |
292 |
15.1 |
82.2 |
|
F5 |
293 |
14.6 |
80.9 |
|
F6 |
289 |
14.7 |
90.6 |
|
F7 |
287 |
15.5 |
93.4 |
|
F8 |
293 |
14.8 |
92.1 |
|
F9 |
302 |
12.9 |
91.9 |
|
F10 |
293 |
14.8 |
83.4 |
|
F11 |
295 |
15.7 |
94.6 |
|
F12 |
291 |
14.3 |
88.9 |
|
F13 |
296 |
13.6 |
80.2 |
|
F14 |
287 |
14.3 |
89.8 |
|
F15 |
301 |
12.3 |
80.2 |
Table No. 8 Summary of Quadratic Polynomial Equation for responses Y1, Y2, and Y3
|
Quadratic Model |
Quadratic Polynomial Equation |
|
Y1 (Particle Size Distribution) |
289.0-0.625X1-3.50X2 + 1.63X3 - 1.00X1X2 + 2.25X1X3 + 0.500X2X3 + 5.13X12 + 3.88X22 - 2.38X32 |
|
Y2 (Zeta Potential) |
14.43 + 0.4125X1 + 0.725X2 + 0.2125X3 + 0.15X1X2 -0.075X1X3 + 0.60X2X3 - 0.4542X12 - 0.5792X22 + 1.25X32 |
|
Y3 (?R) |
89.77 + 6.06X1 + 0.300X2 + 0.8625X3 + 0.05X1X2 -0.025X1X3 - 0.150X2X3 - 0.5458X12 - 3.12X22 - 1.45X32 |
9.2.1 Effect on Particle size (Y1)- Surface Response Study:
The negative incentive for the coefficient of X1 in the condition shows decreased in particle.
289.0-0.625X1-3.50X2+1.63X3-1.00X1X2+2.25X1X3+0.500X2X3+5.13X12+3.88X22-2.38X32
size with concentration of stabilizer increases. The negative incentive for coefficient of X2 in the condition demonstrate reduces the particle size with stirring speed increases.
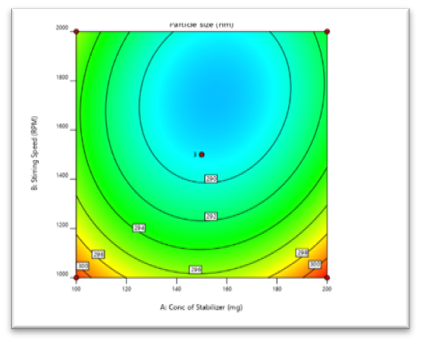
Fig No. 5 Contour plot of Particle Size
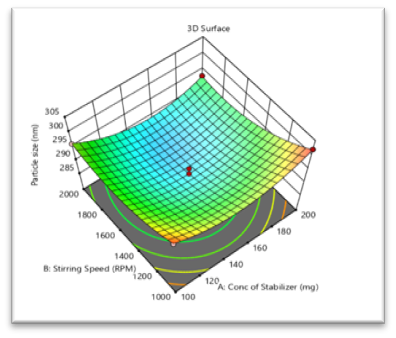
Fig No. 6 3D- response of Particle Size
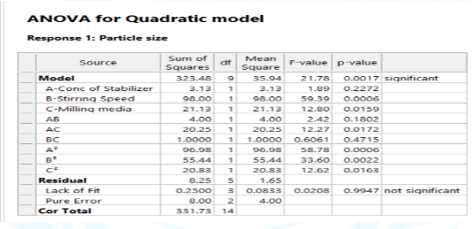
Table No. 9 ANOVA table for Surface Response Y1
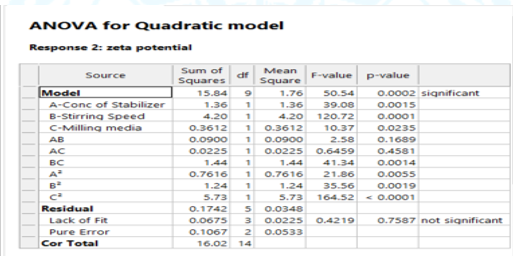
9.2.2 Effect on zeta potential (Y2)- surface response study:
The positive incentive for the coefficient ox X1 in condition shows increases in zeta potential with increases in stabilizer concentration. The positive an incentive for coefficient of X2 in condition shows the increase zeta potential with stirring speed increases.
14.43+0.4125X1+0.725X2+0.2125X3+0.15X1X2-0.075X1X3+0.60X2X3-0.4542X12-0.5792X22+1.25X32
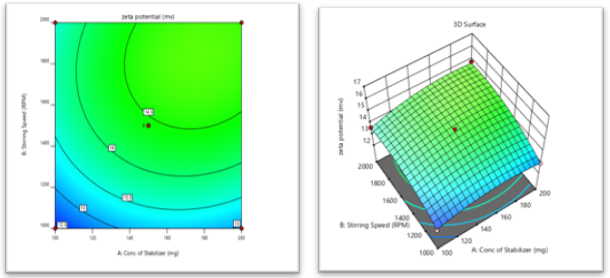
Fig No. 7 Contour plot of Zeta Potential Fig No. 8 3D- response of Zeta Potential
Table No.10 ANOVA table for Surface Response Y2
9.2.3 Effect on ?R (Y3)- Surface Response Study:
The Positive incentive for the coefficient of X1 shows the increment in ?R with increase in stabilizer concentration. The positive incentive for the coefficient of X2 shows increases in ?R with increases in stirring speed.
89.77+6.06X1+0.300X2+0.8625X3+0.05X1X2-0.025X1X3-0.150X2X3-0.5458X12-3.12X22-1.45X32
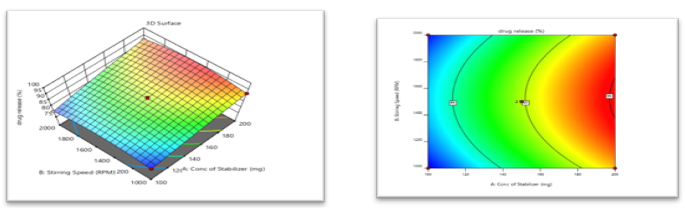
Fig No. 9 Contour plot of ?R Fig No. 10 3D- response of ?R
Table No. 11 ANOVA table for Surface Response Y3
9.2.4 Optimization of Nanosuspension System:
The formulation is optimized by the design expert software. The contain are in table below.
Table No. 12 Optimization of nanosuspension
|
Responses |
Minimum |
Maximum |
Goal |
|
Particle Size Y1 |
285 |
302 |
Minimize |
|
Zeta Potential Y2 |
12.3 |
15.7 |
Minimize |
|
?R Y3 |
80.2 |
94.6 |
Maximize |
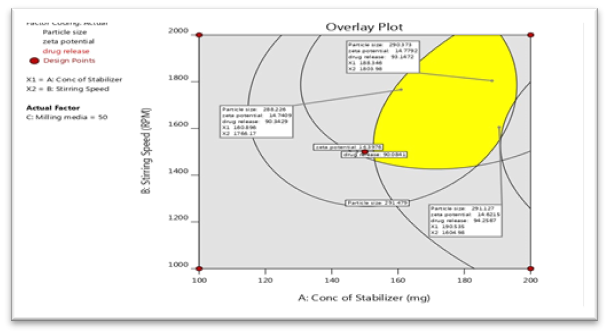
Fig No. 11 Overlay Plot of Checkpoint Batch
10. RESULT AND DISCUSSION OF BRB NANOSUSPENSION GEL
10.1 Particle size and size Distribution
The particle size analysis was performed of all F1-F15 Batches.
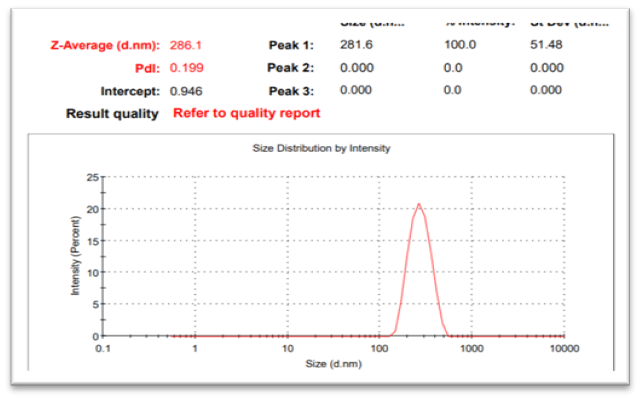
Fig No. 11 (Particle size graph of F6 batch)
From the above graph it can be concluded that result of F6 batch particle size is optimum and that is 280nm.
10.2 Scanning Electron Microscopy (SEM) Analysis
The nanoparticles surface morphology and shape were visualized under SEM Instrument. The drug loaded nanoparticle were found to be spherical.
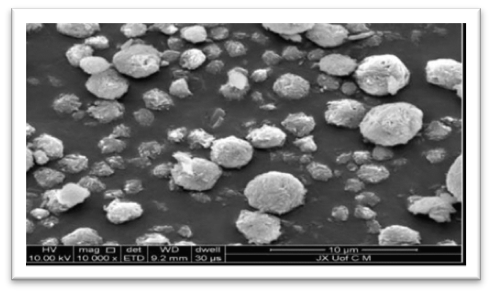
Fig No. 12 (SEM graph of F6 batch)
10.3 Zeta potential
The Nanosuspension was stabilized by various stabilizer and non-ionic surfactants. The electrostatic repulsion is leads to stabilized the suspension and the measuring of electrostatic repulsion is called as zeta potential measurement. The good zeta potential of the sample is higher than +30 mV or lower than -30 mV. The formulation F6 shows the -14.8mV.
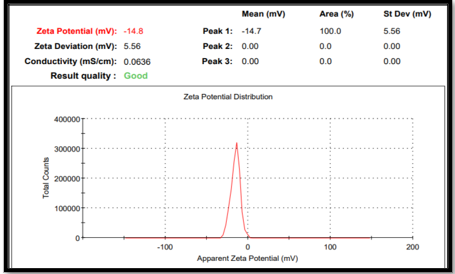
Fig N0. 13 (Zeta Potential graph of F6 batch)
10.4 PDI (Polydispersity Index)
Polydispersity index (PDI) is a measure of particle size homogeneity and it varies from 0.0 to 1.0. Polydispersity is the ratio of standard deviation to mean particle size; hence, it indicates the uniformity of particle size within the formulation. The higher the polydispersity, the lower the uniformity of the particle size in the formulation. The closer to zero the polydispersity value, the more homogenous are the droplets. The polydispersity index of all formulations is shown in Table. The polydispersity index was found to be in between 0.954-0.712for formulations F1-F15.
10.5 pH
The scalp pH is 5.2 to 5.5. the uncontrolled pH can cause the scalp dryness, itching and flaky scalp which further cause severe hair fall condition due to change in pH. The pH of the Formulation from F1 to F15 is shown in table and it is nearer to the skin pH from 5.0 to 5.5.
10.6 Drug Content
The drug content is calculated by takin the dose equivalent Nanosuspension and taking absorbance on UV Spectrophotometer. The dilution factor is noted and amount was calculated and it shows in table.
10.7 Entrapment Efficiency
The formula for calculation of entrapment efficiency is as follow
? = Total drug content ? Free drug /Total drug content × 100.
The entrapment efficiency was found in range from 67.41% to 80.98%. higher value shows higher drug stabilizer affinity and it shows higher drug entrapped in stabilizer which is shown in table.
Table No. 13 Result of Evaluation Parameters on Box Behnken design Batches
|
Code |
PS (nm) |
PDI |
ZP (mV) |
pH |
? |
DC (%) |
|
F1 |
360.6 |
0.788 |
-18.4 |
5.28 |
67.41 |
86.24 |
|
F2 |
310 |
0.685 |
15.2 |
5.24 |
72.84 |
89.24 |
|
F3 |
294.9 |
0.510 |
12.3 |
5.37 |
77.03 |
94.68 |
|
F4 |
342.5 |
0.694 |
17.5 |
5.29 |
69.87 |
92.22 |
|
F5 |
302.5 |
0.621 |
15.5 |
5.36 |
75.64 |
85.25 |
|
F6 |
286.1 |
0.199 |
-14.8 |
5.54 |
80.98 |
98.86 |
|
F7 |
324.2 |
0.571 |
12.1 |
5.55 |
71.35 |
91.86 |
|
F8 |
293.7 |
0.477 |
-11.9 |
5.49 |
76.19 |
94.26 |
|
F9 |
291.2 |
0.439 |
10.4 |
5.37 |
79.84 |
88.25 |
|
F10 |
293.5 |
0.562 |
14.3 |
5.56 |
68.41 |
86.24 |
|
F11 |
295,4 |
0.641 |
15.7 |
5.54 |
74.86 |
89.25 |
|
F12 |
287.2 |
0.243 |
-14.8 |
5.39 |
78.03 |
95.68 |
|
F13 |
296.5 |
0.567 |
12.3 |
5.20 |
70.87 |
93.24 |
|
F14 |
301.7 |
0.762 |
-14.6 |
5.47 |
72.36 |
94.86 |
|
F15 |
291.3 |
0.543 |
-12.3 |
5.52 |
78.19 |
96.28 |
|
Time |
F1 |
F2 |
F3 |
F4 |
F5 |
F6 |
F7 |
F8 |
F9 |
||||||
|
0 |
0.14± 0.012 |
0.21± 0.015 |
0.13± 0.017 |
0.18± 0.78 |
0.12± 0.028 |
0.11± 0.016 |
0.12± 0.037 |
0.12± 0.018 |
0.23± 0.34 |
||||||
|
1 |
5.21± 0.038 |
6.74± 0.031 |
7.14± 0.038 |
7.23± 0.38 |
7.77± 0.17 |
8.10± 0.061 |
7.67± 0.017 |
7.54± 0.35 |
8.10± 0.034 |
||||||
|
2 |
12.4± 0.037 |
12.87 ±0.028 |
13.87 ±0.087 |
14.87 ±0.18 |
15.49 ±0.38 |
15.67 ±0.037 |
14.87 ±0.038 |
14.9± 0.038 |
15.23 ±0.68 |
||||||
|
3 |
18.64 ±0.049 |
20.4± 0.018 |
20.67± 0.087 |
22.17 ±0.038 |
23.19 ±0.017 |
24.68 ±0.39 |
22.18 ±0.017 |
22.18 ±0.028 |
22.14 ±0.35 |
||||||
|
4 |
25.47 ±0.012 |
26.47 ±0.018 |
27.13 ±0.018 |
29.67 ±0.018 |
30.90 ±0.012 |
32.18 ±0.71 |
30.58 ±0.038 |
30.8 ±0.019 |
30.98 ±0.39 |
||||||
|
5 |
30.87 ±0.039 |
34.1 ±0.038 |
35.1 ±0.038 |
37.69 ±0.07 |
37.19 ±0.01 |
40.87 ±0.081 |
38.48 ±0.018 |
38.49 ±0.38 |
40.87 ±0.91 |
||||||
|
6 |
38.17 ±0.36 |
40.8 ±0.028 |
42.87 ±0.038 |
45.68 ±0.038 |
43.87 ±0.019 |
48.39 ±0.017 |
47.82 ±0.0147 |
47.21 ±0.39 |
47.29 ±0.37 |
||||||
|
7 |
44.10 ±0.21 |
48.3 ±0.038 |
50.73 ±0.07 |
52.17 ±0.08 |
54.09 ±0.38 |
56.72 ±0.03 |
55.76 ±0.017 |
55.15 ±0.01 |
55.14 ±0.67 |
||||||
|
8 |
52.17 ±0.128 |
54.9 ±0.098 |
56.10 ±0.098 |
60.71 ±0.071 |
60.13 ±0.018 |
64.87 ±0.028 |
62.87 ±0.38 |
62.18 ±0.028 |
63.87 ±0.61 |
||||||
|
9 |
57.98 ±0.38 |
62.17 ±0.21 |
66.34 ±0.21 |
67.21 ±0.08 |
68.11 ±0.03 |
73.21 ±0.03 |
70.38 ±0.97 |
71.20 ±0.37 |
72.09 ±0.37 |
||||||
|
10 |
64.33 ±0.078 |
69.12 ±0.038 |
71.98 ±0.38 |
76.12 ±0.089 |
75.89 0.037 |
81.08 0.018 |
78.25 ±0.48 |
78.29 ±0.34 |
81.09 ±0.039 |
||||||
|
11 |
71.2 ±0.098 |
74.87 ±0.05 |
78.21 ±0.07 |
82.19 ±0.012 |
84.21 ±0.039 |
89.21 0.038 |
87.21 ±0.018 |
86.12 ±0.12 |
88.12 ±0.018 |
||||||
|
12 |
78.89 ±0.15 |
82.87 ±0.079 |
86.89 ±0.018 |
91.86 ±0.38 |
92.73 ±0.018 |
98.27 ±0.017 |
95.67 ±0.038 |
95.47 ±0.38 |
97.28 ±0.037 |
||||||
|
F14 |
301.7 |
0.762 |
-14.6 |
5.47 |
72.36 |
94.86 |
|
||||||||
|
F15 |
291.3 |
0.543 |
-12.3 |
5.52 |
78.19 |
96.28 |
|
||||||||
10.8 In Vitro Drug Release study of Nanosuspension
Table No. 14 In Vitro Drug Release of Box Behnken Batch
|
Time (HRS) |
F10 |
F11 |
F12 |
F13 |
F14 |
F15 |
|
0 |
0.38± 0.015 |
0.21± 0.78 |
0.17± 0.012 |
0.16± 0.037 |
0.11± 0.017 |
0.18± 0.028 |
|
1 |
6.78± 0.031 |
7.18± 0.38 |
5.38± 0.038 |
7.78± 0.017 |
7.77± 0.038 |
7.14± 0.17 |
|
2 |
12.38 ±0.028 |
14.22 ±0.18 |
12.4± 0.037 |
14.87 ±0.038 |
13.87 ±0.087 |
15.49 ±0.38 |
|
3 |
20.4± 0.018 |
22.17 ±0.038 |
18.64 ±0.049 |
22.18 ±0.017 |
20.67± 0.087 |
23.19 ±0.017 |
|
4 |
26.47 ±0.018 |
29.67 ±0.018 |
25.47 ±0.012 |
30.58 ±0.038 |
27.13 ±0.018 |
30.90 ±0.012 |
|
5 |
34.1 ±0.038 |
37.69 ±0.07 |
30.87 ±0.039 |
38.48 ±0.018 |
35.1 ±0.038 |
37.19 ±0.01 |
|
6 |
40.8 ±0.028 |
45.68 ±0.038 |
38.17 ±0.36 |
47.82 ±0.0147 |
42.87 ±0.038 |
43.87 ±0.019 |
|
7 |
48.3 ±0.038 |
52.17 ±0.08 |
44.10 ±0.21 |
55.76 ±0.017 |
50.73 ±0.07 |
54.09 ±0.38 |
|
8 |
54.9 ±0.098 |
60.71 ±0.071 |
52.17 ±0.128 |
62.87 ±0.38 |
56.10 ±0.098 |
60.13 ±0.018 |
|
9 |
62.17 ±0.21 |
67.21 ±0.08 |
57.98 ±0.38 |
70.38 ±0.97 |
66.34 ±0.21 |
68.11 ±0.03 |
|
10 |
69.33 ±0.038 |
76.25 ±0.089 |
64.38 ±0.078 |
78.98 ±0.48 |
72.63 ±0.38 |
76.89 0.037 |
|
11 |
72.89 ±0.05 |
82.28 ±0.012 |
71.89 ±0.098 |
87.21 ±0.018 |
78.21 ±0.07 |
84.21 ±0.039 |
|
12 |
81.27 ±0.079 |
81.86 ±0.38 |
95.89 ±0.15 |
85.67 ±0.038 |
96.89 ±0.018 |
82.73 ±0.018 |
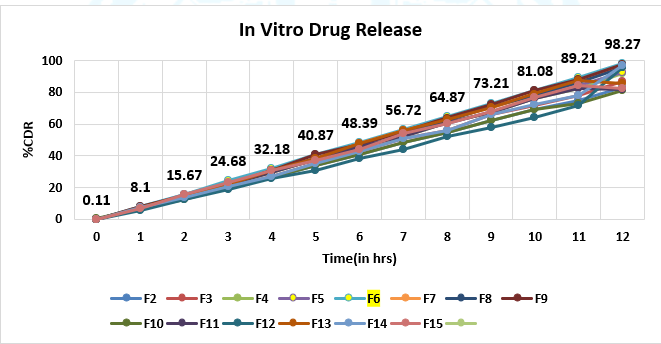
Fig No. 14 In Vitro Drug Release of F1-F15 Batch
10.9 Characterization of BRB loaded Nanosuspension Gel
Table No. 15 Results for BRB loaded Nanosuspension gel
|
Sr. No. |
Parameters |
Result |
|
1 |
pH |
5.5 |
|
2 |
Viscosity (cps) |
5418.9 cps |
|
3 |
Spreadability (cm/gm) |
4.7 cm/gm |
|
4 |
Appearance |
Fade |
|
5 |
Homogeneity |
Homogeneous |
|
6 |
Extrudability |
Good |
|
7 |
Mucoadhesive strength |
18148.5 ± 2.66 |
10.9.1 In Vitro Evaluation of Nanosuspension Based gel
Table No. 16 (In Vitro Drug Release of Nanosuspension based gel)
|
0 |
0.11±0.21 |
|
2 |
7.80±0.038 |
|
4 |
14.77±0.067 |
|
6 |
20.16±0.017 |
|
8 |
29.36±0.68 |
|
10 |
38.14±0.018 |
|
12 |
45.09±0.28 |
|
14 |
51.36±0.39 |
|
16 |
62.33±0.071 |
|
18 |
72.23±0.039 |
|
20 |
80.08±0.043 |
|
22 |
88.31±0.39 |
|
24 |
96.17±0.017 |
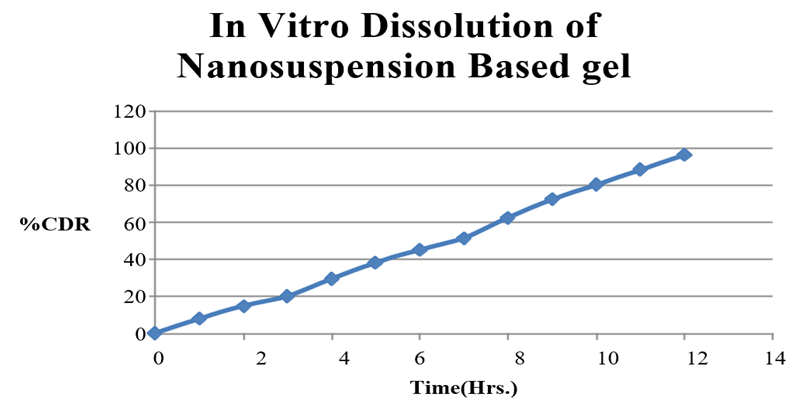
Fig No.15 In vitro Drug Release of Nanosuspension Based Gel
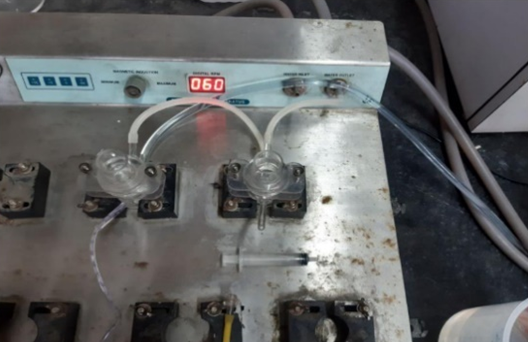
Fig No. 16 Franz Diffusion Cell
10.9.2 Evaluation of Nanosuspension gel
1. pH
The pH of the formulation is to be 5.5 which can reduce irritation on application of formulation and also it complies with scalp pH hence is suitable for increasing hair growth effects.
2.Viscosity
Viscosity of the formulation is important since higher the viscosity of the formulation means higher the retention time for absorption and penetration. The viscosity of the formulation was determined to be 55000 cps at 0.5% concentration by Brookfield viscometer.
3. Spreadability
Spreadability of gel was determined by taking 0.5gm of gel between two cellophane membranes and placing 100gm weight on it for 1 minute. The diameter of the area in which the gel got spread was measured to be 4-5 cm/gm gel.
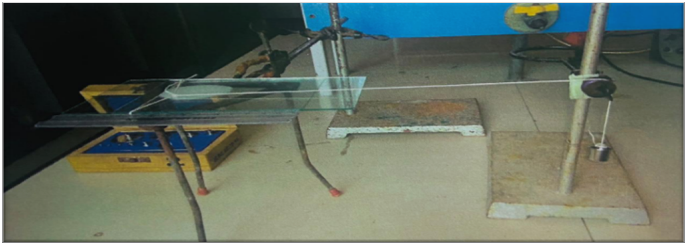
Fig No. 17 Spreadability of Nanosuspension gel
4. Appearance and homogeneity
The appearance and homogeneity of gel is visually evaluated.
5. Extrudability
The Extrudability Study shows good extrudability for optimized batch F6. Due to optimum concentration of gelling agent.
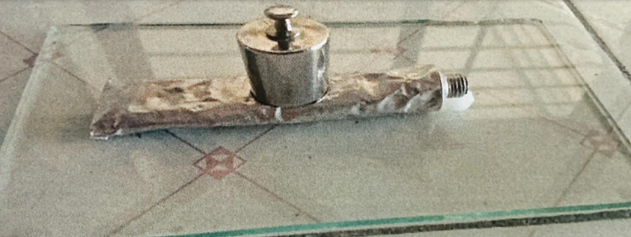
Fig No. 18 Extrudability of Nanosuspension gel
6. Mucoadhesive strength
The mucoadhesive force was determined using modified two-pan balance method. 18.5 ml of water was required to be added to detach the cellophane membrane from the gel. Hence, the mucoadhesive force was calculated as 18150 dynes/cm2 using Equation (6.2).
F= w x g …………………..Equation 6.2
=18.5 x 981 dynes/cm2
= 18148.5 dynes/cm2
Where F is the mucoadhesion force (dynes / cm2),
w is the minimum weight required to break the bond (grams),
g is the acceleration due to gravity (cm/s2).
11 CONCLUSIONS
The BRB nanosuspension was successfully formulated using the media milling technique, a simple and scalable manufacturing process. The prepared nanosuspension was evaluated through particle size analysis and in vitro drug release studies. Findings revealed that drug release rates increased with higher stabilizer concentrations and elevated stirring speeds. To identify the optimal formulation, various evaluations were conducted, including particle size measurement, zeta potential analysis, morphological assessment via SEM, and in vitro drug release studies. Once the best formulation was determined, it was incorporated into a hair gel. The resulting BRB-loaded nanosuspension gel was clear, displayed excellent homogeneity, and maintained a pH level within the normal scalp range. A comparative drug release study between the BRB nanosuspension gel and the pure BRB nanosuspension demonstrated enhanced penetration and sustained drug release through hair follicles. This prolonged release profile suggests that the formulation is highly effective for the treatment of alopecia.
REFERENCES


Vaibhavi Bharatia*, Dr. Vineet Jain, Formulation, Development and Evaluation of Baricitinib Loaded Nanosuspension Gel by Transfollicullar Drug Delivery System, Int. J. of Pharm. Sci., 2025, Vol 3, Issue 1, 2470-2490. https://doi.org/10.5281/zenodo.14770269
 10.5281/zenodo.14770269

