Department of Pharmaceutics, Karavali College of Pharmacy, Mangalore, Karnataka, India.
Gastro retentive drug delivery is an approach to prolong gastric residence time, there by targeting site-specific drug release in the upper gastro intestinal tract (GIT) for local and systemic effect. The present study has been a satisfactory attempt to formulate floating drug delivery system of Acetazolamide, an orally administered Carbonic anhydrase inhibitor which is used in the treatment of glaucoma with a view of improving its bioavailability and giving controlled release of drug. In the present study 6 formulations were prepared by using polymer like HPMC K100M and HPMC K15M in different concentration ratio and combination of polymer by direct compression method. Citric acid and sodium bicarbonate is used as gas generating agent. The prepared tablets were evaluated for precompression parameters like bulk density, tapped density, angle of repose, Carr’s index, Hausner’s ratio. The formulations evaluated for post compression parameters like Hardness, friability, weight variation, thickness, drug content and swelling index. All the formulations show result in acceptable range. All the twelve formulations were subjected to in-vitro buoyancy and dissolution study. Based on results obtained for pre compression parameters and post compression parameters, in-vitro dissolution study two best formulations were selected and validated. Short-term stability study was done for four best formulations.
Despite the tremendous advancement in drug delivery, oral route is the most preferred route to the systemic delivery. Controlled release systems for oral use are mostly solid and based on dissolution or diffusion or combination of both the mechanisms in the control release rate of the drug. Drugs that are easily absorbed from the gastro intestinal tract (GIT) and have short half lives are eliminated quickly from the systemic circulation. Frequent dosing of these drugs is required to achieve suitable therapeutic activity. To avoid this limitation, the development of oral sustained-controlled release formulations is an attempt to release the drug slowly into the gastrointestinal tract (GIT) and maintain an effective drug concentration in the systemic circulation for a long time. After oral administration, such a drug delivery would be retained in the stomach and release the drug in controlled manner, so that the drug could be supplied continuously to its absorption sites in the gastrointestinal tract (GIT). Prolonged gastric retention improves bioavailability, increases the duration of drug release, reduces drug waste, and improves the drug solubility that are less soluble in a high pH environment. Also prolonged gastric retention time (GRT) in the stomach could be advantageous for local action in the upper part of the small intestine e.g. treatment of peptic ulcer, etc. Gastro-retentive drug delivery is an approach to prolong gastric residence time, thereby targeting site-specific drug release in the upper gastrointestinal tract (GIT) for local or systemic effects. 1
Action of Acetazolamide in Glaucoma:
Acetazolamide is a synthetic carbonicanhydrase inhibitor, effective in the control of fluid secretion. It is used in the preoperative management of close-angle glaucoma, or as an adjunct in the treatment of open-angle glaucoma and oedema due to congestive heart failure, drug-induced oedema and centre cephalic epilepsies. Acetazolamide is rapidly and almost completely absorbed from the GI tract (≈100%), reaching peak plasma concentrations approximately 1–3 hrs after oral administration. It irreversibly inhibits the enzyme carbonic anhydrase resulting in reduction of hydrogen ion secretion at renal tubules and an increased renal excretion of sodium, potassium, bicarbonate and water to decrease production of aqueous humor. It also inhibits carbonic anhydrase in central nervous system to retard abnormal and excessive discharge from CNS neurons. Glaucoma is a group of diseases of the eye characterized by damage to the ganglion cells and the optic nerve. If left untreated, these effects may lead to various degrees of loss of vision and blindness. Increased intraocular pressure (IOP) remains the most important risk factor for the development of glaucoma. Acetazolamide is an enzyme inhibitor that acts specifically on carbonic anhydrase, the enzyme that catalysis the reversible reaction involving the hydration of carbon and the dehydration of carbonic acid. In eye, the inhibitory action of Acetazolamide decreases the secretion of aqueous humor in ciliary body and results in drop in intraocular pressure. Carbonic anhydrase (CA), an enzyme present in the eye, reversibly catalyses the reaction of H2O and CO2 to form carbonic acid and subsequently, the bicarbonate ion. The HCO3¯ ion is responsible for the movement of Na¯ into the eye. Water follows Na¯ to form the aqueous humor. CA inhibition by agents such as ACZ, Methazolamide and Diclophenamide, decreases HCO3¯ concentration and therefore the flow of Na¯ and H2O into the posterior chamber, thus, resulting in a decreased production of aqueous humor and hence a lowering of intra ocular pressure.
METHODS
Preformulation Studies
Preformulation is defined as application of biopharmaceutical principles to the physicochemical properties of the drug. It is a phase of R & D process.
Solubility studies:
To understand the solubility profile of Acetazolamide, saturation solubility studies are carried out in various media with varying pH range. The solubility is determined in 0.1N HCl, and water.4
Melting point:
Melting point of Acetazolamide is determined by open capillary method.4
Spectroscopic studies:
Determination of λmax:
Stock solution (1000μg/ml) of Acetazolamide was prepared using 0.1N HCl. This solution was appropriately diluted with 0.1N HCl to obtain concentration of 10μg/ml. The resultant solution was scanned in the range of 200-400nm on double beam UV Spectrophotometer.
Standard calibration curve of Acetazolamide:
A concentration of 2µg/ml, 4µg/ml, 6µg/ml 8,µg/ml, 10µg/ml, 12µg/ml, 14µg/ml, 16µg/ml of Acetazolamide solution prepared. The absorbance of the solution measured at 266nm using 0.1N HCl as blank.5
Drug excipient compatibility study:
Jasco FTIR 4100 used to investigate and predict any physiochemical interaction between different excipients. A physical mixture of drug, polymer and other excipients were prepared. It was scanned from 4000 to 400 cm-1 in a FTIR spectrophotometer.3
Method of preparation of floating tablets:
Floating Tablets of Acetazolamide were prepared by direct compression technique using varying concentration of different grades of polymer with sodium bicarbonate and citric acid. Weighed ingredients passed through the sieve number 60. Then except magnesium stearate, talc all other ingredients were blended uniformly in glass mortar. After sufficient mixing of the other ingredients magnesium stearate was added, as the lubricant, and further component talc added and mixed for additional 2-3 minutes. The tablets were compressed using tablet compression machine.16
Table No.1: Formulation chart
|
Ingredients(mg) |
F1 |
F2 |
F3 |
F4 |
F5 |
F6 |
|
Acetazolamide(mg) |
125 |
125 |
125 |
125 |
125 |
125 |
|
HPMCK100M (mg) |
40 |
80 |
120 |
|
|
|
|
HPMCK15M(mg) |
|
|
|
40 |
80 |
120 |
|
NaHCO3(mg) |
40 |
40 |
40 |
40 |
40 |
40 |
|
Citricacid (mg) |
10 |
10 |
10 |
10 |
10 |
10 |
|
Lactose(mg) |
50 |
50 |
50 |
50 |
50 |
50 |
|
MCC (mg) |
121 |
81 |
41 |
121 |
81 |
41 |
|
Talc(mg) |
7 |
7 |
7 |
7 |
7 |
7 |
|
Mgstearate (mg) |
7 |
7 |
7 |
7 |
7 |
7 |
|
Total weight (mg) |
400 |
400 |
400 |
400 |
400 |
400 |
Precompression parameters:
Angle of repose:
Angle of repose (θ) of the powder, which measures theresistance to particle flow, was determined by a fixed funnel method. The height and diameter of the powder cone was measured and angle of repose was calculated using the following equation.6
tan θ = h / r or θ = tan-1 (h / r)
Where,
h = height of pile
r = radius of the base of the pile
θ = angle of repose.
Bulk density & Tapped density:
Bulk densities of granules were determined by pouring gently weighed sample through a glass funnel into a 100 ml graduated cylinder. The volume occupied by the sample was recorded. Bulk density and tapped density were calculated by the formula.6,

Post compressional parameter of Tablets:
Weight variation:
20 tablets were selected randomly from the lot and weighted individually to check for weight variation. The average weight is calculated. Percentage weight variation calculated using following formula.7
%W=WA-WI/WAx100
%W= Percentage weight variation, WA= Average weight, WI= Individual weight
Hardness:
Hardness of the tablet was determined by using the Monsanto hardness tester.7
Thickness:
The thicknesses of six tablets were measured using Vernier calipers.14
Friability test:
The 20 previously weighed tablets placed in the friability apparatus, which is given 100revolutions and the tablets are reweighed. The percentage friability is calculated by using thefollowingformula.7
%F=Wi-WF/Wi×100
%F=Percentage friability, Wi= Initial Weight, WF=Final weight
Drug content:
The quantity of tablet powder equivalent to 100mg of Acetazolamide is transferred in to a 100 ml volumetric flask and the volume is adjusted to 100 ml with 0.1N HCl. Further, 1ml of the above filtrate diluted to 100 ml with 0.1N HCl and the absorbance of the resulting solution observed at absorption maximum.18
Swelling Index:
Swelling index of the tablet determined in 0.1N HCl at the room temperature. Each batch tablet is weighed and placed in beaker containing 100ml of 0.1N HCl. The swollen weight of the tablet determined at defined time intervals. The swelling index is determined in percentage. Percent swelling is calculated by using formula.7
%SI=WF-WI/WIx100
%SI= Percentage swelling index, WF=Final weight, WI=Initial weight
In-vitro buoyancy studies:
The in vitro buoyancy is determined by floating lag time and total floating time. The tablets are placed in a 100ml beaker containing 0.1N HCl. The time required for the tablet to rise to the surface and float is determined as floating lag time (FLT) and the duration of the time the tablet constantly floats on the dissolution medium is noted as the total floating time respectively (TFT).
Dissolution study:
The 900ml of 0.1 HCl (pH 1.2) is placed in the vessel in USP apparatus –II. The medium is equilibrated to the temperature of 37? 0.5°C. The tablet is placed in the vessel up to 12 hours at 50 rpm. At definite time intervals, 5 ml of the fluid is withdrawn; filtered and again 5ml of the fresh dissolution fluid is replaced and analyzed spectrophotometrically at absorption maximum.14
Stability studies:
The stability studies conducted on optimized formulation. The formulations are packed with aluminum foil and subjected to stability studies at different temperature and humidity condition as per ICH guidelines viz. room temperature (30°C) and 75%RH. Samples were withdrawn at time intervals of 0, 30, and 60 and 90 days. These are evaluated for possible weight gain, drug content and in-vitro drug release.
RESULTS AND DISCUSSION:
Physicochemical Properties of Drug:
Table No.2: Organoleptic properties
|
Properties |
Reported |
Results |
||
|
Appearance |
White powder |
White powder |
||
|
Taste |
Bitter |
Bitter |
||
|
Odour |
Odourless |
Odourless |
||
|
Solubility |
Water |
10mg/ml |
Water |
10mg/ml |
|
0.1NHCL |
12mg/ml |
0.1NHCL |
11mg/ml |
|
|
Ethanol |
0.75mg/ml |
Ethanol |
0.70mg/ml |
|
|
Melting point |
260.50C |
2590C |
||
|
Identification (UV) |
265nm |
266nm |
||
Determination of λmax:
This is performed by using UV spectrophotometer byusing0.1N HCl as medium. Maximum absorbance was found at 266nm as shown in the figure no 1.
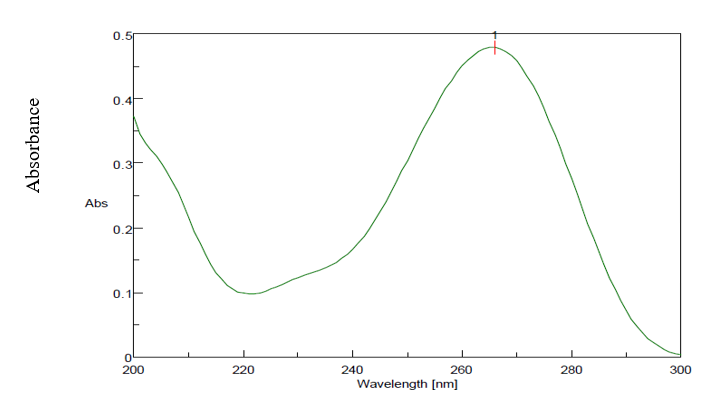
Figure No.1: UV spectra of Acetazolamide
Standard calibration curve for Acetazolamide:
Table No.3: Spectrophotometric data for standard curve of Acetazolamide
|
Sino |
Concentration (µg/ml) |
Absorbance (*) |
|
1 |
0 |
0 |
|
2 |
2 |
0.116?0.021 |
|
3 |
4 |
0.240?0.013 |
|
4 |
6 |
0.359?0.034 |
|
5 |
8 |
0.455?0.021 |
|
6 |
10 |
0.559?0.022 |
|
7 |
12 |
0.683?0.016 |
|
8 |
14 |
0.788?0.033 |
|
9 |
16 |
0.908?0.011 |
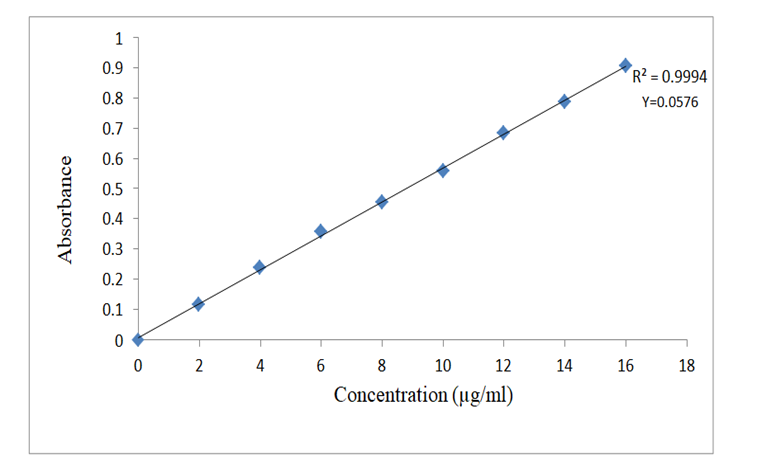
Figure No.2: Standard graph of Acetazolamide with 0.1NHCl
Drug excipients compatibility study:
The possible interaction between the drug, polymer and the other excipients was studied by Fourier transform infrared spectroscopy.
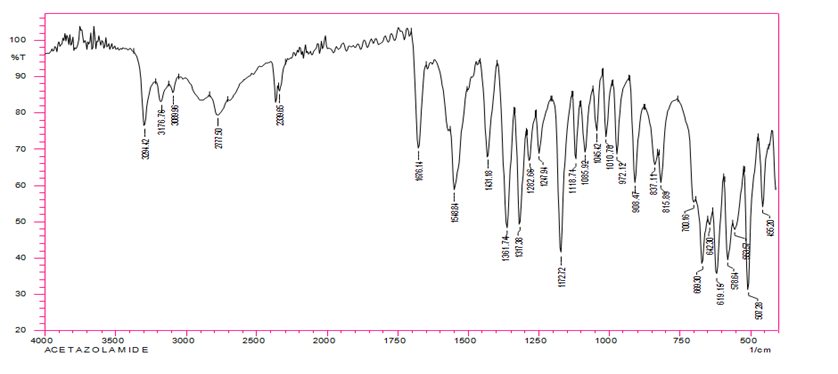
Figure No. 3: FTIR spectra of Acetazolamide
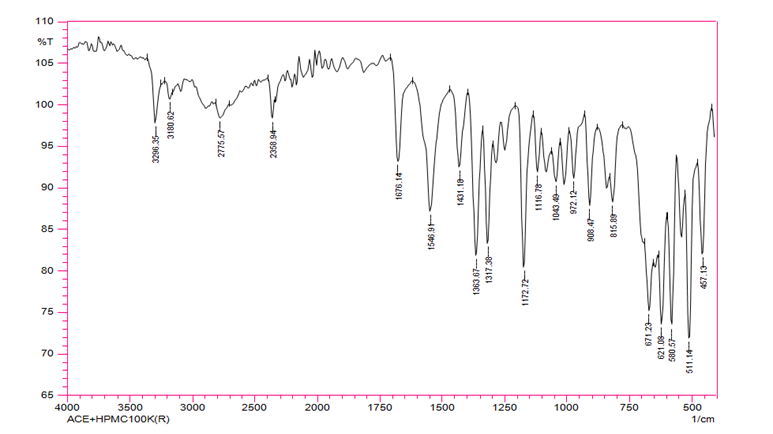
Figure No.4: FTIR spectra of Acetazolamide with HPMC K100M
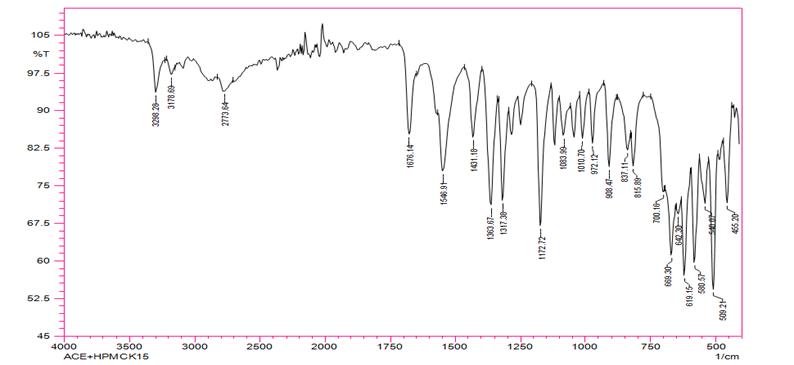
Figure No.5: FTIR spectroscopy of Acetazolamide with HPMC K15M

Figure No. 6: FTIR spectroscopy of Acetazolamide with all excipients
Compatibility studies were performed using FTIR spectrophotometer. The peaks obtained in the spectra of each physical mixture correlates with the peaks of drug spectrum.
Evaluation parameter:
Pre compression parameters:
Table No 4: Pre compressional parameters of F1 to F3 containing HPMC K100M
|
Formulation Code |
Bulk density (gm/cc±SD*) |
Tapped density (gm/cc±SD*) |
Hausner’s ratio (*) |
Carr’s Index(%±SD*) |
Angle of repose (θ±SD*) |
|
F1 |
0.408±0.021 |
0.472±0.033 |
1.157±0.02 |
13.61±0.15 |
25?55±0.40 |
|
F2 |
0.403±0.025 |
0.468±0.012 |
1.162±0.01 |
13.95±0.09 |
26?30±0.39 |
|
F3 |
0.406±0.022 |
0.473±0.012 |
1.165±0.15 |
14.21±0.58 |
27?14±0.10 |
Table No.5: Pre compressional parameters of F4 to F6 containing HPMC K15M:
|
Formulation Code |
Bulk density (gm/cc±SD*) |
Tapped density (gm/cc±SD*) |
Hausner’s Ratio (*) |
Carr’s Index (%±SD*) |
Angle of repose (θ±SD*) |
|
F4 |
0.382?0.073 |
0.454?0.025 |
1.18?0.20 |
15.88?0.09 |
25?17 ?0.33 |
|
F5 |
0.379?0.048 |
0.468?0.073 |
1.23?0.05 |
18.93?0.15 |
26?05 ?0.54 |
|
F6 |
0.387?0.025 |
0.454?0.025 |
1.17?0.12 |
14.82?0.21 |
26?13 ?0.13 |
Post Compressional Parameters:
The six formulations were prepared by using HPMC K15M, HPMC K100M by direct compression method. The prepared Tablets were evaluated for Hardness, friability, uniformity of weight, uniformity of drug content, Floating lag time, Total floating time, in-vitro dissolution.
Table No.6: Post Compressional Parameters of F1 to F3 containing HPMC K100M
|
Formulation Code |
Hardness (kg/cm2±SD*) |
Friability(%±SD*) |
Thickness(mm±SD*) |
Weight variation (mg±SD*) |
Drug Content (%±SD*) |
|
F1 |
3.73?0.05 |
0.49?0.02 |
5.00?0.50 |
400?0.88 |
96.25?0.68 |
|
F2 |
3.97?0.03 |
0.50?0.05 |
5.30?0.27 |
400?1.35 |
98.0?0.50 |
|
F3 |
3.90?0.53 |
0.27?0.02 |
5.20?0.25 |
400?2.15 |
97.93?0.36 |
Table 7: Post Compressional Parameters of F4 to F6 Formulation HPMC K15M
|
Formulation Code |
Hardnes (kg/cm2±SD*) |
Friabily (%±SD) |
Thickness (mm±SD*) |
Weight Variation (mg±SD*) |
Drug Conten (%±SD*) |
|
F4 |
3.70?0.01 |
0.50?0.03 |
5.20?0.22 |
400?1.47 |
97.56?0.44 |
|
F5 |
3.80?0.23 |
0.90?0.04 |
5.05?0.62 |
400?1.67 |
96.8?0.24 |
|
F6 |
4.02?0.03 |
0.49?0.07 |
5.10?0.77 |
400?1.82 |
96.8?0.57 |
In-vitro studies:
In-vitro Buoyancy studies:
Table8: In-vitro Buoyancy studies of all formulation
|
Formulation Code |
Floating lag time (seconds) |
Total Floating time (hours) |
|
F1 |
46 |
6 |
|
F2 |
22 |
10 |
|
F3 |
15 |
12 |
|
F4 |
49 |
7 |
|
F5 |
14 |
9 |
|
F6 |
11 |
12 |
Results of all formulation were tabulated in the table no 20. Formulation F6 showed least Floating lag time 11seconds, where formulation F4 showed highest floating lag time 49 seconds. The formulation F1 showed least total floating time 6 hours and the formulation F3, F6, showed highest total floating time 12 hours.
Swelling Characteristics:
|
Formulation |
Initial weight of table (mg) |
Time(hours) |
%SI |
||
|
2 |
4 |
6 |
|||
|
F1 |
400?0.18 |
475.15?0.25 |
500.33?0.44 |
52.14?0.53 |
31.35 |
|
F2 |
395?0.4 |
550.12?0.33 |
580.11?0.32 |
600.33?0.07 |
51.89 |
|
F3 |
410?0.31 |
590.24?0.45 |
650.16?0.42 |
685.21?0.08 |
67.07 |
|
F4 |
400?0.83 |
440.21?0.08 |
460.45?0.332 |
475.10?0.5 |
15.85 |
|
F5 |
410?0.50 |
470.13?0.33 |
500.08?0.12 |
530.55?0.54 |
32.5 |
|
F6 |
400?0.55 |
510.06?0.15 |
550.12?0.34 |
585.43?0.32 |
42.68 |
In-vitro dissolution study:
In-vitro dissolution study of all formulations
In-vitro drug release study was performed using USP dissolution apparatus at 50 rpm using 900ml of 0.1N HCl maintained at 37.5ºC as the dissolution medium.
Table 9: In-vitro dissolution study of F1-F3 formulation containing HPMC K100M
|
Time (hours) |
Percentage cumulative Drug Release (%) |
||
|
F1 |
F2 |
F3 |
|
|
1 |
59.36 |
22.80 |
13.74 |
|
2 |
71.18 |
35.33 |
17.63 |
|
3 |
79.14 |
37.81 |
23.33 |
|
4 |
89.12 |
44.51 |
34.16 |
|
5 |
95.20 |
50.07 |
37.31 |
|
6 |
99.11 |
59.10 |
40.44 |
|
7 |
|
68.04 |
43.9 |
|
8 |
|
77.27 |
50.57 |
|
9 |
|
89.34 |
58.24 |
|
10 |
|
99.09 |
65.41 |
|
11 |
|
|
71.70 |
|
12 |
|
|
82.64 |
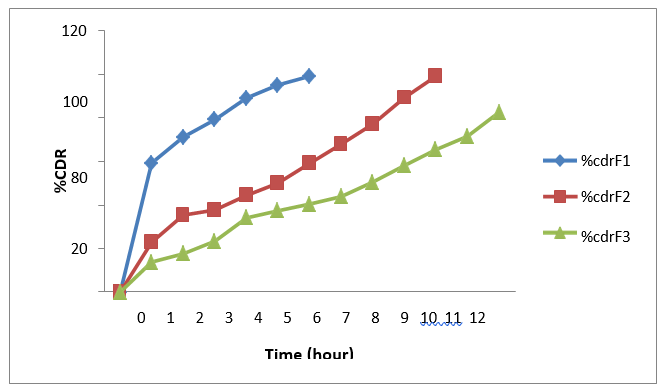
Figure7: In-vitro dissolution of F1-F3 formulation containing HPMC K100M
Table10: In-vitro dissolution study of F4-F6 formulation containing HPMC K15M
|
Time (hours) |
Percentage cumulative Drug Release (%) |
||
|
F4 |
F5 |
F6 |
|
|
1 |
54.26 |
17.83 |
17.63 |
|
2 |
61.66 |
22.12 |
22.00 |
|
3 |
71.91 |
27.14 |
25.37 |
|
4 |
79.45 |
33.03 |
31.14 |
|
5 |
91.77 |
41.87 |
42.89 |
|
6 |
97.93 |
66.46 |
53.09 |
|
7 |
99.00 |
77.98 |
56.72 |
|
8 |
|
85.80 |
66.76 |
|
9 |
|
89.34 |
74.19 |
|
10 |
|
99.42 |
82.72 |
|
11 |
|
|
87.98 |
|
12 |
|
|
94.81 |
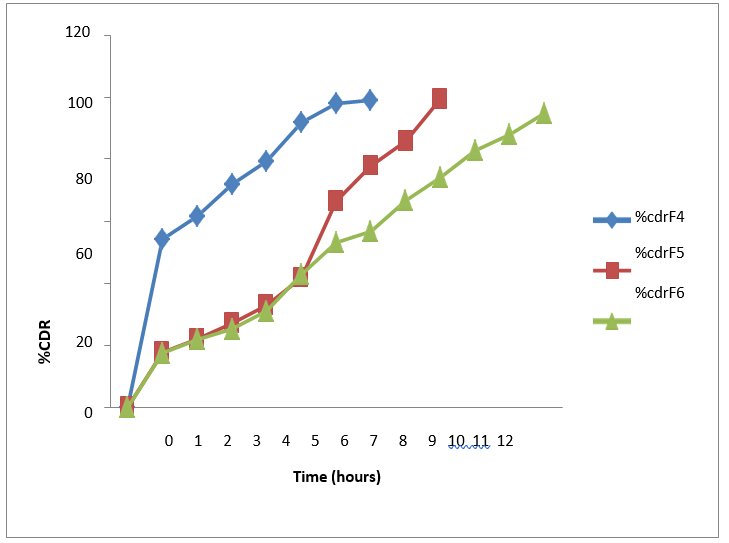
Figure8: In-vitro dissolution studies of F4-F5 formulation containing HPMC K15M
Stability Studies:
Table11: Stability study of best formulation F3
|
Time(month) |
Drug Content (%) |
Floating Behavior |
Drug release atend of 12hrs (%) |
|
|
Floating Lag time (sec) |
Total Floating time (hrs) |
|||
|
|
* |
* |
* |
* |
|
Zero |
97.93 |
15 |
12 |
82.64 |
|
1 month |
97.33 |
14 |
12 |
82.60 |
|
2 month |
97.00 |
14 |
12 |
82.44 |
|
3 month |
96.55 |
14 |
12 |
82.30 |
Table12: Stability study of best formulationF6
|
Time(month) |
Drug Content (%) |
Floating Behavior |
Drug release at end of 12hrs (%) |
|
|
Floating Lag time (sec) |
Total Floating time (hrs) |
|||
|
|
* |
* |
* |
* |
|
Zero |
96.8 |
11 |
12 |
94.81 |
|
1 month |
96.5 |
11 |
12 |
94.52 |
|
2 months |
96.1 |
11 |
12 |
94.10 |
|
3 months |
95.5 |
10 |
12 |
93.8 |
Short term accelerated stability study was performed on the best formulations by storing the sample at 30?2ºC with 75?5%RH for 90 days. The sample were tested for any changes in physical appearance, drug content, In-vitro buoyancy study, in-vitro drug release studies at monthly intervals. The results of stability did not show any significant change in physical appearance, drug content, floating lag time and in-vitro dissolution studies of above two formulations as shown in the TableNo11 and 12.
REFERENCES


Femina Aranha*, Anusha, Formulation and Evaluation of Floating Tablets of Acetazolamide, Int. J. of Pharm. Sci., 2025, Vol 3, Issue 6, 3618-3629. https://doi.org/10.5281/zenodo.15722569
 10.5281/zenodo.15722569
