P. Wadhwani college of pharmacy, Yavatmal
The present study focuses on the development and evaluation of sustained release microspheres of Vinpocetine, a poorly water-soluble drug with a short biological half-life, using the spray drying technique. The objective was to enhance the drug’s bioavailability and prolong its therapeutic effect through controlled release delivery. Ethyl cellulose and hydroxypropyl methylcellulose (HPMC) were employed as polymeric carriers to encapsulate Vinpocetine, with varying polymer-to-drug ratios. The prepared microspheres were characterized for particle size, morphology, drug entrapment efficiency, and in-vitro drug release behavior. Scanning Electron Microscopy (SEM) confirmed spherical, discrete microspheres with smooth surfaces. The drug entrapment efficiency ranged between 26% and 85%, while the in-vitro release studies demonstrated a sustained drug release profile extending up to 10 hours. The findings suggest that spray-dried Vinpocetine microspheres present a promising formulation strategy for sustained drug delivery, potentially improving patient compliance and therapeutic outcomes.
Epilepsy is a chronic neurological disorder characterized by recurrent, unprovoked seizures resulting from abnormal electrical activity in the brain. Despite the availability of various antiepileptic drugs (AEDs), many patients continue to experience seizures or suffer from undesirable side effects associated with conventional therapies. This has led to a growing interest in exploring neuroprotective agents with anticonvulsant properties that can offer improved safety and efficacy profiles. Vinpocetine, a synthetic derivative of the vinca alkaloid vincamine, has garnered attention for its multiple pharmacological effects, including vasodilatory, neuroprotective, antioxidant, and anticonvulsant properties. Vinpocetine enhances cerebral blood flow, inhibits voltage-gated sodium channels, modulates calcium influx, and suppresses the release of pro-inflammatory cytokines, which collectively contribute to its potential therapeutic benefits in neurological disorders such as epilepsy, ischemic stroke, and dementia. Preclinical studies have demonstrated that Vinpocetine can reduce seizure severity and frequency by stabilizing neuronal membranes and preventing excitotoxic damage, making it a promising adjunct or alternative therapy in epilepsy management. However, Vinpocetine’s clinical application is limited by its poor aqueous solubility, extensive first-pass metabolism, and short biological half-life (approximately 1–2 hours), resulting in low oral bioavailability and the need for frequent dosing. To overcome these challenges, advanced drug delivery systems such as microspheres have been explored to enhance drug stability, prolong therapeutic action, and improve patient compliance. Microspheres are free-flowing, spherical particulate systems that offer controlled and sustained drug release by encapsulating the active pharmaceutical ingredient within a polymeric matrix. Among various preparation methods, the spray drying technique is widely favored for its simplicity, scalability, and ability to produce uniform, stable microspheres with desirable physicochemical properties. In the present study, sustained release microspheres of Vinpocetine were formulated using the spray drying technique, employing ethyl cellulose and hydroxypropyl methylcellulose (HPMC) as polymeric carriers. The aim was to achieve prolonged drug release, thereby maintaining therapeutic plasma concentrations over an extended period and potentially enhancing its anticonvulsant efficacy in epilepsy management. The prepared microspheres were systematically evaluated for their particle size, morphology, drug entrapment efficiency, and in-vitro drug release characteristics to assess their suitability as a sustained release delivery system.
AIM, OBJECTIVES AND NEED OF STUDY
The aim of the present work is to develop and evaluate sustained release formulation by spray drying technique
Objective:
To release the active pharmaceutical ingredient (API) in a controlled manner over an extended period, maintaining therapeutic levels.
To simplify dosing regimens and reduce frequency, improving patient adherence.
To direct API delivery to specific sites or tissues, minimizing side effects.
To enhance product stability, reducing degradation and extending shelf-life.
To tailor release profiles to match specific therapeutic needs.
To utilize spray drying's scalability and cost-effectiveness for large-scale product.
3. DRUG PROFILE
3.1. VINPOCETINE

? Chemical Name : (3α,16α)-Eburnamenine-14-carboxylic acid ethyl ester
? CB Number : CB3672651
? Molecular Formula : C22H26N2O2
? Molecular Weight : 350.45
Properties:
? Melting Point : 147-153 °C dec.
? Storage Temperature : Sealed in dry,2-8°C
? Solubility : DMSO: 5 mg/Ml
? Physical State : Powder
? Colour : White
? Boiling point : 484.44°C (rough estimate)
? Density : 1.1260 (rough estimate)
Uses:
1. Improves cerebral blood flow in stroke and cerebrovascular disorders.
2. Enhances memory and cognitive function in dementia and age-related memory loss.
3. Acts as a neuroprotective agent in neurodegenerative diseases.
Uses:
Uses:
Microcrystalline cellulose is widely used in pharmaceuticals, primarily as binder/diluents in oral tablets and capsules formulations.
Synonyms: Magnesium octadecenoate.
Empirical formula: C36H70MgO4
Molecular weight: 591.34
Uses:
Magnesium stearate is widely used in cosmetics, foods, and pharmaceutical formulations. It is primarily used as a lubricant in capsule and tablet
Standard Curve of Vinpocetine :
50 mg of drug vinpocetine was dissolved in 75ml methanol(cosolvent) then volume was make up to 100ml with phosphate buffer 6.8 make stock solution of concentration 500µg/ml. Then 0.5 ml of stock solution was taken and diluted upto 100ml with the buffer of pH 6.8 and to get concentration of 5µg/ml and in similar way dilution were made as 5, 10, 15, 20 and 25 µg/ml respectively and absorbance measured at 269 nm by UV visible spectrophotometer. The absorbance values were plotted against concentration (µg/ml) to obtain the standard calibration curve.
It's important to check any kind of interaction between drug candidate and polymer. The polymers which are to be incorporated into formulation should be compatible with the drug This compatibility study or interaction study was done using Fourier Transformed Infrared Spectroscopy.
IR Spectra of pure Vinpocetine maleate and Polymer Viz. HPMC were taken separately. Then to know if there is any interaction between and polymer, IR spectra of Vinpocetine maleate and polymers were taken in combination. The results shows that there was seen between drug Vinpocetine and polymers as there was no significant change in the pattern of peaks of optimized batch of microspheres with pure drug
Morphology of Microspheres Was examined by Scanning electron microscopy. Scanning electron micrograph of optimized batch of microspheres shows that the surface of microparticles was appearing somewhat rough & particle are present like clusters having varying size & shape
Vinpo: Vinpocetine EC: Ethyl cellulose
HPMC: Hydroxyl propyl methyl cellulose
Table No. 1. Formulation table of Vinpocetine Microspheres
|
Sr. No. |
Formulation code |
Ratio of Drug:Polymer |
Drug (Mg) |
Polymer (mg) |
Solvent Ethanol+DCM |
|
1. |
F1=vinpo+EC+HPMC |
1:1 |
500 mg |
250+250 mg |
50+50 ml |
|
2. |
F2=vinpo+EC+HPMC |
1:2 |
500 mg |
500+500 mg |
50+50 ml |
|
3. |
F3=vinpo+EC+HPMC |
1:3 |
500 mg |
500+1000 mg |
100+100 ml |
|
4. |
F4=Vinpo+EC+HPMC |
1:4 |
500 mg |
500+1500mg |
100+100 ml |
|
5. |
F5=Vinpo+EC+HPMC |
1:5 |
500 mg |
500+2000 mg |
50+50 ml |
|
6. |
F6=Vinpo+EC+HPMC |
1:6 |
500 mg |
500+2500 mg |
50+50 ml |
|
7. |
F7=Vinpo+EC+HPMC |
1:7 |
500 mg |
500+3000 mg |
50+50 ml |
The percentage yield of microsphere determined by weighing after drying. The prepared microspheres with a size ranging from 15µm to 25µm. The measured weight of prepared microspheres was divided by the total amount of all the non volatile components used for the preparation of the microspheres, which give the total percentage yield of microspheres.

Particle size was determined by using an optical microscope under regular polarized light. and the mean particle size was calculated by measuring 10-20 particles with the help of a calibrated ocular micrometer.
The microspheres were placed on the glass slide. Particle size of microspheres was measured using a Motic DMWB2-223 digital microscope fitted with a 1/3 CCD Camera emaging accessory and using Motic Images 2000 (1.3 Version) image analysis software The images of microspheres were analyzed for their average diameter and shape.
Microspheres equivalent to 10 mg of the drug were taken for evaluation. Weighed microspheres was crushed in a glass mortar and 25 mg of accurately weighed sample of this powdered was dissolved in 6.8 Phosphate buffer and methanol 25 ml of volumetric flask and volume was made up using 6.8 Phosphate buffer and analyzed spectrophotometrically at 269 nm using buffer as blank. The entrapment efficiency of various samples was calculated using the following equations:


On the basis of evaluation parameters such as drug entrapment efficiency, percentage yield and dissolution characteristics the batch that has shown the best results was optimized and advanced studies such as drug polymer interaction Fourier transformed infrared spectroscopy (FT-IR) and scanning electron microscopy studies (SEM), etc
The samples of pure drug and formulation F4 were dispersed in 200 mg of KBr powder and compressed into pellets at a pressure of 6000 kg/cm2 and analyzed. Spectral measurements were obtained by powder diffuse reflectance on a FT-infrared spectrophotometer (Shimadzu, FT-IR 8400S, Japan).
Scanning electron microscopy (Joel LV-5600, USA) was applied to obtain photomicrographs which were used to identify and confirm the surface topography of the microspheres.
The Vinpocetine SRTs were prepared by direct compression process using MCC and lactose as diluents. Each ingredient was screened through 40-mesh sieve before mixing. Microsphere containing Vinpocetine weight equivalent to 12 mg of dose and mixed in polyethylene bag. Magnesium stearate and talc were added as glidant, absorbent, and lubricant mixed for further 2min. The obtained mixture was compressed into tablets of 6 inch in diameter by a manual single stroke tableting machine. The hardness of the tablets was controlled between 3-4 kg.
Table No. 2. Spray dried microsphere (quantity in microsphere )
|
Sr. No |
Name of Ingredient |
Quantity taken |
|
1. |
Vinpocetine Microsphere Equivalent to 12 mg |
120 mg |
|
2. |
Microcrystalline cellulose |
600 mg |
|
3. |
Lactose |
200 mg |
|
4. |
Magnesium stearate |
30 mg |
|
5. |
Talc |
50 mg |
|
6. |
Total |
1000 mg |
Method
Bulk density Apparent bulk density is determined by pouring a weighed quantity of into graduated cylinder and measuring the volume and weight. Bulk density can be calculated by using following formula
Bulk density: (Db)-M/Vo
Where, M = mass of powder taken
Vo = unsettled apparent volume Determinations were carried out in three replicates.
It has been stated that the bulk density values have less than 1.2 g/cm³ indicates good packing and values greater than 1.5 g/cm³ indicates poor packing.
Tapped density is the bulk density of powder which has been compacted by tapping on vibration. Tapped density was determined by placing a graduated cylinder contaming a known mass of powder on mechanical tapping apparatus, which is operated for a fixed number of taps (100) or until the powder bed volume has reached a minimum. The tapped density is computed by taking the weight of power in cylinder and final volume.
Tapped density: Dt=M/Vt
Where, M = mass of powder
Vt = bulk volume of the powder
Compressibility Index and Hausner Ratio are measures of the propensity of a powder to be compressed. As such they are measures of relative importance of interparticulate interactions. In free-flowing powder, such interactions are less significant and bulk and apped density difference is close. For poorer flowing materials, this difference is greater.
a) Compressibility Index (% Compressibility)
Carr's compressibility index le % compressibility indicates the flow property and packing ability of the tablet. When the % compressibility, ranges from 5 to 16. the materials have acceptable flow property and packing ability,
Compressibility Index was calculated using following, equation.
Compressibility index = [(Dt-Db)/Dt)] x100
Where, Dt = tapped density of powder Db = bulk density of powder
Table No. 3. Particle Consideration Of Compressibility Index
|
Sr. No. |
% Compressibility Index |
Flow |
|
1 |
5-15 |
Excellent |
|
2 |
12-16 |
Good |
|
3 |
18-21 |
Fair to passable |
|
4 |
23-35 |
Poor |
|
5 |
33-38 |
Very poor |
|
6 |
?40 |
Very very poor |
B) Hausner Ratio:
The Hausner ratio indicates the flowability and packing ability of the tablet When the Hausner ratio is close to 1, materials have acceptable flow and packing ability
The Hausner ratio was calculated using the formula
Hausner ratio = Dt/Do
Where, Dt = tapped density Do = bulk density
Table No.4. Practical Consideration of Hausner Ratio
|
Sr. No. |
Hausner ratio |
Flow |
|
1 |
?1.25 |
Good |
|
2 |
1.25 |
Poor |
|
3 |
?1.25-1.5 |
Very poor |
Angle of repose is determined by using funnel method. The accurately weighed blend is take in a funnel. The height of the funnel is adjusted in such a way that the tip of the funnel just touches the apex of the heap of blend (2cm). The drug (as solid dispersion)-excipient blend is allow to flow through the funnel freely on to the surface. The diameter of the powder cone is measured and angle of repose is calculated using the following equation.
Angle of repose (0) = tan-1 (h/r)
Where, h= height of a pile (2 cm) r = radius of pile base.
Acceptable range for angle of repose is 200 to 400. All the formulation showed and angle of repose within the range. The mean values of three determinations of angle of repose of tablet blend were taken
Table No. 5. Practical Consideration of Angle of Repose
|
Sr. No. |
Angle of Repose |
Flow |
|
1 |
?25 |
Excellent |
|
2 |
25-30 |
Good |
|
3 |
30-40 |
Passable |
|
4 |
?40 |
Very poor |
The tablet hardness, which is the force required to break a tablet in a diametric compression force. The hardness tester used in the study was Monsanto hardness tester. which applies force to the tablet diametrically with the help of an inbuilt spring. It is expressed in Kg/cm³,
Friability of the tablets was determined using Roche friability (Electrolab, Mumbai). This device subjects the tablets to the combined effect of abrasions and shock in a plastic chamber revolving at 25 rpm and dropping the tablets at a height of 6 inches in each revolution. Preweighed sample of tablets was placed in the friabilator and were subjected to 100 revolutions. Tablets were dedusted using a soft muslin cloth and reweighed.
The friability (f) is given by the formula.
F=(1-W0/W) x 100
Where,
W0 is weight of the tablets before the test and W is the weight of the tablet after the test.
The variation weight testing was carried out as per the method describe in the USP 25NF 20,2002
Method:
twenty tablets were selected from each batch and individually weighed the average weight and standard deviation of 10 tablet was calculated the batch passes the test for weight variation test if not more than two of the individual tablet weight deviates from the average weight by more than the percentage shown in officials and none deviated by more than twice the percentage shown. Then the resultants weights were compared to the average does USP weight variation test shown in table no.9.
Table No. 6. Weight Variation Of Tablet
|
Sr. No. |
Average weight of tablet (mg) |
Maximum % deviation allowed |
|
1 |
130 or less |
10.0% |
|
2 |
130 to 324 |
7.5% |
|
3 |
More than 324mg |
5% |
As per the USP the thickness and diameter was determined. For each formulation the thickness and diameter was determined by using the Digital Vernier caliper.
Method:
Vernier caliper consist of main scale and Vernier scale. For thickness determination, place the tablet in between two jaws of Vernier caliper vertically and for diameter, place the tablet horizontally. Note down the main scale reading which is the division of main scale which considers with the first division of Vernier scale. Note down the Vernier scale division which considers with the main scale division and multiply it by least count ie. 0.01 cm to get Vernier scale reading (VSR). Add the MSR and VSR to get total reading in cm/mm.
The disintegration time of the tablet was measured in 6.8 buffer (372°C) according to disintegration test apparatus with disk The time in seconds taken w the complete disintegration of the tablet with no palpable mass in the apparatus measured in seconds. Three tablets from each batch (formulation) were tested for the disintegration time calculations
In-vitro drug release study was performed at 37±0.5°C using eight station USP type-2 apparatus with paddle rotating at 50 rpm. The drug release study was carried out in 6.8 phosphate buffer by taking about 900ml of the dissolution medium. The drug release study was performed in 6.8 phosphate buffer to demonstrate the availability of Vinpocetine About 5 ml of sample was withdrawn at specified time intervals from the dissolution medium and replaced with equal volume of fresh medium . Samples were filtered through whattman?n filter paper and analyzed using UV spectrophotometer (Shimadzu UV) at 269nm.
5.7.8. Stability studies:
The tablet formulations were packed in aluminum foil and were exposed to 40°C +2°C/75% * 5% RH in humidity control oven as per ICH guidelines118 QIC: "Stability testing of new dosage forms." Sampling was done at predetermined time intervals of 0 to 30 Days.
Calibration curve of vinpocetine:
Table no.7. Calibration of Vinpocetine in pH 6.8 Phosphate buffer :
|
Sr. No. |
Volume Of stock Solution |
Concentration (ug/ml) |
Absorbance |
|
1 |
5 |
0.5 |
0.136 |
|
2 |
10 |
1 |
0.253 |
|
3 |
15 |
1.5 |
0.371 |
|
4 |
20 |
2 |
0.490 |
|
5 |
25 |
2.5 |
0.596 |

Figure No.1. Calibration curve of Vinpocetine
Table no. 8. Percentage yield of Vinpocetine Microspher:
|
BATCHES |
% YIELD |
|
F1 |
24.6 |
|
F2 |
28 |
|
F3 |
64.6 |
|
F4 |
40.5 |
|
F5 |
31.2 |
|
F6 |
35 |
|
F7 |
36.69 |
Table No. 9. Partical size Analysis of Vinpocetine Microsphere
|
Formulation code |
Average Partical Size (nm) |
|
F1 |
499.5 |
|
F2 |
487.4 |
|
F3 |
618.0 |
|
F4 |
797.8 |
|
F5 |
546.0 |
|
F6 |
560.4 |
|
F7 |
679.2 |
The average particle size of prepared spray dried microspheres was found between 487.4 nm to
797.8 nm. The average particle size of optimized batch of microspheres was found to be 797.8 nm.
Table no. 10. Drug entrapment efficiency and Drug Loading of Vinpocetine Microsphere
|
Sr.No. |
Batch No. |
Drug:Polymer Ratio |
Therotical loading % |
Actual loading% |
Drug entraptment efficiency |
|
1 |
F1 |
1:1 |
50 |
15 |
30% |
|
2 |
F2 |
1:2 |
33.33 |
8.9 |
26.70% |
|
3 |
F3 |
1:3 |
25 |
15.4 |
60.16% |
|
4 |
F4 |
1:4 |
20 |
17.12 |
85.6% |
|
5 |
F5 |
1:5 |
16.66 |
10.42 |
62.42% |
|
6 |
F6 |
1:6 |
14.28 |
6.5 |
45.5% |
|
7 |
F7 |
1:7 |
12.5 |
7.2 |
57.6% |
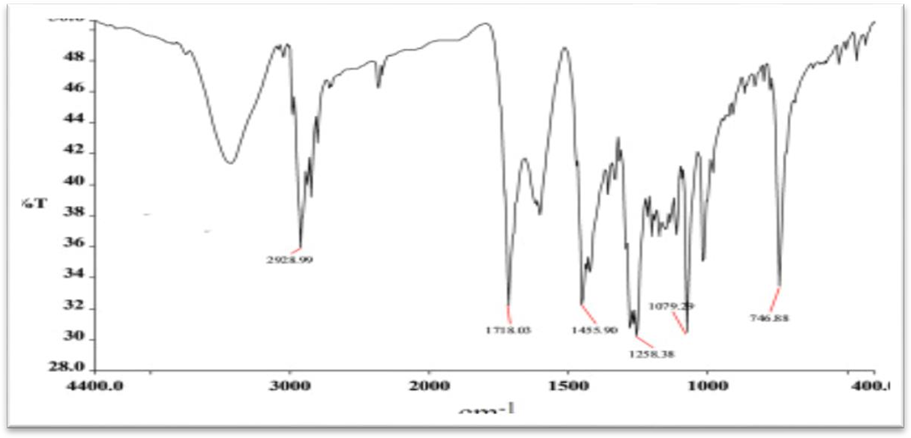
Figure No. 2. IRSpectra of Pure drug Vinpocetine
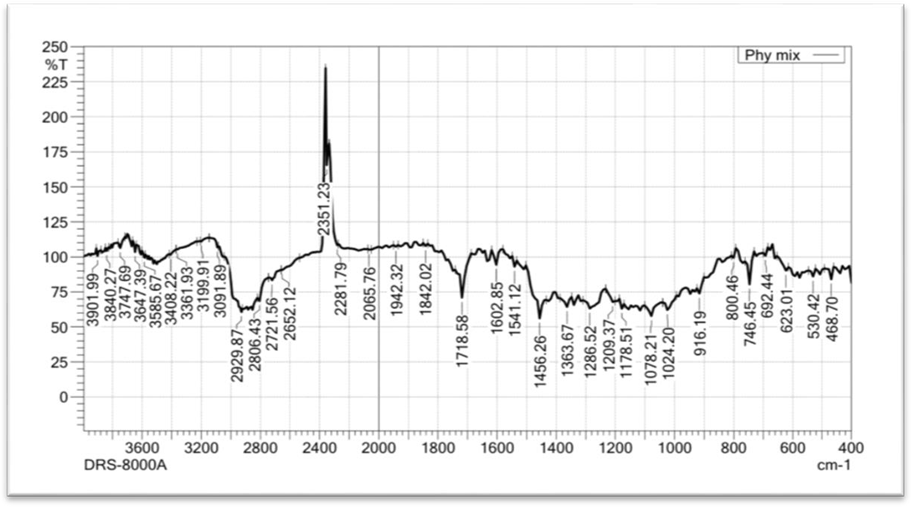
Figure No. 3. IR Spectra of Microspheres
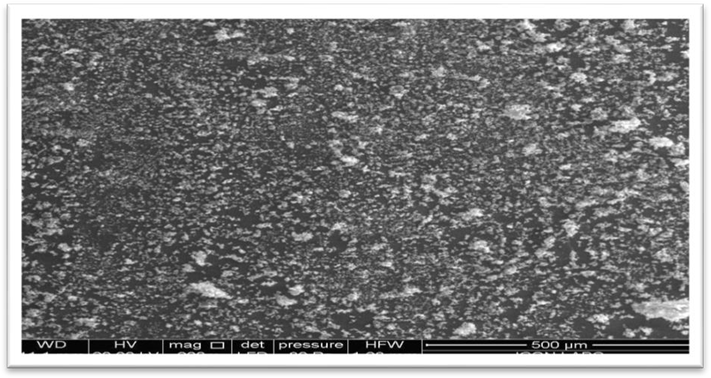
Figure No. 4 (A). Scanning electron microscopic image of optimized batch of microsphere
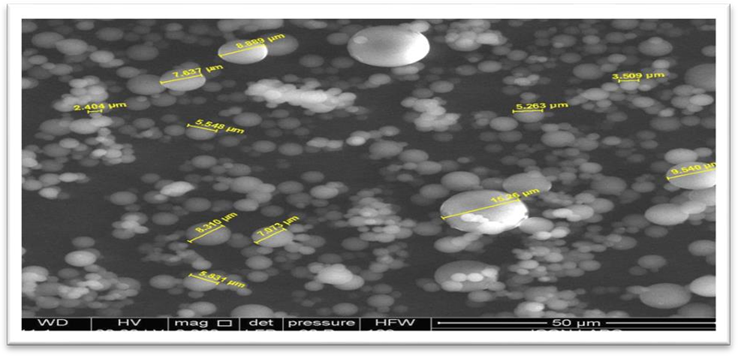
Figure No. 5(B). Scanning electron microscopic image of optimized batch of microsphere
The result of angle repose is less than 30 indicate good flow properties of sustained release powder mix. This was further supported by lower Carr's index value. Carr's index value up to 11.3% resulted in excellent flow properties. Thus, all the formulation was found to exhibit good to excellent flow properties.
Table No. 11. Pre-Compression Study of Tablet Blend
|
Formulation |
Bulk Density |
Tapped density |
Hausners Ratio |
Compressibility %Or Carrs Index |
Angle of Repose (degree) |
|
T1 |
0.49±0.03 |
0.57±0.02 |
1.16±0.03 |
15.1±1.01 |
23.89±0.45 |
|
Formulation Code |
T1 |
|
Weight Variation |
Pass |
|
Hardness(kg/Cm2) |
5.41±0.70 |
|
Thickness(mm) |
3.11±0.36 |
|
Diameter(cm) |
0.51±0.12 |
|
Friability(%) |
0.15% |
|
Disintegration time (Hr) |
6 |
6.6.1. Cumulative % drug release of Oral dispersible tablet.
The release rate of Vinpocetine loaded microspheres tablet was determined using USP dissolution testing apparatus type II (paddle type). The dissolution test was performed using 900ml of pH 6.8 Phosphate buffer, at 37± 0.5 °C at 50 rpm. Aliquot volume of the solution was withdrawn from the dissolution apparatus predetermined intervals (1hr) and the samples were replaced with fresh dissolution medium to avoid sink condition. Absorbances of these solutions were measured at 269 nm. Cumulative % Drug release was calculated using an equation obtained from a standard curve. % Drug release mention in Table No 20.
Table No.13. Cumulative % Drug release of F4 batch
|
Time (Hr) |
% Drug Release |
|
1 |
55.59 |
|
2 |
56.59 |
|
3 |
57.35 |
|
4 |
54.70 |
|
5 |
57.35 |
|
6 |
60.38 |
|
7 |
67.57 |
|
8 |
81.96 |
|
9 |
83.09 |
|
10 |
84.99 |
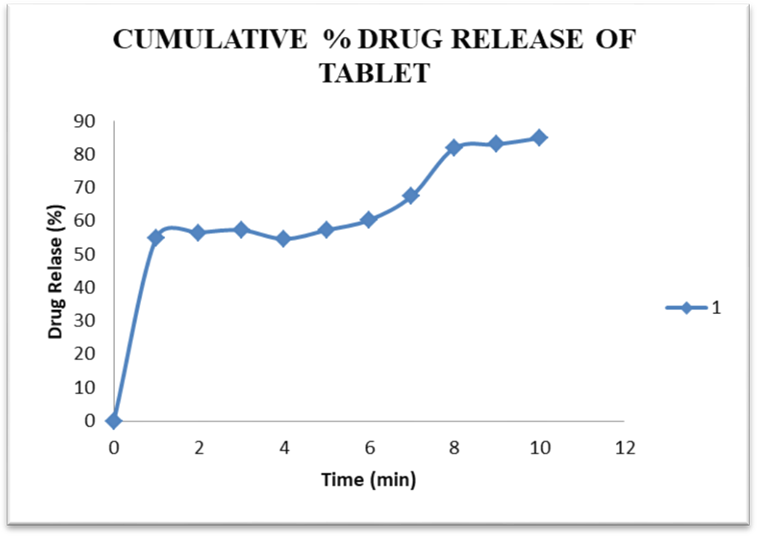
Figure No. 6. % Cumulative Drug Release of F4 batch:
batch were optimized on the basic on result of evaluation parameter such as in vitro percent drug release is 84.99 % in 10( Hr) as shown in table no
6.7. Accelerated Stability Studies:
Stability studies are one of the most vital and precious part for the improving of the life Pharmaceutical Dosage form. They allow the evaluation of active pharmaceutical ingredient (API) Drug Product stability Studies is finding out of the main acceptable preparation as per international conference of harmonization guideline at 40±2°C/75± 5% RH (relative humidity) for 30 days. The tablet of optimized batch was tested by wrapping them in aluminium foil. These tablets were kept in stability chamber and then were analysed for 30 days. the physical characterization, visual defects, hardness, thickness, friability, dissolution tests disintegration time.
There was no change in the percentage release of Vinpocetine from the optimized batch formulations stored at 40±2°C/75± 5% up to 30 days. It showed that all the formulation are physically stable. There was no change in the formulation the result.
REFERENCES


Abhay Dhakare*, Dr. A. V. Chandewar, Dr. Shilpa Gawande, Anisha Kohale, Development And Evaluation of Sustained Release Formulation by Spray Drying Technique, Int. J. of Pharm. Sci., 2025, Vol 3, Issue 5, 1506-1521. https://doi.org/10.5281/zenodo.15380205
 10.5281/zenodo.15380205
