Spectroscopy focuses on examining the interaction occurring between electromagnetic radiation and matter, where the radiation’s wavelength operates as a function. Its advancement has paved the way for analyzing the interaction occurring in different particles through dependence on collision energy. A particular beam of electromagnetic radiation is made to interact with a given sample. The electrons absorb the electromagnetic radiation, and they get excited. They move to the excited state from the ground state and further get de-excited when they return to their ground state by emitting light radiations. Spectroscopy provides information about the structural aspect of atoms or molecules. It discovers the composition and quantity of a given sample, which is possible due to the distant reflection depicted by each atom or molecule. A graph of the intensity of absorbed/emitted light versus frequency or wavelength is plotted to obtain the spectrum, and then this spectrum is measured by the spectrometer.
UV, ultraviolet, Spectroscopy, transition, molecules
The wavelength range of uv radiation starts at the blue end of the visible light (4000A) ends at 2000A the ultraviolet region is subdivided into two spectral regions1.
Origin and theory of ultraviolet spectra Ultra violet absorption spectra arise from transition of electron or electronic within a molecule or an ion from lower to a higher electronic energy level and the ultraviolet emission spectra arise from the reverse type of transition for radiation to cause electronic to cause electronic excitation it must be in the uv region of the electromagnetic spectrum. When a molecule absorbs uv radiation of frequency vsec the electron in that molecule undergoes transition for radiation to cause electronic excitation2.
E=hverg
E1_E0=hv

Fig.1. Energy level of a diatomic molecule
We know that the total energy of a molecule is equal to the sum of electronic vibrational and rotational energy the magnitude of these energies decreased in the following order.
- ? _ electron:
These electrons are involved in saturated bonds such as those between carbons and hydrogen in paraffins these bonds are known as sigma bonds more than the product by uv light compound containing sigma bonds did not absorb uv radiation for this reason parraglffin compound the frequency.
- ? electrons:
These electrons are involved in unsaturated hydrocarbons typically compound qwith ?bonds are triness and aromatic compound.
- ????_ electrons:
These are the electrons which are not in involved2.
Types of transition of inorganic molecule
When molecule are electrically excited the electron go from a bonding to o an antibonding orbital electron in a sigma bonds are excited to either sigma orbitals and n electrons are excited to either sigma antibonding orbitals or ?antibonding orbitals. A change in colour or the uv absorption spectrum is observed denoting the presence of the metal of interest change in colour or the uv absorption spectrum is observed denoting the presence of the metal present3.
Types of transition in organic molecules
Energy absorbed in the uv region by complex organic molecules causes transition of valence electrons in the molecule
???????<???*
- ?????? transaction:
These types of transaction are shown by unsaturated molecules which contain atoms such as oxygen, nitrogen and sulphur. These transition exhibit a weak band in their absorption spectrum. In aldehydes and ketones the band due to the n?? transition generally occurs in the range 2700-3000 A (270-300nm). On the other hand, carbonyl compounds having double bonds separated by 2 or more Sigma bonds exhibit the bands due to the n?? Transitions in the range 3000 to 3500A.
- One method to characterise ?????? Transitions:
is to observe the spectrum in acid solution. The reason for this is that a bond is formed between the acidic proton and the lone pair electrons on the heteroatom an interesting example is that the banned due to ?????? Transition in pyridine disappears in acidic solutionC505N.+H?C5H5N+-H due to the following reaction4.
I. Another method to assign n?? transitions: may be assigned by comparison of the spectrum of the compound containing heteroatom with a similar compound not containing the heteroatom.
a. High energy transitions
- n??* (intense)
- ???? (intense)
- Low energy transition, n???
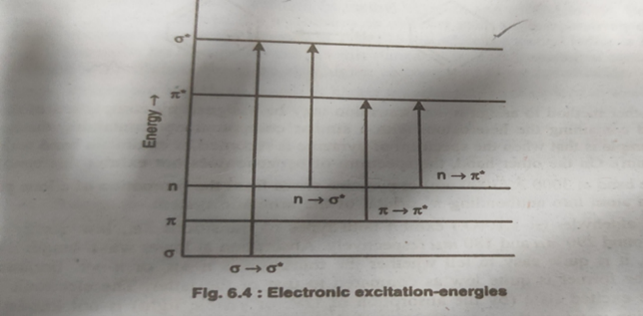
- ???* Transition:
These transitions can occur in such compounds in which all the electrons are involved in Sigma bonds and there are no lone pairs of electrons. Examples involving such transitions are saturated hydrocarbons.
- ??????* Transitions:
Saturated compounds with lone pair electrons undergo ??????*Transition in addition to ???* Transition.The energy required for and transition is generally less than that required for a transition and the corresponding absorption bands appear at longer wavelength in the near ultraviolet( 182- 200 nm) region5.
- ???? transition. A ???? Transition
Corresponding to the promotion of an electron from a bonding ? orbital to an ?? orbital

Fig.2.Electronic excitation-energies
Transition probability
-
- Allowed transitions:
These are transitions having Emax 10?or more. These generally due to ???? transition. For example ???? transition in 1,3-butadiene which exhibit absorption at 217 nm and has ?max 21000 represents an allowed transition.
-
- Forbidden transitions:
These are transitions for which ?max is generally less than these usually occur due to ??????? transition. For example, ??????? transition of a saturated aldehyde or ketone showing weak absorption near 290 nm and having less than 100 has been a forbidden transition6.
Chromophore and Related terms
- Chromophore:
The term chromophore was previously used to denote a functional group or sum other structural feature the presence of which gives a colour to a compound. But these days the term chromophore is used In a much broad sense which may be defined has any group which exhibits absorption of electromagnetic radiations in the visible or ultraviolet radiation. It may or may not impart any colour to the compound7.
-
- Chromophore In which the group is having ? electrons undergo ????transition. Examples of having such Chromophore are ethylene acetylenes.
- Chromophores having both ? electrons and ???? electrons undergo 2 types of transitions, that is ???? and ???????.examples of the type include carbonyls, nitriles, azo compounds, nitro compounds etc.
- Changes in position and intensity of absorption:
For isolated chromophore groups such as >c=c< and>
-
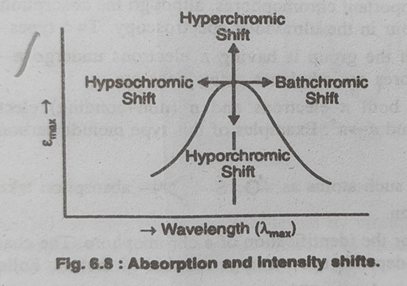
- Bathochromic shift or red shift: It involves the shift of absorption maximum towards longer wavelength because of the presence of certain groups such as OH&NH2 called Oxochromes Or by change of solvent.
Bathochromic shift is also produced when 2 or more chromophores are present in conjugation in a molecule8.
-
- Hypsochromic shift or blue shirt: It involves the shift of absorption maximum towards shorter wavelength and may be caused by removal of conjugation in a system or by change of solvent. the absorption shift towards shorter wavelength is also called blue shift.
- Auxochrome:
- It is a group which itself does not act as a chromophore but when attached to a chromophore it shifts the absorption maximum towards longer wavelength along with an increase in the intensity of absorption.

Fig.3.Absorption and intensity shifts
SOLVENT EVENTS
A most suitable solvent is one that does not itself absorb in the region under investigation. A dilute solution of the sample is always prepared for spectral analysis. most commonly used solvent is 95% ethanol.
-
- ??????? transition.
For such a case the observation band moves to shorter wavelength by increasing the Woodward e polarity of the solvent. for example, absorption maximum of acetone is at 279 mµ In hexane as compared to 264mµ in water.
-
- ???? transitions.
In such a case, the absorption band moves to longer wavelength by increasing the polarity of the solvent.
Instrumentation
- Radiation source:
In ultraviolet spectrum does the most commonly used radiation sources are hydrogen or deuterium lamps, xenon discharge Lamps and mercury arcs. In all sources , excitation is done bypassing electrons through a gas and their collisions between electrons and gas molecules America result in electronic, vibrational and rotational excitation in the gas molecules. The followings are requirements of a radiation source:
- It must be stable
- It must be of sufficient intensity for the transmitted energy to be detected at the end of the optical path9
- It must supply continuous radiation over the entire wavelength region in which it is used
-
- Tungsten lamp:
The 2 most common radiation sources are tungsten lamps and hydrogen discharge lamps. The tungsten lamp is similar in its functioning to an electric light bulb.
-
-
- Hydrogen discharge lamps:
In the lamps, hydrogen gas is stored under relatively high pressure. When an electric discharge is passed through the lamp excited hydrogen molecules will be produced which emit UV radiations.
-
-
- Deuterium lamps:
If deuterium is used in place of hydrogen,the intensity of radiation emitted is 3 to 5 times the intensity of a hydrogen lamp of comparable design and wattage
-
-
- Xenon discharge lamps:
In this lamps,xenon gas is stored under pressure in the range of 10 to 30 atmospheres. The xenon lamp possesses 2 tungsten electrodes separated by about 8 mm.
-
-
- Mercury arc:
In this ,The mercury vapour is under high pressure, and the excitation of mercury atoms is done by electric discharge.
- Monochromators:
The monochromator is used to disperse the radiation according to the wavelength. The essential elements of a monochromator are an entrance slit, a dispersing element and an exits slit. The entrance slit sharply defines the incoming beam of heterochromatic radiation.
Glass has the highest resolving power but it is not transparent to radiations having the wavelength between 2000 and 3000A Because glass absorbs strongly in this region.
- Detectors:
There are 3 common types of detectors which are widely used in UV spectrophotometers these are as follows10 .
-
- Barrier layer cell:
This cell is also known as photovoltaic cell. A typical barrier cell is shown in below. The barrier cell consists of a semiconductor such as selenium which is deposited on a strong metal base such as iron. then a very thin layer of silver or gold is spotted over the surface of the semiconductor to act as a second collector electrode.
-
- Photocell:
It consists of a high sensitive cathode in the form of a half cylinder of metal which is contained in an evacuated tube. The anode is also present in the tube which is fixed more or less along the axis of the tube.
-
- Photomultiplier tube:
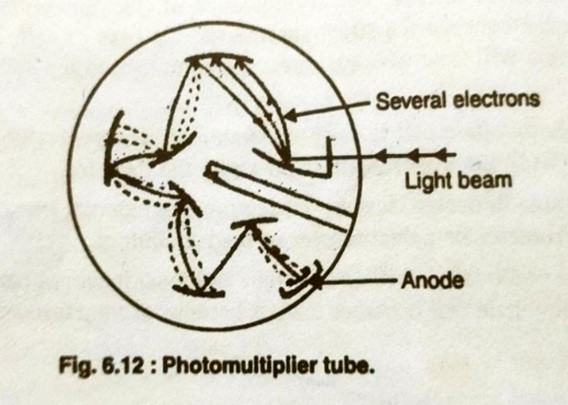
photo multiplier tube is generally used as a detector In UV spectrometers. a typical photo multiplier is shown in below

Fig.4.Photomultiplier tube
-
Recording system:
The signal from the photo multiplier tube is finally received by the recording system. the recording is done by recorder pan. The type of arrangement is only done in recording UV spectrophotometers.
- Sample cells:
The cells that are to contain samples for analysis should fulfill 3 main conditions11.
-
- They must be uniform in construction the thickness must be constant and surfaces facing the incident light must be optically flat.
- The material of construction should be insert to solvents.
- They must transmit light of the wavelength use
-
- Single beam system:
In the single beam system UV radiation is given off by the source. A convex lens gathers the beam of radiation and focuses it on the inlet slit. the inlet slit permits light from the source to pass, but blocks out stray radiation.
b. Double beam system:
-
-
- The radiation from the source is allowed to pass via mirror system to the monochromator unit. the function of the monochromator is to allow a narrow range of wavelength to pass through an exit slit.
- The radiation coming out of the monochromator through the exit slit is received by the rotating sector which divides the beam into 2 beams one passing through the reference and other through the sample cell.
- After passing through the sample under reference cells the light beams are focused on to the detector12.
- The output of the detector is connected to a phase sensitive amplifier which responds to any change in transmission through sample and reference.
- The face sensitive amplifier transmits the signals to the recorder which is followed by the movement of the pen on chart. the chart drive is coupled to the rotation of the Prism and thus the obsorbance are transmittance of the sample is recorded as a function of wavelength.
Applications of spectroscopy to organic compounds
-
-
- Spectrophotometric titration:
It is the process of determining the quantity of a sample by adding measured increments of a titrant until the end point13.
-
-
-
- The Endpoint is where the graph is discontinuous.
- The titration are based on beers law
- Titration curve is plot of absorbance Vs volume of titrant
- Single component analysis:
If the sample consists of only drug that absorb radiation at ?max of drug.
Methods use – standard absorptivity value, by using A=abc ,by using beers curve.
-
-
- Multi component analysis:
if same sample has more than one drug and all of them absorb at same wavelength then this analysis is required.

Fig.5. Applications on Spectroscopy


 D. Chandana* 1
 Swarna Kumari Donakanti 2
 Vinutha Dasaram 3


 10.5281/zenodo.11548466