Department of Pharmaceutical Chemistry & QA, School of Pharmacy, Rai University, Saroda, Dholka, Ahmedabad, Gujarat - 382260, India
This research compiles information on the development of analytical methods for estimating Dapagliflozin, which will be valuable for future research on this drug and its impurities. The literature survey covers various analytical methods such as UV, RP-HPLC, HPTLC, and other techniques reported for Dapagliflozin, both alone and in combination with other drugs. The analysis of published data indicates that only a UV spectroscopic method (calibration curve method) has been reported for estimating Dapagliflozin in fixed-dose combination. Each technique is evaluated for its sensitivity, specificity, and applicability in different matrices, including pharmaceutical formulations and biological fluids. The research also discusses the advantages, challenges, and recent advancements in these methods, providing a detailed comparison to guide researchers and practitioners in selecting the most appropriate technique for their specific needs.
1.1 Introduction of Diabetes Mellitus
Diabetes mellitus is a metabolic disorder characterize by hyperglycemia where the patient experiences polyuria (frequent urination), polydipsia (extreme thirst), and polyphagia (constant hunger). Physicians have been documenting the signs and symptoms of diabetes for thousands of years.
The role of the pancreas in diabetes was discovered by the experiments of Oskar Minkowski who, in 1889, noted that when the pancreas was removed from a dog, the animal developed all signs and symptoms of diabetes. Small clusters of ductless cells on the pancreas were identified in 1869 by Paul Langerhans, and in 1902 the work of Eugene Opie clearly linked these ductless cells, which by then were called the islets of Langerhans, to diabetes. Although hypothetical secretion of the islet cells was postulated and called insulin (from insula, or island), it took work of Frederick Banting, Charles Best, and John Macloud to isolate insulin and use it as diabetes medication. insulin was identified as a protein by Frederick sangar and Hans Tuppy, who defined its amino acid sequence in 1951. The incidence of diabetes is growing rapidly worldwide. Approximately 30 million individuals in the United States and 422 million people globally are impacted by diabetes. In India, more than 62 million individuals are reported O1 be diabetic and it is predicted to reach 79.4 million U 2030. Diabetes is not a single disease, but rather a diverse group of syndromes characterized by high blood sugar levels, which can be caused by either a lack of insulin or a reduced ability to use insulin effectively. (02)
1.1.1 Classification of Diabetes
Table 1.1 classification of diabetes (03)
|
Types of diabetes |
|
Type 1 Diabetes |
•Effects children •Caused due to deficiency of insulin •Genetic variations & auto-immune response are leading cause |
|
Type 2 Diabetes |
•Effects adults •Caused due to insulin resistance by body •Obesity, inactive lifestyle, hereditary are leading cause |
|
Gestational Diabetes |
•Occurs during pregnancy •Excessive weight gain, genetic history of diabetes |
|
MODY (maturity-onset diabetes of youth) |
•Very rare •Caused in adults below 25 years of age •Caused due to genetic variation |
1.1.3 Antidiabetic Drugs (01)
These drugs lower blood glucose levels in diabetics and are effective orally. The chief drawback of injection. Orally insulin is-it must be given active drugs have always been caught.
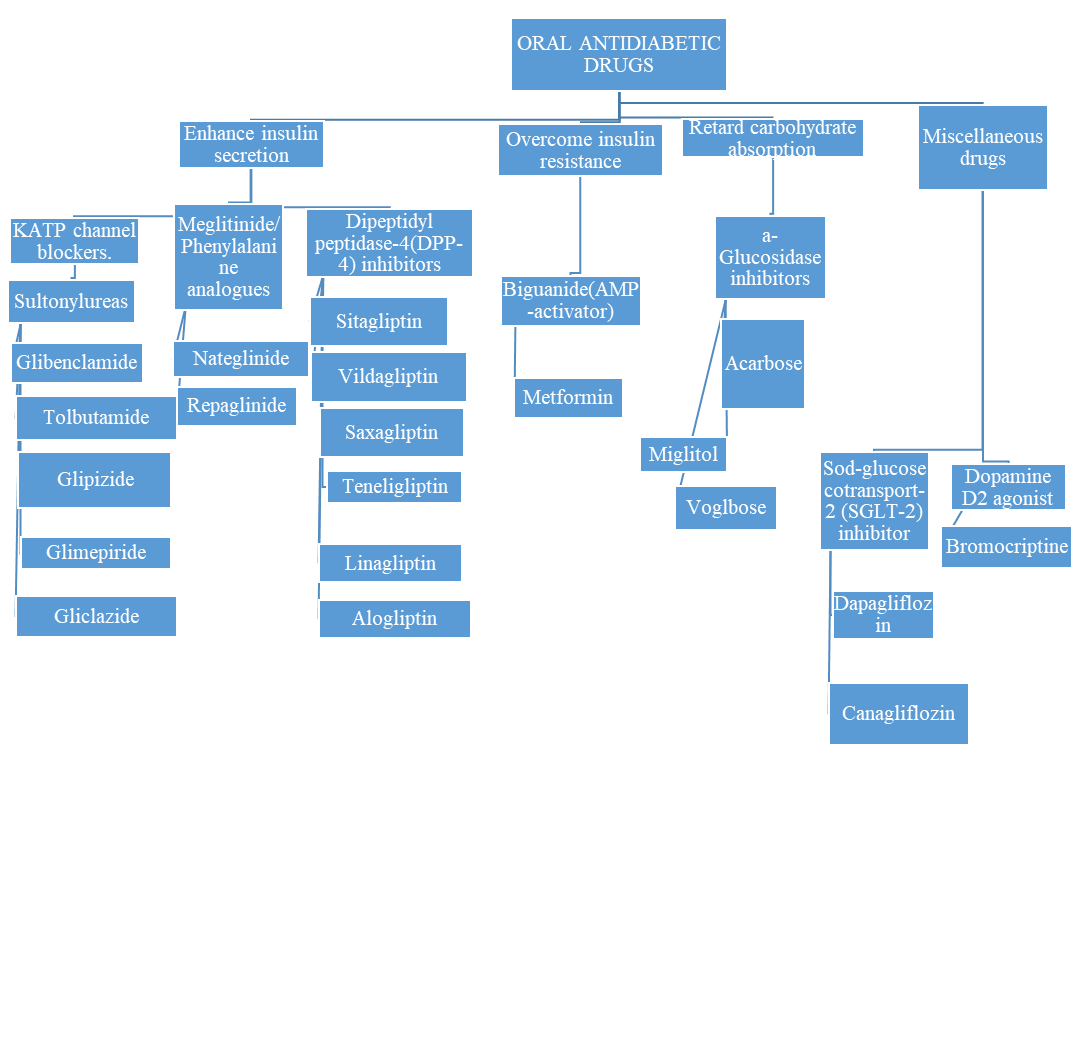
Figure 1.1 flow-chart of oral Antidiabetic drug
1.2 Introduction of Dapagliflozin (02)
Dapagliflozin approved FDA in 2014. It binds well to plasma proteins (91%) and has an 80% bioavailability with a Tmax of 1-2 hours. The plasma half-life of this substance is approximately 12. 9 hours, and it has a volume of distribution of 118 liters. Dapagliflozin is extensively metabolized, with 73.7% recovered in excrete (72.0% in urine and 1.65% in feces). Metabolic routes included glucuronidation (UGT1A9), DE alkylation, and oxidation at various positions to produce demethyldapaglifolzin glucuronides. The major metabolite is 3-O-glucuronide (60.7%) which is eliminated via the kidney. The 2-O-glucuronide was only other urinary metabolite. Similar to canagliflozin, dapagliflozin is also available in fixed combination tablets with metformin hydrochloride. In 2017, the FDA approved a fixed combination of dapagliflozin with saxaglitin.
This is a type of sodium glucose cotransporter 2(SGLT2).

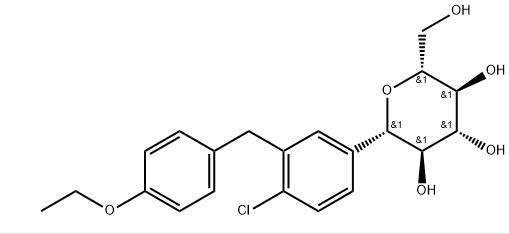
Figure 1.2 Dapagliflozin structure.
1.2.1 Mechanism of action (03)
The sodium-glucose cotransporter 2 (Sglt2) is Answerable for Resorbing filtered glucose within the tubular lumen of the kidney. By blocking sglt2, these agents reduce the reabsorption of glucose, enhance the excretion of glucose in urine, and lower blood glucose levels. The inhibition of Sglt2 also leads to a decrease in sodium reabsorption and results in osmotic diuresis, which can potentially lower systolic blood pressure. However, they are not recommended for the treatment of high blood pressure. The monotherapy role of the SGLT2 inhibitors for patients who cannot tolerate met-forming SGLT2 inhibitors are also effective as an add-on to any of the other oral hypoglycemic and insulin. When administered once daily, they are well tolerated and do not have any relevant drug-drug interactions. They have a unique mechanism of action since they are insulin independent, which not only promotes reduction in plasma glucose but also contributes to weight loss, an improvement in blood pressure, and a low risk of hypoglycemia. This makes them good choice as an add-on medication for treating obese and/or hypertensive type 2 diabetics. Since the SGLT2 drugs are relatively new to the clinical arena, the data on long-term safety are lacking. Therefore, as their use increases, post market surveillance will increase our knowledge in this area.
1.3 Introduction to analytical method (6-7)
Development and validation of analytical procedures plays an important role in pharmaceutical product development, discovery, and manufacturing. Method development is a process of proving that an analytical method is acceptable for use to measure concentration of API in a specific compounded dosage form. The numbers of the drugs introduced into the market is increased every year. These drugs may be either new moiety or structural modification of the existing one, so there is possibility that analytical procedures for the new drugs may not be available in the pharmacopoeias. So, it is necessary to develop newer analytical methods for such drugs. Quality control laboratories use the official test methods to perform identity, purity, potency and performance tests for drug products. To Analyze the analyte there are several methods such UV Spectrophotometric, High Performance liquid chromatography, High performance thin layer chromatography, Ultra performance liquid chromatography, Stability indicating High Performance liquid chromatography, LC-MS/MS, spectrofluorimetric, GC/MS, etc. (7)
1.3.1 Introduction of UV Spectroscopy
Spectroscopy is the measurement and interpretation of the electromagnetic radiation absorbed or emitted when molecules or atoms or ions of a sample transitions from one energy state to another energy state. UV spectroscopy is a type of absorption spectroscopy in which light of the ultra-violet region (200-400 nm) is absorbed by the molecule which results in the excitation of the electrons from the ground state to a higher energy state.

Figure 1.2 Dapagliflozin structure.
Principle of UV Spectrophotometer
? When matter absorbs light, it ends up with a higher energy state, either at the atomic or molecular level.
? Ultraviolet radiations absorption leads to the excitation of the electrons from the ground state to a higher energy state.
? Molecules that possess π-electrons or nonbonding electrons (n-electrons) are able to absorb energy in the form of ultraviolet light to excite these electrons into higher anti-bonding molecular orbitals.
? Electrons that can be excited more easily can also absorb longer wavelengths of light. 3. There are four allowable transition types (π–π, n–π, σ–σ, and n–σ), which can be arranged in energy ordering of σ–σ* > n–σ* > π–π* > n–π* (6)
1.3.1.2 Instrumentation of UV Spectrophotometer
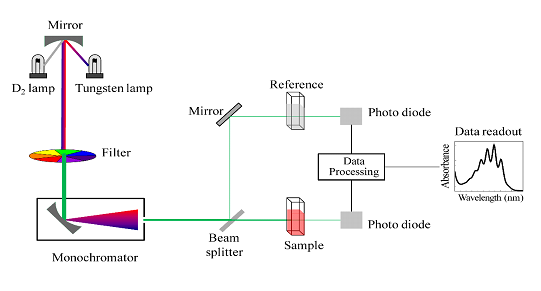
Figure 1.5 Instrumentation of UV Spectrophotometer
1.4 Drug Profile for DAPAGLIFLOZIN
Table 1.2 Drug profile of Dapagliflozin
|
Introduction |
|
Name |
Dapagliflozin |
|
Official In |
Dapagliflozin is official in Indian pharmacopeia (IP) |
|
Description |
It is a Na-glucose co-transporter to inhibit used in the management of Type-2 diabetes |
|
Structure |
|
|
Chemical formula |
C21 H25 CLO6 |
|
Molecular weight |
408.87 |
|
Category |
Antidiabetic drug |
|
Solubility |
Soluble in organic solvent such as ethanol, DMSO & dimethyl formamide &sparingly soluble in Aqueous buffers. |
|
CDSCO approved date |
25-02-2015 |
|
IUPAC Name |
(2S)-propane-1,2-diol(2S,3R,4R,5S,6R)-2{4-chloro-3-[(4-ethoxyphenyl) methyl] phenyl}-6-(hydroxymethyl) oxane-3,4,5-trio hydrate |
|
PROPERTIES |
|
State |
Solid |
|
CAS NO. |
960404-48-2 |
|
Melting point |
74-78o C |
|
Log P |
2.11 |
|
Bioavailability |
78 H (after long dose) |
|
pKa |
12.57 |
2. LITERATURE REVIEW
2.1 Reported method of DAPAGLIFLOZIN
Table 2.1 Literature review of DAPAGLIFLOZIN
|
Sr.No |
Drugs |
Official in |
Analytical method |
Description |
Ref. No |
|
1 |
Dapagliflozin |
IP |
HPLC |
ColumnC18 (15cm*4.6mm*5.4m) Mobile phase = potassium Dihydrogen orthophosphate: Acetonitrile (60:40) Flow Rate = 1.4ml/min Wavelength = 225 nm |
(9) |
Table 2.2 Literature review of DAPAGLIFLOZIN
|
Sr.No |
Drugs |
Analytical method |
Description |
Ref. No. |
|
1 |
Dapagliflozin |
UV spectroscopy 1. zero order 2. first order 3. second order |
Solvent = Methanol Wavelength = Zero order = 224 nm 1st order = 220 nm 2nd order = 235.5 nm |
(10) |
|
2 |
Dapagliflozin
|
UV-spectroscopy |
Solvent – Methanol Wavelength =225 nm |
(11) |
|
3 |
Dapagliflozin metformin HCl |
UV-spectroscopy |
Solvent – Methanol (1) Wavelength =235 nm (2) Wavelength =272 nm |
(12) |
|
4 |
Dapagliflozin saxagliptin |
UV-spectroscopy |
Solvent – phosphate buffer (6.8) v/v Wavelength d =222 nm Wavelength s= 276 nm |
(13) |
|
5 |
Dapagliflozin Saxagliptin metformin HCL |
UV-spectroscopy |
Solvent = water Wavelength =223 nm Wavelength = 212 nm Wavelength = 232.6 nm |
(14) |
|
6 |
Dapagliflozin
|
RP-HPLC |
Mobile phase-Acetonitrile: water (65:35) v/v Wavelength = 225 nm ColumnC18(4.6*100mm) Flow Rate = 1ml/min |
(15) |
|
7 |
Dapagliflozin metformin |
RP-HPLC |
Mobile phase: -Phosphate Buffer: Acetone Nitrile (45:55) v/v Flow Rate =1ml/min |
(16) |
|
8 |
Dapagliflozin linagliptin |
HPTLC |
Solvent: - Chloroform;methanol;Trie-thylamine (7:2:1:0.2) v/v D(Rp) = 0.23 L(Rf) = 0.40 |
(17) |
|
9 |
Dapagliflozin metformin
|
UV-spectroscopy |
Solvent = methanol Wavelength = 275 nm Wavelength = 245 nm |
(18) |
|
10 |
Dapagliflozin sitaglipstin |
UV-Visible |
Solvent = methanol Wavelength =224 nm Wavelength = 263 nm |
(19) |
|
11 |
Dapagliflozin vildagliptin |
RP-HPLC |
Solvent= Methanol:Water (95:05) v/v Wavelength = 210 nm Flow Rate = 0.8 ml/min |
(20) |
|
12 |
Dapagliflozin
|
RP-HPLC |
Solvent =Acetone Nitrile:Water (52:48) v/v Flow Rate = 1ml/min UV Detector: - 224 nm |
(21) |
|
13 |
Dapagliflozin
|
RP-HPLC |
Solvent = Methanol: Phosphate buffer (45:58) v/v Wavelength = 255 nm Flow rate = 1 ml/Min |
(22) |
|
14 |
Dapagliflozin Teneligliptin |
UV-spectroscopy =
|
Solvent-Distilled water (1) Wavelength D =223 nm WavelengthT =243 nm (2)WavelengthD =223 nm WavelengthT =230 nm (3)WavelengthD =237 nm WavelengthT =254 nm |
(23) |
|
15 |
Dapagliflozin Saxagliptin metformin |
UV-spectroscopy= Visible |
Solvent-Methanol: Water (80:20) v/v (1) Wavelength d =272 nm (2) Wavelength s =212 nm (3) Wavelength m=232 nm |
(24) |
|
16 |
Dapagliflozin Vildagliptin |
UV-spectroscopy=
|
(1)WavelengthD =223 nm WavelengthV =210 nm
(2)WavelengthD =223 nm WavelengthV =219.2 nm
(3)WavelengthD =290.6 nm WavelengthV =219.2 nm
(4)WavelengthD =236&242 nm WavelengthV=208.4&215 nm
(5)WavelengthD =226 nm WavelengthV =215.6 nm |
(25) |
3. RESULT & DISCUSSION
3.1 SOLUBILITY OF DAPAGLIFLOZIN(26)
Table 3.1 Solubility of Dapagliflozin
|
Sr..No |
Solvent |
Solubility |
|
1 |
Water |
Slightly Soluble |
|
2 |
Ethanol |
Soluble |
|
3 |
Organic solvent (DMSO) |
Freely Soluble |
|
4 |
HCl |
soluble |
3.2 INTERPRETATION OF IR SPECTRA(27)
Table 3.2 Interpretation of IR Spectra
|
FIGURE |
STD. Frequency |
Sample Frequency |
|
C=C (aromatic) |
1600 – 1475 cm-1 |
1600 cm-1 |
|
C-O |
1300 – 1000 cm-1 |
1050 cm-1 |
|
O-H |
3400 – 3200 cm-1 |
3300 cm-1 |
|
C-H |
3000 – 2850 cm-1 |
2900 cm-1 |
|
C-O-H |
1300 – 1000 cm-1 |
1250 cm-1 |
|
C-Cl |
785 – 540 cm-1 |
750 cm-1 |
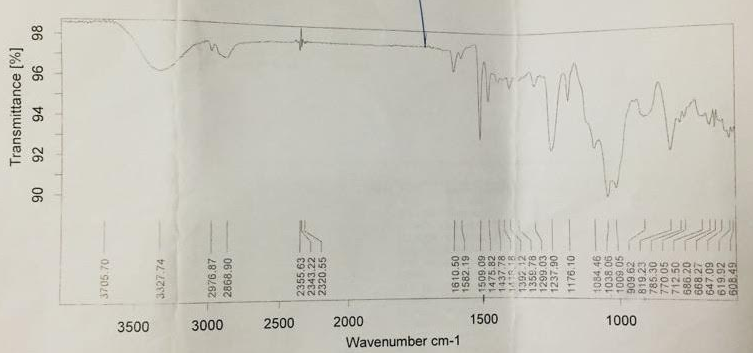
Figure 3.1 IR Spectra of dapagliflozin

Figure 3.2 Chemical Structure of Dapagliflozin
3.3 MELTING POINT(28)
Table 3.3 Melting Point
|
DRUG |
STD. |
SAMPLE |
|
Dapagliflozin |
74-78°c |
76-78°c |
3.4 UV SPECTROSCOPY METHOD
A standard UV solution was analyzed within the range of 200 to 400 nm, showing an absorption peak at 222 nm. The absorption spectrum for Dapagliflozin is presented in Figure 3.3.
3.4.1 preparation of sample solution
Twenty tablets were carefully weighed and ground using a mortar and pestle. An amount corresponding to 20 mg of Dapagliflozin was measured and dissolved in a 100 ml volumetric flask containing 0.1N HCl. The solution was subjected to sonication for a duration of 15 minutes, resulting in a concentration of 200 µg/mL
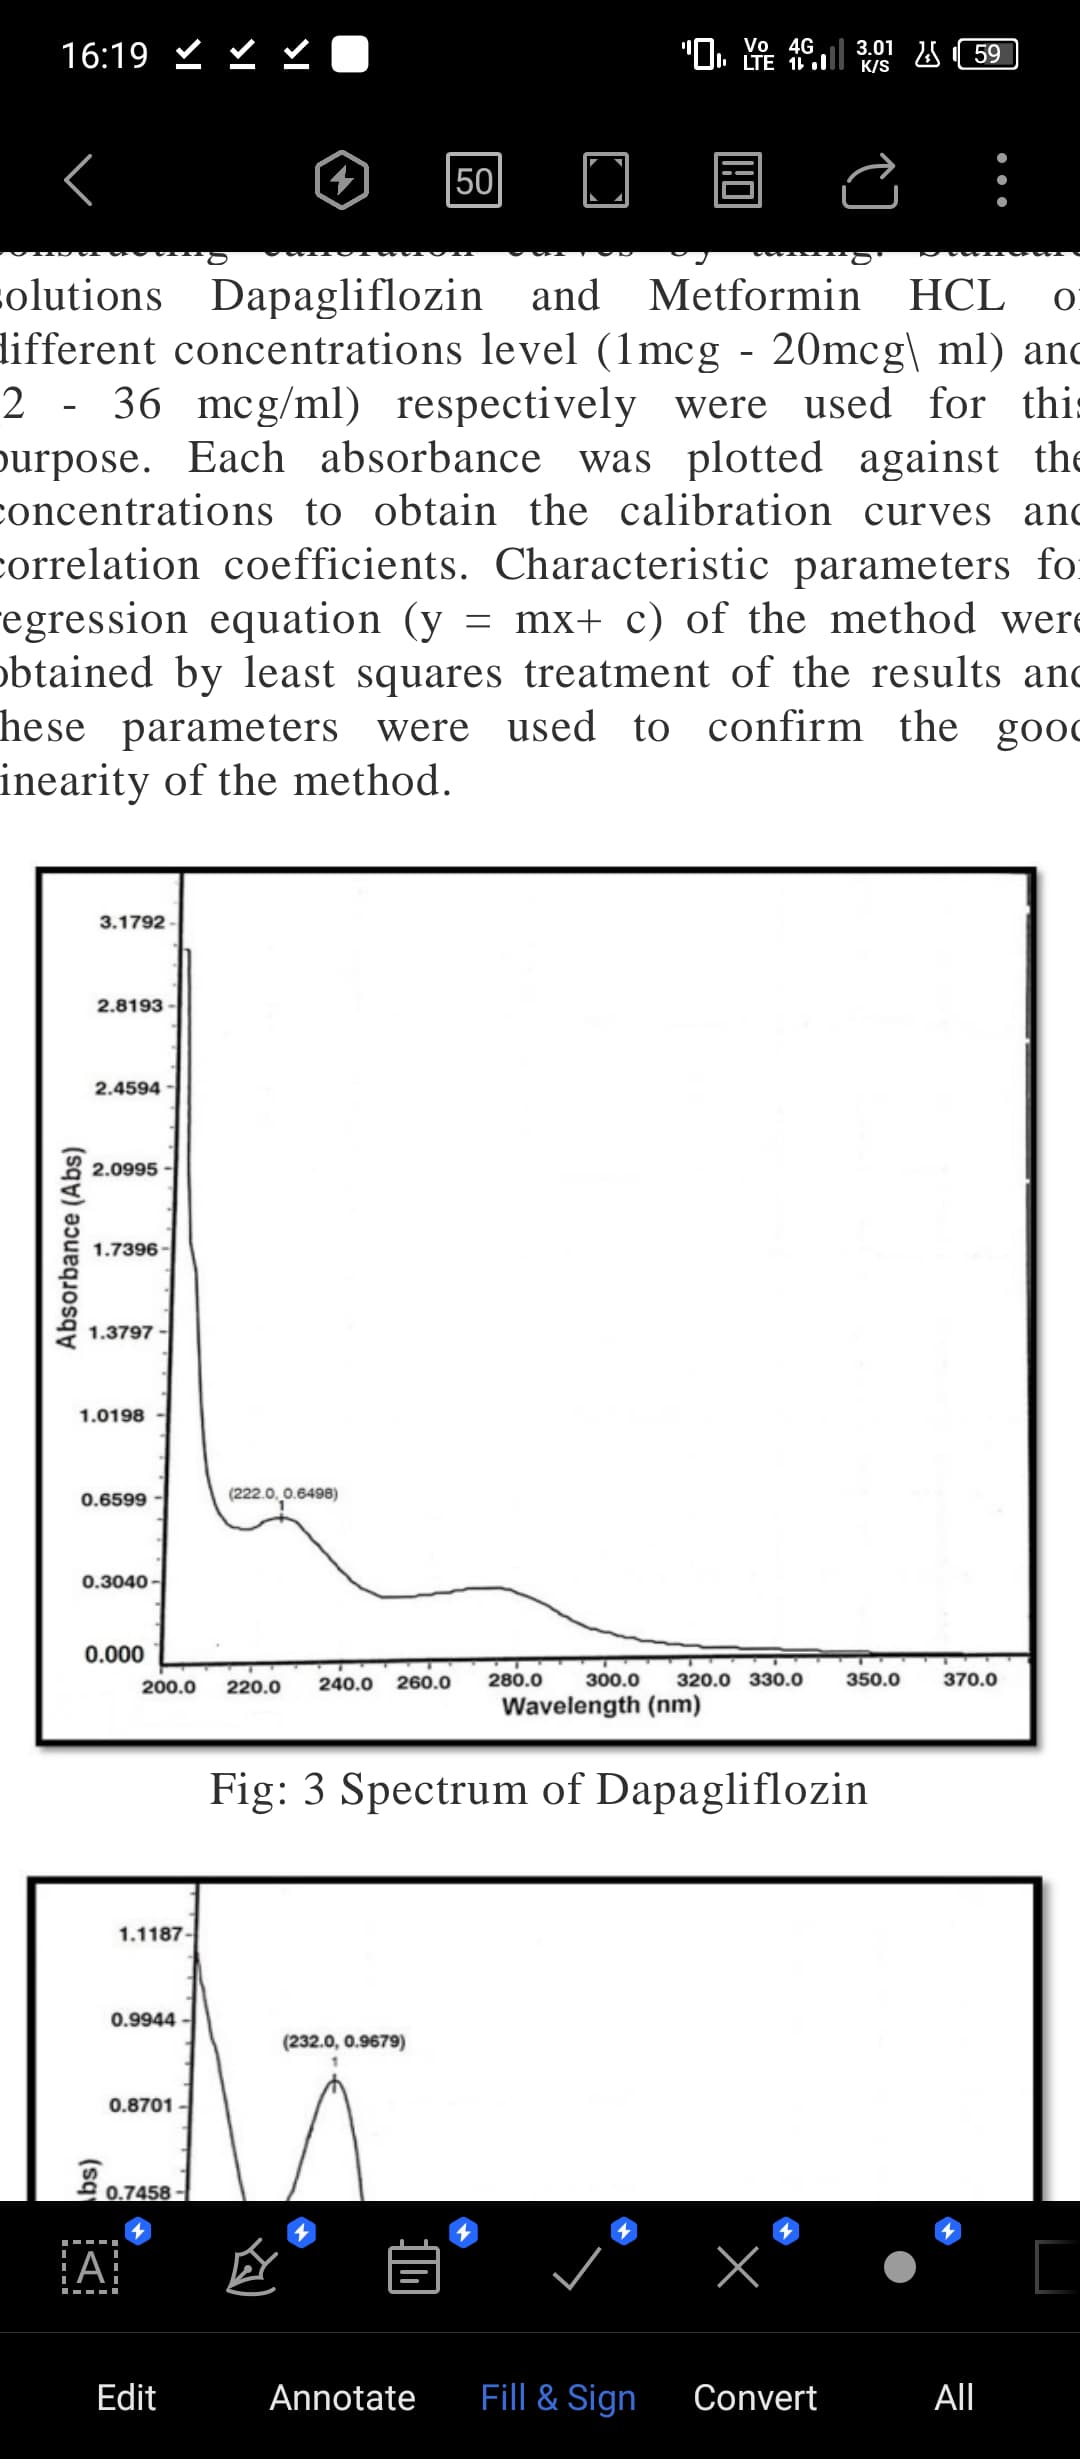
Figure 3.3 UV Chromatogram of Dapagliflozin
3.5 METHOD OF VALIDATION FOR UV (8)
Table 3.4 Linearity of Dapagliflozin
|
SR.NO |
Concn (µg/ml) |
Absorbance 1 |
Absorbance 2 |
Absorbance 3 |
SD |
|
1 |
5 |
0.02 |
0.024 |
0.022 |
0.002 |
|
2 |
10 |
0.058 |
0.054 |
0.056 |
0.002 |
|
3 |
15 |
0.1 |
0.099 |
0.097 |
0.001528 |
|
4 |
20 |
0.146 |
0.143 |
0.149 |
0.003 |
|
5 |
25 |
0.187 |
0.185 |
0.189 |
0.002 |
|
6 |
30 |
0.22 |
0.23 |
0.2 |
0.015275 |
|
|
|
|
|
Avg |
0.0043 |
Precision:
Precision in an analytical procedure refers to how consistently similar results are obtained when the same sample is measured multiple times under the same conditions. It reflects the reproducibility of measurements taken from repeated sampling of the same material using a specific method.
Table 3.5 Intraday study results
|
Concentration: (µg/ml) |
Absorbance |
Standard Deviation |
|
5 |
0.025 |
0.00057 |
|
0.024 |
||
|
0.025 |
||
|
Mean |
0.024666667 |
|
|
15 |
0.101 |
0.00100 |
|
0.1 |
||
|
0.099 |
||
|
Mean |
0.1 |
|
|
25 |
0.185 |
0.00044 |
|
0.186 |
||
|
0.185 |
||
|
Mean |
0.185333333 |
Table 3.6 Interday study results
|
Concentration: (µg/ml) |
Absorbance |
Standard Deviation |
|
5 |
0.025 |
0.00057 |
|
0.024 |
||
|
0.025 |
||
|
Mean |
0.024666667 |
|
|
15 |
0.101 |
0.00100 |
|
0.1 |
||
|
0.099 |
||
|
Mean |
0.1 |
|
|
25 |
0.185 |
0.00044 |
|
0.186 |
||
|
0.185 |
||
|
Mean |
0.185333333 |
Table 3.7 Repeatability study results
|
Concentration : (µg/ml) |
Absorbance |
Standard Deviation |
|
15 |
0.102 |
0.001048809 |
|
0.099 |
||
|
0.1 |
||
|
0.101 |
||
|
0.1 |
||
|
0.101 |
||
|
Mean |
0.1005 |
Table 3.8 Linearity Range of Dapagliflozin
|
Parameters |
DAPAGLIFLOZIN by UV (Sample) (µg/ml) |
|
Linearity Range (µg/ml) |
5 – 30 |
Table 3.9 LOD & LOQ of Dapagliflozin
|
Parameters |
sample |
|
LOD |
1.7304µg/ml |
|
LOQ |
5.2439µg/ml |
LOD = 3.3σS

LOD = 3.3*0.0043/0.0082=1.7304µg/ml
LOQ = 10σS

LOQ = 10* 0.0043/0.0082=5.2439µg/ml
3.6 Summary of validation parameter
|
Sr. no |
Parameter |
Dapagliflozin |
|
1 |
Linearity (µg/ml) |
0.0043 (µg/ml) |
|
2 |
Regression equation ( y = mx + c) |
y = 0.0082x - 0.0215 |
|
3 |
Slop (m) |
0.0082x |
|
4 |
Intercept (c) |
0.0215 |
|
5 |
Correlation coefficient (r) |
0.9982 |
|
6 |
Precision 1. Repeatability 2.Intraday 3.Interday |
0.001048809 0.00044-0.00100 0.00044-0.00100 |
|
7 |
Range (µg/ml) |
5-30 (µg/ml) |
|
8 |
LOD(µg/ml) |
1.7304µg/ml |
|
9 |
LOQ(µg/ml) |
5.2439µg/ml |
CONCLUSION
In conclusion, the method proved effective for estimating the amount of Dapagliflozin in tablet dosage forms containing 10mg. The validation parameters demonstrated that the method is linear, precise and repeatable, ensuring reliable results. Furthermore, the method's simplicity in calculation and ease of execution make it ideal for routine analysis of marketed formulations. It is also suitable for use in dissolution testing, offering an efficient and practical approach for quality control in pharmaceutical settings. This method could be readily adopted for consistent and accurate monitoring of Dapagliflozin in various dosage forms.
REFERENCES


Ganesh Tiwari*, Viral Maheshwari, Rohan Shakywanshi, Rukhsar khan, Dr. Bhoomi Patel, Development of UV Spectroscopic Method of Dapagliflozin with Some Validation Parameter, Int. J. of Pharm. Sci., 2025, Vol 3, Issue 5, 42-54. https://doi.org/10.5281/zenodo.15317978
 10.5281/zenodo.15317978

