Swami Vivekanand College of Pharmacy (SVCP), Indore, M.P., India, 452020
Analytical method development is an approach to select an appropriate assay procedure to determine the composition of various formulations, to prove that particular analytical method is acceptable for use in pharmaceutical laboratories. By keeping all the major questions in mind present methodical evolution of analytical method development and validation is done, in which UV-spectroscopic methods are elaborated. Method development for simultaneous estimation of Zinc Pyrithione and Fluconazole was done in the present study. Literature review revealed that not a single method is reported for the simultaneous estimation of both the drugs in tablet dosage form.In UV-Spectroscopic method of analysis for multicomponent system, simultaneous estimation method was performed and validation of method was done as per ICH guidelines. The developed method is accurate, precise, convenient, in expensive and reproducible hence can be used for the routine analysis.
Every year a lot of drugs are introduced in the market, this could be new drugs or slight modification of the existing ones. Their always exist a time lag between the introduction of drug in the market and the introduction of drug in pharmacopoeias, hence there is a need to develop and validate new analytical methods for such drugs [1]. Internationally it has been recognized that a developed method should necessarily be validated, to show the qualification and competency of the analytical laboratory [2].
In the absence of any definite procedure for the evaluation of the novel or combination product, new methodologies are being progressed which is called as analytical method development. It is a continuous and inter-dependent process in pharmaceutical formulation and analysis [3].
Importance of analytical method development
Medicines are made for human welfare; hence they should meet with specific standards. Analytical methods are measure of the quality, safety and efficacy of the product. Significant improvement in precision and reduction in error can be achieved by an effective analytical development method and validation procedure [4].
All the chemical and physical properties of the analyte are collected. Standard analyte is obtained, and only those methods which are compatible with sample stability are considered.
Requirement of analytical methodology is essential to build up the analytical fig. of advantage like linearity, selectivity, specificity, range, accuracy, precision, LOD, LOQ etc. shall be outlined.
Literature survey is conducted to gather all type of information about the analyte.
The information gathered from the literature and prints; methodology is adapted. According to the requirements the methods are modified. Use of additional instrumentation may be necessary to reproduce, modify, improve or validate existing methods for in-house samples.
Installation qualification (IQ), operation qualification (OQ), and performance qualification (PQ) of instrument pertinent to research standard methodology is examined by an appropriate set up of instruments
During optimization rather than using a trial-and-error approach, it is better recommended that one parameter is changed at a time and set of conditions are isolated.
In this step documentation of analytical figure of merits are done like limit of detection, limit of quantification, linearity, time of analysis, cost etc.
The specimen solution needs to prompt specific, complete recognition of the peak interest of the medication other than all different matrix parts
Percentage recovery of spiked, actual standard medication into a sample grid which includes no analyte is evaluated. Optimization to reproducibility of recuperation from test to test must have appeared. It is not always essential to get 100% restoration so far as the outcomes are reproducible to perceive with a high level of assurance [3].
Problems in method development
1. Stored samples are initially accurate but slowly become inaccurate with low bias
2. Absorption issue: A serially diluted curve is concave. The response factors drop with decreasing concentration. An increased exposure due to number of dilutions, surface area contact, and time may cause this problem
3. Homogeneity: the sample to be analysed gets partitioned.
2. Experimental Work
Simultaneous Estimation Method
Protocol
Product name: Fludic (label claim: Zinc Pyrithione: 75mg; Fluconazole: 60mg)
Name of the manufacturer: Sun Pharmaceutical
Reagents and chemicals: Pure sample Zinc Pyrithione was procured from Triveni Interchem Pvt. Ltd. Vapi, India and pure sample of Fluconazole was obtained as gift sample from Assurgen Pvt Ltd, Vishakhapatnam, India.
Selection of solvent: 0.1N HCl Solution was selected as the solvent after considering the solubility and stability factor.
Preparation of stock solution
Stock solution of Fluconazole
10mg of Fluconazole was accurately weighed and dissolved in 100ml of 0.1N HCl solution to give 100μg/ml solution. 5ml of the above solution was than diluted up to 25ml using 0.1N HCl to give the concentration of 20μg/ml.
Stock solution of Zinc Pyrithione
15mg of Zinc Pyrithione was accurately weighed and dissolved in 100ml of 0.1N HCl solution to give 100μg/ml solution. 5ml of the above solution was than diluted up to 25ml using 0.1N HCl to give the concentration of 30μg/ml.
Selection of appropriate wavelength
5ml standard stock solution of each Zinc Pyrithione and Fluconazole was taken separately in 10ml volumetric flask. To both the solutions 3ml of 0.04% Bromocresol Green solution was added and volume was made using 0.1N HCl. The prepared solutions were then extracted using 10ml Chloroform. The inorganic layer that settles down was then separated and scanned over the range of 800-400nm at medium scan speed. The absorption maxima of both solutions were noted as working wavelength or λmax for analytical purpose. λmax or absorption maxima for Zinc Pyrithione was found to be 444nm and for Fluconazole it was 417nm.
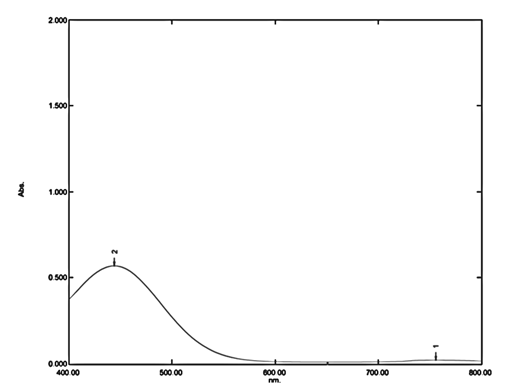
Fig. 01 - Absorption maxima of Zinc Pyrithione at 444nm

Fig. 02 - Absorption maxima of Fluconazole at 417nm.
Calibration curve for Zinc Pyrithione and Fluconazole:
Working solutions of Zinc Pyrithione and Fluconazole were prepared by taking 1, 2, 3, 4 and 5ml of standard stock solutions separately in 10ml volumetric flasks. To these solutions 3ml of 0.04% Bromocresol Green solution was added and mixed thoroughly. Volume was made up using 0.1N HCl solution. These dilutions were then extracted individually using 10ml chloroform. The extracted layer was used then used for analysis. Calibration curve for Zinc Pyrithione was plotted at 444nm while for Fluconazole it was plotted at 417nm
Table 01 - Calibration curve for Zinc Pyrithione
|
S. No. |
Conc. (in μg/ml) |
Absorbance of Replicate 1 (Abs.) |
Absorbance of Replicate 2 (Abs.) |
Absorbance of Replicate 3 (Abs.) |
Mean Absorbance (Abs.) |
SD |
|
1 |
3 |
0.034 |
0.031 |
0.034 |
0.0330 |
0.001732 |
|
2 |
6 |
0.071 |
0.072 |
0.075 |
0.0727 |
0.002082 |
|
3 |
9 |
0.108 |
0.110 |
0.113 |
0.1103 |
0.002517 |
|
4 |
12 |
0.142 |
0.147 |
0.141 |
0.1433 |
0.003215 |
|
5 |
15 |
0.179 |
0.181 |
0.175 |
0.1783 |
0.003055 |
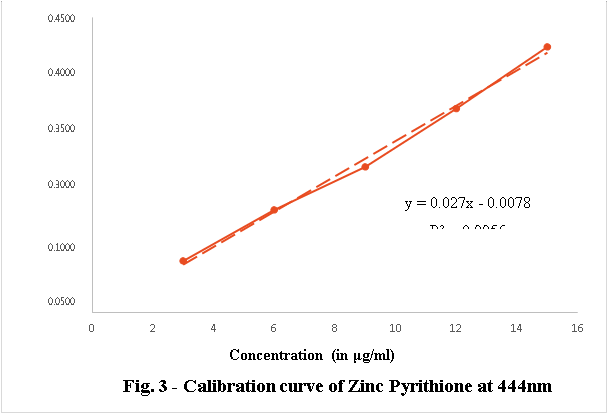
Table 02 - Calibration curve for Fluconazole
|
S. No. |
Conc. (in μg/ml) |
Absorbance of Replicate 1 (Abs.) |
Absorbance of Replicate 2 (Abs.) |
Absorbance of Replicate 3 (Abs.) |
Mean Absorbance (Abs.) |
SD |
|
1 |
2 |
0.074 |
0.071 |
0.078 |
0.074 |
0.003512 |
|
2 |
4 |
0.132 |
0.135 |
0.133 |
0.133 |
0.001528 |
|
3 |
6 |
0.218 |
0.221 |
0.216 |
0.218 |
0.002517 |
|
4 |
8 |
0.285 |
0.281 |
0.289 |
0.285 |
0.004000 |
|
5 |
10 |
0.352 |
0.353 |
0.357 |
0.354 |
0.002646 |

Fig. 4- Calibration curve of Fluconazole at 417nm
Simultaneous Equation Method Development
Working solutions of both the drugs were prepared in the similar manner to that prepared for the calibration curve. The absorbance of all the solutions were measured at absorbance maxima of both drugs (444nm for Zinc Pyrithione & 417nm for Fluconazole). The concentration of drug X (Fluconazole) and Y (Zinc Pyrithione) in sample solution was determined by the Simultaneous Estimation method using formula:
Cx = A2ay1 – A1ay2 /ax2ay1-ax1ay2
Cy = A1ax2 – A2ax1 /ax2ay1-ax1ay2
Where,
???????? and ???????? are the concentration of Fluconazole and Zinc Pyrithione respectively,
????1 and ????2 are the absorbance of sample solution at 417nm and 444nm respectively,
????????1 and ????????2 are absorptivity of Fluconazole at 417nm and 444nm respectively,
????????1 and ????????2 are absorptivity of Zinc Pyrithione at 417nm and 444nm respectively.
The absorptivity value of Zinc Pyrithione and Fluconazole from each solution was calculated
using following formula-
Absorptivity = Absorbance/Concentration
Table 03 - Absorbance of Zinc Pyrithione working solutions at 417nm
|
S. No. |
Conc. (μg/ml) |
Absorbance of Replicate 1 (Abs.) |
Absorbance of Replicate 2 (Abs.) |
Absorbance of Replicate 3 (Abs.) |
Mean Absorbance (Abs.) |
Absorptivity |
SD |
|
1 |
3 |
0.034 |
0.031 |
0.034 |
0.0330 |
0.0110 |
0.001732 |
|
2 |
6 |
0.071 |
0.072 |
0.075 |
0.0727 |
0.0121 |
0.002082 |
|
3 |
9 |
0.108 |
0.11 |
0.113 |
0.1103 |
0.0123 |
0.002517 |
|
4 |
12 |
0.142 |
0.147 |
0.141 |
0.1433 |
0.0119 |
0.003215 |
|
5 |
15 |
0.179 |
0.181 |
0.175 |
0.1783 |
0.0119 |
0.003055 |
|
Mean absorptivity of Zinc Pyrithione at 417nm (ay1) |
0.0118 |
|
|||||
Table 04 - Absorbance of Zinc Pyrithione working solutions at 444nm
|
S. No. |
Conc. (μg/ml) |
Absorbance of Replicate 1 (Abs.) |
Absorbance of Replicate 2 (Abs.) |
Absorbance of Replicate 3 (Abs.) |
Mean Absorbance (Abs.) |
Absorptivity |
SD |
|
1 |
3 |
0.08 |
0.082 |
0.074 |
0.0787 |
0.0262 |
0.004163 |
|
2 |
6 |
0.153 |
0.156 |
0.161 |
0.1567 |
0.0261 |
0.004041 |
|
3 |
9 |
0.224 |
0.223 |
0.221 |
0.2227 |
0.0247 |
0.001528 |
|
4 |
12 |
0.314 |
0.309 |
0.312 |
0.3117 |
0.0260 |
0.002517 |
|
5 |
15 |
0.407 |
0.401 |
0.41 |
0.4060 |
0.0271 |
0.004583 |
|
Mean absorptivity of Zinc Pyrithione at 444nm (ay2) |
0.0260 |
|
|||||
Table 05 - Absorbance of Fluconazole working solutions at 417nm
|
S. No. |
Conc. (μg/ml) |
Absorbance of Replicate 1 (Abs.) |
Absorbance of Replicate 2 (Abs.) |
Absorbance of Replicate 3 (Abs.) |
Mean Absorbance (Abs.) |
Absorptivity |
SD |
|
1 |
2 |
0.074 |
0.071 |
0.078 |
0.074 |
0.0372 |
0.003512 |
|
2 |
4 |
0.132 |
0.135 |
0.133 |
0.133 |
0.0333 |
0.001528 |
|
3 |
6 |
0.218 |
0.221 |
0.216 |
0.218 |
0.0364 |
0.002517 |
|
4 |
8 |
0.285 |
0.281 |
0.289 |
0.285 |
0.0356 |
0.004000 |
|
5 |
10 |
0.352 |
0.353 |
0.357 |
0.354 |
0.0354 |
0.002646 |
|
Mean absorptivity of Fluconazole at 417nm (ax1) |
0.0356 |
|
|||||
Table 06 - Absorbance of Fluconazole working solutions at 444nm
|
S. No. |
Conc. (μg/ml) |
Absorbance of Replicate 1 (Abs.) |
Absorbance of Replicate 2 (Abs.) |
Absorbance of Replicate 3 (Abs.) |
Mean Absorbance (Abs.) |
Absorptivity |
SD |
|
1 |
2 |
0.048 |
0.051 |
0.047 |
0.0487 |
0.0243 |
0.002082 |
|
2 |
4 |
0.085 |
0.083 |
0.085 |
0.0843 |
0.0211 |
0.001155 |
|
3 |
6 |
0.14 |
0.133 |
0.135 |
0.1360 |
0.0227 |
0.003606 |
|
4 |
8 |
0.202 |
0.199 |
0.196 |
0.1990 |
0.0249 |
0.003 |
|
5 |
10 |
0.23 |
0.226 |
0.227 |
0.2277 |
0.0228 |
0.002082 |
|
Mean absorptivity of Fluconazole at 444nm (ax2) |
0.0231 |
|
|||||
Analysis of Mixed Standard
3ml of Fluconazole standard solution and 2.5ml of Zinc Pyrithione standard solution was taken together in a 10ml volumetric flask, to this 3ml of 0.4% Bromocresol Green was added and volume was made up to the mark using 0.1N HCl solution. The resultant solution was then extracted using 10ml chloroform. The inorganic layer that separates out was analyses against reagent blank to get the absorbance at 417nm (A1) and at 435.6nm (A2)
Table 7 – Observations for Absorbance and Absorptivity for Simultaneous Estimation Method
|
S. No. |
Wavelength |
Absorbance (Abs.) |
Absorptivity |
|
|
Fluconazole |
Zinc Pyrithione |
|||
|
1 |
417 nm |
A1 = 0.302 |
ax1 = 0.0356 |
ay1 = 0.0118 |
|
2 |
444 nm |
A2 = 0.335 |
ax2 = 0.0231 |
ay2 = 0.0260 |

Table 8 – Analysis result of Mixed Standard for Simultaneous Estimation Method
|
S. No. |
Drug |
Amount added (in mg) |
Amount Recovered (in mg) |
% Amount Recovered |
|
1 |
Fluconazole |
6.0 |
Cx = 5.97 |
99.50% |
|
2 |
Zinc Pyrithione |
7.5 |
Cy = 7.58 |
101.07% |
Validation of Simultaneous Estimation method
Linearity
The calibration curves (Figures 10 and 11) were constructed by plotting the absorbance versus the concentration ranges from 3, 6, 9, 12, 15 ????g/mL and 2, 4, 6, 8, 10 ????g/mL for Zinc Pyrithione and Fluconazole respectively. It was found that, the calibration curves were linear in these concentration ranges with their correlation coefficient values (????2) greater than 0.99 for both the drugs. Results revealed that good correlation exists between the concentration of the sample and their absorbance
Accuracy
Accuracy of the method was determined by applying this described method to synthetic excipients containing known amount of each drug corresponding to 50%, 75%, 100%, 125%, and 150% of the label claim of Zinc Pyrithione and Fluconazole. The amount of Zinc Pyrithione and Fluconazole recovered in each level was calculated and results are presented in Tables. Since the RSD is below 2%. Hence, we could say that the method developed is accurate.
Table 9 - Accuracy testing of Zinc Pyrithione for Simultaneous Estimation Method
|
S. No. |
% Conc. |
Amount added (in mg) |
Absorbance (Abs.) |
Amount Recovered (in mg) |
% Recovery |
SD |
RSD |
|
|
A1 |
A2 |
|||||||
|
1 |
50% |
3.75 |
0.151 |
0.168 |
3.81 |
101.60% |
0.052 |
1.39% |
|
0.149 |
0.165 |
3.72 |
99.20% |
|||||
|
0.152 |
0.167 |
3.72 |
99.20% |
|||||
|
2 |
75% |
5.63 |
0.225 |
0.249 |
5.60 |
99.45% |
0.055 |
0.98% |
|
0.228 |
0.251 |
5.61 |
99.64% |
|||||
|
0.227 |
0.252 |
5.70 |
101.24% |
|||||
|
3 |
100% |
7.50 |
0.305 |
0.335 |
7.58 |
101.07% |
0.021 |
0.28% |
|
0.307 |
0.338 |
7.55 |
100.66% |
|||||
|
0.304 |
0.336 |
7.54 |
100.62% |
|||||
|
4 |
125% |
9.38 |
0.377 |
0.416 |
9.32 |
99.36% |
0.091 |
0.96% |
|
0.384 |
0.423 |
9.46 |
101.29% |
|||||
|
0.380 |
0.421 |
9.49 |
101.17% |
|||||
|
5 |
150% |
11.25 |
0.459 |
0.507 |
11.38 |
101.15% |
0.093 |
0.82% |
|
0.455 |
0.504 |
11.36 |
100.97% |
|||||
|
0.456 |
0.502 |
11.21 |
99.64% |
|||||
Table 10 - Accuracy testing of Fluconazole for Simultaneous Estimation Method
|
S. No. |
% Conc. |
Amount added (in mg) |
Absorbance (Abs.) |
Amount Recovered (in mg) |
% Recovery |
SD |
RSD |
|
|
A1 |
A2 |
|||||||
|
1 |
50% |
3.0 |
0.151 |
0.168 |
2.98 |
99.33% |
0.040 |
1.35% |
|
0.149 |
0.165 |
2.95 |
98.33% |
|||||
|
0.152 |
0.167 |
3.03 |
101.00% |
|||||
|
2 |
75% |
4.5 |
0.225 |
0.249 |
4.46 |
99.11% |
0.042 |
0.93% |
|
0.228 |
0.251 |
4.54 |
100.89% |
|||||
|
0.227 |
0.252 |
4.48 |
99.56% |
|||||
|
3 |
100% |
6.0 |
0.305 |
0.335 |
6.09 |
101.50% |
0.042 |
0.69% |
|
0.307 |
0.338 |
6.11 |
101.83% |
|||||
|
0.304 |
0.336 |
6.03 |
100.50% |
|||||
|
4 |
125% |
7.5 |
0.377 |
0.416 |
7.49 |
99.87% |
0.079 |
1.05% |
|
0.384 |
0.423 |
7.64 |
101.87% |
|||||
|
0.380 |
0.421 |
7.52 |
100.26% |
|||||
|
5 |
150% |
9.0 |
0.459 |
0.507 |
9.11 |
101.22% |
0.051 |
0.57% |
|
0.455 |
0.504 |
9.01 |
100.11% |
|||||
|
0.456 |
0.502 |
9.08 |
100.89% |
|||||
Precision
The intra and inter day precision was calculated by assay of the sample solution on the same day at different time intervals and on different days. The result of intraday and inter day precision study is reported in the table.
Table 11 - Intra-day precision of Zinc Pyrithione for Simultaneous Estimation Method
|
S. No. |
Interval |
Absorbance (Abs.) |
Amount Recovered (in mg) |
% Recovery |
|
|
A1 |
A2 |
||||
|
1 |
0 hour |
0.305 |
0.335 |
7.58 |
1 |
|
2 |
2 hours |
0.307 |
0.338 |
7.55 |
2 |
|
3 |
4 hours |
0.304 |
0.336 |
7.54 |
3 |
|
SD |
0.021 |
SD |
|||
|
RSD |
0.28% |
RSD |
|||
Table 12 - Intra-day precision of Fluconazole for Simultaneous Estimation Method
|
S. No. |
Interval |
Absorbance (Abs.) |
Amount Recovered (in mg) |
% Recovery |
|
|
A1 |
A2 |
||||
|
1 |
0 hour |
0.305 |
0.335 |
6.09 |
101.50% |
|
2 |
2 hours |
0.307 |
0.338 |
6.11 |
101.83% |
|
3 |
4 hours |
0.304 |
0.336 |
6.03 |
100.50% |
|
SD |
0.042 |
|
|||
|
RSD |
0.69% |
|
|||
Table 13 - Inter-day precision of Zinc Pyrithione for Simultaneous Estimation Method
|
S. No. |
Interval |
Absorbance (Abs.) |
Amount Recovered (in mg) |
% Recovery |
|
|
A1 |
A2 |
||||
|
1 |
Day 1 |
0.305 |
0.335 |
7.58 |
101.07% |
|
2 |
Day 2 |
0.308 |
0.340 |
7.62 |
101.60% |
|
3 |
Day 3 |
0.301 |
0.332 |
7.45 |
99.33% |
|
SD |
0.089 |
|
|||
|
RSD |
1.18% |
|
|||
Table 14 - Inter-day precision for Fluconazole for Simultaneous Estimation Method
|
S. No. |
Interval |
Absorbance (Abs.) |
Amount Recovered (in mg) |
% Recovery |
|
|
A1 |
A2 |
||||
|
1 |
Day 1 |
0.305 |
0.335 |
6.09 |
1 |
|
2 |
Day 2 |
0.308 |
0.340 |
6.11 |
2 |
|
3 |
Day 3 |
0.301 |
0.332 |
5.96 |
3 |
|
SD |
0.081 |
|
|||
|
RSD |
1.34% |
|
|||
Limit of Detection (LOD) and Limit of Quantification (LOQ)
LOD and LOQ were calculated based on the standard deviation of the response and the slope of calibration graph. To calculate it calibration curve for Zinc Pyrithione and Fluconazole was plotted at their λmax. Using this data regression analysis was performed using the data analysis function in Microsoft EXCEL 2017, to get the values of Residual standard deviation of Regression line and slope of the regression line. LOD and LOQ was calculated using the following formula-


The LOD and LOQ for Zinc Pyrithione was found to be 1.217 and 3.689 μg/ml respectively while for Fluconazole it was found to be 0.578 and 1.751 μg/ml respectively.
Table 15 - Calibration curve of Zinc Pyrithione for calculating LOD & LOQ for Simultaneous Estimation Method
|
S. No. |
Conc. (μg/ml) |
Absorbance of Replicate 1 (Abs.) |
Absorbance of Replicate 2 (Abs.) |
Absorbance of Replicate 3 (Abs.) |
Mean Absorbance |
SD |
|
1 |
3 |
0.034 |
0.031 |
0.034 |
0.0330 |
0.001732 |
|
2 |
6 |
0.071 |
0.072 |
0.075 |
0.0727 |
0.002082 |
|
3 |
9 |
0.108 |
0.110 |
0.113 |
0.1103 |
0.002517 |
|
4 |
12 |
0.142 |
0.147 |
0.141 |
0.1433 |
0.003215 |
|
5 |
15 |
0.179 |
0.181 |
0.175 |
0.1783 |
0.003055 |
Table 16 - Calibration curve of Fluconazole for calculating LOD & LOQ for Simultaneous Estimation Method
|
S. No. |
Conc. (μg/ml) |
Absorbance of Replicate 1 (Abs.) |
Absorbance of Replicate 2 (Abs.) |
Absorbance of Replicate 3 (Abs.) |
Mean Absorbance (Abs.) |
SD |
|
1 |
2 |
0.074 |
0.071 |
0.078 |
0.074 |
0.003512 |
|
2 |
4 |
0.132 |
0.135 |
0.133 |
0.133 |
0.001528 |
|
3 |
6 |
0.218 |
0.221 |
0.216 |
0.218 |
0.002517 |
|
4 |
8 |
0.285 |
0.281 |
0.289 |
0.285 |
0.004000 |
|
5 |
10 |
0.352 |
0.353 |
0.357 |
0.354 |
0.002646 |
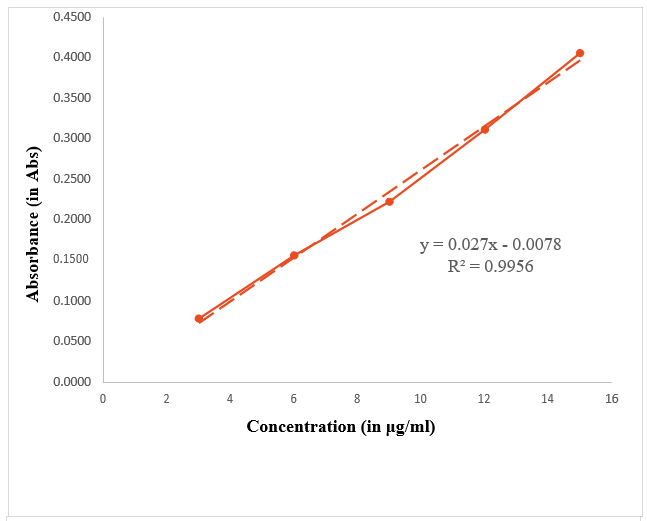
Fig. 5 - Calibration curve of Zinc Pyrithione for calculating LOD and LOQ for Simultaneous Estimation Method
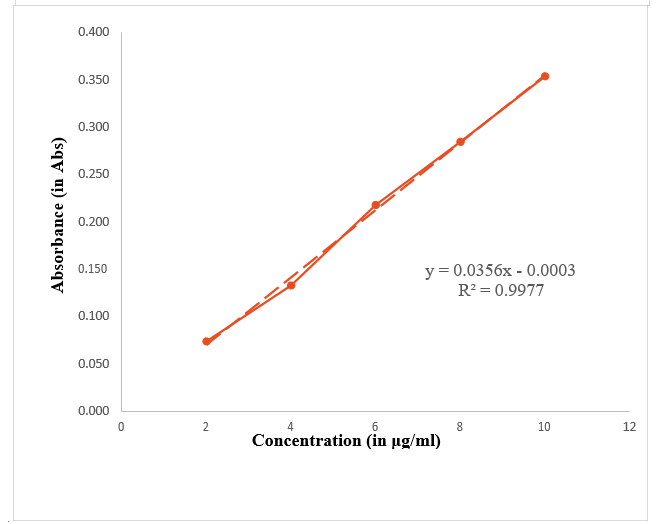
Fig. 6 - Calibration curve of Fluconazole for calculating LOD and LOQ for Simultaneous Estimation Method
Table 17 – Results of LOD and LOQ for Zinc Pyrithione and Fluconazole for simultaneous estimation method
|
S. No. |
Drug |
SD |
Slope |
LOD (in μg/ml) |
LOQ (in μg/ml) |
|
1 |
Zinc Pyrithione |
0.00985 |
0.0267 |
1.217 |
3.689 |
|
2 |
Fluconazole |
0.00623 |
0.0356 |
0.578 |
1.751 |
Stability
Stability of the working solutions and drug bromocresol green complex were checked for 6 hours at room temperature and the absorbance was measured at regular intervals. Amount of drug present in the solution was calculated. The relative standard deviation was found to be 0.28% for Zinc Pyrithione and 0.76% for Fluconazole. Hence, it confirms that the working solution is stable for 6 hours without any degradation at room temperature. This also confirmed that the complex formed between the drug and the Bromocresol Green is also stable up to 6 hours, provided it should be kept protected from direct sunlight.
Stability of Working Solution of Zinc Pyrithione for Simultaneous Estimation Method
|
S. No. |
Interval |
Absorbance (Abs.) |
Amount Recovered (in mg) |
% Recovery |
|
|
A1 |
A2 |
||||
|
1 |
0 hour |
0.302 |
0.334 |
7.51 |
100.13% |
|
2 |
2 hours |
0.303 |
0.334 |
7.47 |
99.60% |
|
3 |
4 hours |
0.303 |
0.336 |
7.58 |
101.07% |
|
4 |
6 hours |
0.299 |
0.331 |
7.45 |
99.33% |
|
SD |
0.057 |
|
|||
|
RSD |
0.28% |
|
|||
Table 18 - Stability of Working Solution of Fluconazole for Simultaneous Estimation Method
|
S. No. |
Interval |
Absorbance (Abs.) |
Amount Recovered (in mg) |
% Recovery |
|
|
A1 |
A2 |
||||
|
1 |
0 hour |
0.302 |
0.334 |
5.99 |
99.83% |
|
2 |
2 hours |
0.303 |
0.334 |
6.03 |
100.5% |
|
3 |
4 hours |
0.303 |
0.336 |
5.99 |
99.83% |
|
4 |
6 hours |
0.299 |
0.331 |
5.92 |
98.67% |
|
SD |
0.046 |
|
|||
|
RSD |
0.76% |
|
|||
Analysis of Fludic
20 tablets of Fludic were weighed and their average weight was calculated, crushed into fine powder and then powder equivalent to 7.5mg Zinc Pyrithione and 6mg Fluconazole was weighed and dissolved in 10ml methanol. Supernatant liquid was transferred to 100ml of volumetric flask through a whatman no. #41filter paper. The residue was washed twice using 0.1N HCl solution. The volume was also made up to the mark using 0.1N HCl solution. 1ml of the above solution was further diluted to 10ml using 0.1N HCl solution. From this 1ml solution was further taken in 10ml volumetric flask, add 3ml of 0.04% Bromocresol Green was added to it. Volume was made up using 0.1N HCl solution. The solution was then extracted using 10ml chloroform and the absorbance of inorganic layer was then measured at 417nm (A1) and 444nm (A2).
A1 = 0.301
ax1 = 0.0356
ay1 = 0.0118
A2 = 0.333
ax2 = 0.0231
ay2 = 0.0260
Table 19 – Assay result of Fludic by Simultaneous Estimation Method
|
S. No. |
Drug |
Amount added (in mg) |
Amount Recovered (in mg) |
% Amount Recovered |
|
1 |
Fluconazole |
6.0 |
Cx = 5.97 |
99.50% |
|
2 |
Zinc Pyrithione |
7.5 |
Cy = 7.49 |
99.87% |
RESULT AND DISCUSSION
Simultaneous estimation of Zinc Pyrithione and Fluconazole in tablet dosage form was carried out using following UV- Spectroscopic method –
• Simultaneous Estimation Method
Table 20 - Results of Simultaneous Estimation Method
|
S. No. |
Parameter |
Results |
|
1 |
Solvent system |
0.1N HCl |
|
2 |
Derivatizing agent |
0.4% Bromocresol Green solution |
|
3 |
Wavelength of determination |
Fluconazole – 417nm Zinc Pyrithione – 444nm |
|
4 |
Assay of Tablet |
98% - 102% |
|
5 |
Linearity |
R2 > 0.99 |
|
6 |
Accuracy |
RSD < 2% |
|
7 |
Precision |
RSD < 2% |
|
8 |
LOD
|
1.217 μg/ml 0.578 μg/ml |
|
9 |
LOQ
|
3.689 μg/ml 1.751 μg/ml |
|
10 |
Stability of working solutions |
Up to 6 hours |
SUMMARY AND CONCLUSION:
Analytical method development is an approach to select an appropriate assay procedure to determine the composition of various formulations, to prove that particular analytical method is acceptable for use in pharmaceutical laboratories. By keeping all the major questions in mind present methodical evolution of analytical method development and validation is done, in which UV-spectroscopic methods are elaborated. Method development for simultaneous estimation of Zinc Pyrithione and Fluconazole was done in the present study. Literature review revealed that not a single method is reported for the simultaneous estimation of both the drugs in tablet dosage form. In UV-Spectroscopic method of analysis for multicomponent system, simultaneous estimation method was performed and validation of method was done as per ICH guidelines. The developed method is accurate, precise, convenient, inexpensive and reproducible hence can be used for the routine analysis.
REFERENCES


Jyoti Chourasiya*, Archana Tiwari, Aarti Nandwana, Simultaneous Estimation of Fluconazole and Zinc Pyrithione By Uv Spectroscopy, Int. J. of Pharm. Sci., 2025, Vol 3, Issue 5, 1334-1349. https://doi.org/10.5281/zenodo.15374756
 10.5281/zenodo.15374756
