Eklavya College Of Pharmacy
Mass spectrometry is a technique used to find and identify proteins and other molecules in biological samples. It can also help in studying how proteins interact with each other. In this method, a molecule is broken into charged pieces. These pieces(ions) are then moved, separated, and detected based on their mass-to-charge (m/z) ratio. The detector shows how many ions are present by measuring their signals. This chapter also explains the common problems that can occur while collecting raw data and how the data is processed to read the mass spectrum. First, peaks are selected from a survey scan. These peaks are then studied in MS/MS to find the mass of peptide fragments. The fragments are matched with a database to get a peptide score. Finally, proteins are identified from the correctly matched peptides
Mass spectrometry (MS) is a powerful method used to study different chemicals in areas likethe environment, medicine, pharmacy, forensics, and food testing(1). In this technique, thesample (solid or liquid) is changed into gas and then into charged particles called ions(2). These ions are separated based on how they move in electric and magnetic fields. The results appearas a mass spectrum, which is a graph showing different ions based on their mass(3). If a puresubstance is present, the graph shows a strong peak with a high m/z value. When MS isconnected with instruments like HPLC or GLC, it becomes more sensitive and can detect even very small amounts of a substance(4). MS is also used to find the structure and molecular weight of organic and biological compounds. It is an important tool in proteomics, the study of protein structures (5).
PRINCIPLE-
In a mass spectrometer, the sample is first heated to create a high vapor pressure, which helps the molecules break into fragments and become ionized. These charged ions are then accelerated by applying voltage, making them move through the mass analyzer based on their mass. Ions that have the same charge travel with the same speed. Next, the ions enter a magnetic field in the detector. This magnetic force pushes ions with the same speed into a curved or circular path. Charged ions bend because the magnetic field acts like a centripetal force, pulling them toward the center. Only the ions that have the right combination of electric and magnetic properties pass through without bending and reach the data system, where their signals are recorded. The mass spectrum created from this process is then used to study and identify substances in the sample(6)
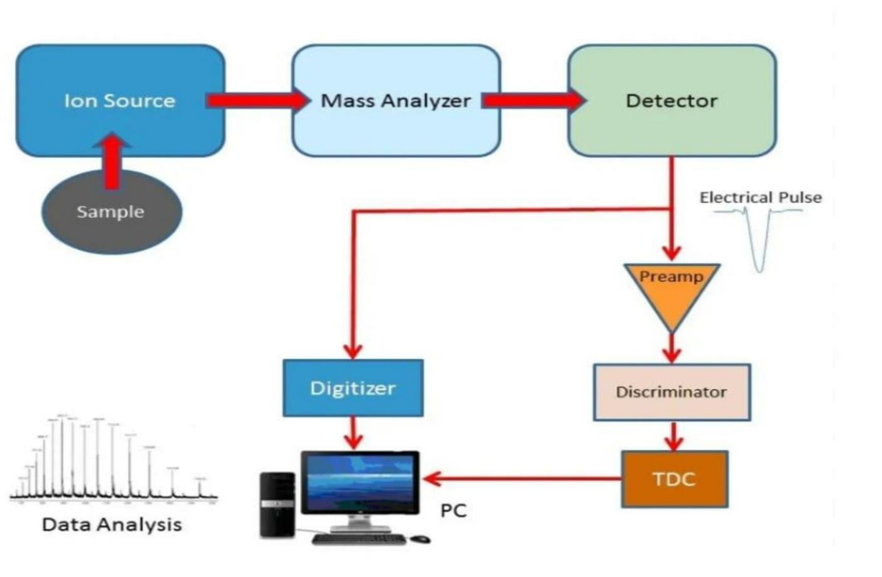
Fig no .1 working of mass spectroscopy
WORKING–
Before a sample can be analyzed in mass spectrometry, it must be properly prepared forionization, which is an essential step in the working of the instrument. Samples are commonly converted into liquid or gaseous form using chromatography techniques such as gas chromatography and liquid chromatography(7). In gas chromatography, thesample is diluted, vaporized, and separated based on properties like molecular size,shape, boiling point, and weight, after which the volatile components are directed intothe mass spectrometer for ionization and detection(8). Liquid chromatographyseparates components according to theirinteraction with the mobile and stationaryphases, mainly influenced by polarity, allowing each compound to enter the massspectrometer individually for further ionization, mass separation, and detection(9).Other ionization-based preparation methods, such as electrospray ionization and fastatom bombardment, help convert samples into ions directly from liquid or solidphases(10). These steps enable the mass spectrometer to accurately analyze a widerange of biomolecules, including proteins, nucleic acids, lipids, and fatty acids, as part of its overall working mechanism(11,12).
RECENT ADVANCEMENT –
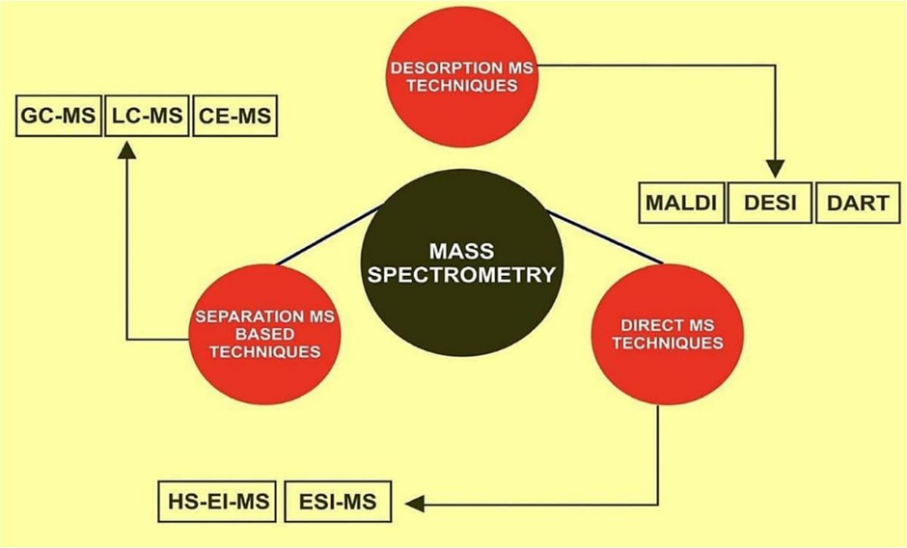
Fig no.2 Recent advancement of mass spectroscopy
APPLICATION-
[1] Analysis of Aerosol Particles-
•Helps monitor and control air pollution.
• Assists in predicting climate change effects.
• Evaluates health risks from airborne particles.
• Identifies sources of dust, smoke, and pollutants
•Supports environmental and atmospheric research (13,14,15).
[2] Emerging Medical and Biomedical -
•Detects age-related protein changes.
•Identifies disease biomarkers (Alzheimer’s, Parkinson’s).
•Detects antibiotic-resistant microbes.
Used in toxicology and drug testing.
•Checksherbal, nutrition, and supplement
Composition (15,16,17,18,19,20,21,22,23,24,25,26,27)
[3] Identification of Environmental Pollutants
Mass spectrometry (MS) can be used to identify environmental pollutants such as
nitrogen oxides, sulfur dioxide, plastics, lead, and particulate matter that are harmful to
both humans and animals. By combining the selectivity of liquid chromatography (LC)
with the high sensitivity of MS, LC-MS has become a powerful tool for environmental
analysis. It helps detect steroid estrogens and nitrosamines in wastewater, analyze
polar, ionic, and heat-sensitive substances, identify antibiotics in pesticides, and detect
perfluorinated organic (PFO) compounds found in cleaning products, textiles, and
photographic materials. Thus, LC-MS plays an important role in assessing and
controlling environmental pollution (28).
[4] Proteomics Mass spectrometry (MS) is widely used for protein analysis, helping in protein
characterization and sequencing through soft ionization methods like electrospray and
MALDI. It can identify proteins of different molecular weights, study changes in protein
expression, detect post-translational modifications, and analyze important interactions
such as protein–ligand, protein–protein, and protein–DNA interactions (29).
?
CONCLUSION
Advanced mass spectrometry techniques can now accurately detect andidentify over 2,000 proteins within a single proteome. In complex mixtures, the majorchallenges are not sensitivity, but rather the wide dynamic range—where highly abundantpeptides can overshadow those present in low amounts—and the limited sequencing speed ofthe instrument..
??REFERENCES


Ashwini Shinde*, Shruti Mali, Mrudula More, Mass Spectrometry -A Powerful Tool for Modern Analysis, Int. J. of Pharm. Sci., 2026, Vol 4, Issue 2, 2299-2303. https://doi.org/10.5281/zenodo.18640058
 10.5281/zenodo.18640058
