Centre For Pharmaceutical Sciences, Jntuh University College of Engineering, Science and Technology Hyderabad, Kukatpally, Telangana-500085.
The purpose of this research was to develop and evaluate sustained release microspheres of Vildagliptin, an anti-diabetic drug. The sustained release approach allows the drug to be released gradually into the body. Microspheres were prepared using the ionic gelation technique with sodium alginate as the polymer, calcium chloride as the cross-linking agent, along with Sustained release excipients such as Metalose 90SH-100SR, Metalose 90 SH-4000SR, Natrosol 250 (Avoids the burst release of API). The spherical shape of the microspheres was obtained through the injection method. The prepared formulations were subjected to various evaluation parameters including physical appearance, percentage yield, flow properties, swelling index, drug content, entrapment efficiency, in vitro dissolution studies, particle size analysis, and drug–excipient compatibility studies (FTIR). Among the formulations, F6 demonstrated a sustained drug release for up to 12 hours. Based on drug content and dissolution profiles, F6 was identified as the optimized formulation. Further, release kinetics of F6 formulation were studied.
Microspheres are the small spherical shaped particles. Microspheres with sustained release or controlled release mechanism shows higher efficiency. Microspheres can be formulated using a variety of polymers, including natural, bio-degradable, synthetic and non-biodegradable types. Microspheres help in providing the constant and prolonged therapeutic effect in the body and also decreases the toxicity and side effects by the sustained or controlled release. Due to the reduced particle size, absorption of drug in to the systemic circulation increases, which leads to the efficient therapeutic effect. (V, 2015). The main disadvantages like repeated injections and multiple dosing can be permanently eliminate by using microspheres. And also increases the patient compliance. Microcapsule: the inner core material which is encapsulated by the outer polymer shell and helps in the delivery of drug by providing the sustained or controlled release is called as microcapsule. Micromatrices: micromatrices are also called as matrix – type microspheres, these are somewhat different from the microcapsules because the drug is uniformly distributed all over the polymer rather than getting encapsulation.
There are various types of microspheres are available some are under the usage and some are under the study.
Biodegradable polymeric microspheres
Synthetic polymeric microspheres
There are various techniques of preparation of microspheres:
Vildagliptin is widely used to treat the type II diabetes mellitus. Dipeptidyl peptidase – 4 is an enzyme which inhibits the secretion of incretin hormones such as glucagon like peptide (GLP) and gastric inhibitory peptide (GIP). These incretin hormones have the ability to sensitize alpha and beta cells and increases the glucose dependent insulin secretion in the body so that blood glucose levels will be in control. As the Vildagliptin inhibits the DPP – 4 enzymes, which leads to the increase in availability of incretin hormones, so that hyperglycaemia can be controlled. (Santwana Padhi, 28 August 2020)
2.MATERIALS AND METHOD:
2.1 MATERIALS:
Chemicals used: Vildagliptin was provided as a gift by MSN Laboratories private limited. sodium alginate was from Finar chemicals, calcium chloride was from Virat labs, Mumbai, sodium hydroxide was from Research – lab fine chem industries, Mumbai. Potassium dihydrogen phosphate was from Fisher scientific, Metalose 90SH – 100SR, Metalose 90SH – 4000SR are from Shin-Etsu Natrosol 250 was from Ashland.
Equipment used: UV visible spectrophotometer (Shimadzu UV-1800), magnetic stirrer (Remi 1ml), homogeniser (Remi), dissolution apparatus (Disso 8000 Lab India), FTIR (Bruker α Alpha-T, weighing balance (Wensar) and hot air oven (Dwaraka Scientifics).
2.2 Methods
2.2.1 Analytical method for Vildagliptin:
Preparation of pH 7.4 buffer: Took 6.8gm of KH2PO4 and 1.56gm of sodium hydroxide in 500ml of water and sonicated for 15 minutes and transferred the solution in to 1000ml volumetric flask and made the volume up to the mark with water.
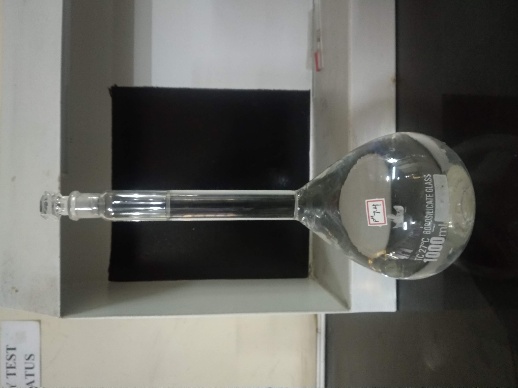
Figure 1: pH 7.4 Buffer
Preparation of standard stock solution:
A standard stock solution was prepared by accurately weighed 100mg of Vildagliptin in 100ml volumetric flask and dissolved in pH7.4 buffer and made the volume up to the mark so that 1000ppm was produced. From the 1000ppm took 10ml in 100ml volumetric flask and made the volume up to the mark with buffer, so that 100ppm was produced. From the 100ppm took 10ml in 100ml volumetric flask and made the volume up to the mark with buffer so that 10ppm concentration was produced.
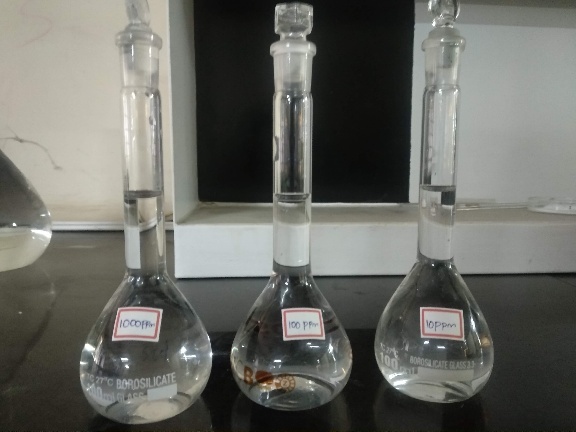
Figure 2: Stock solution
10ppm was used for initial spectral scan in the UV range of 400 – 200nm to detect the maximum wavelength. It has shown that the maximum absorbance at the wave length 206nm. Further dilutions were prepared from the stock solution to obtain the linearity.
Construction of calibration curve:
The serial dilutions were prepared from the 100ppm stock solution. Took 2ml, 3ml, 4ml, 5ml and 6ml from 100ppm stock solution in 10ml volumetric flasks and made the volume up to the mark with buffer. 10, 20, 30, 40, 50 and 60ppm concentrations were produced and observed under the UV visible spectrophotometer.
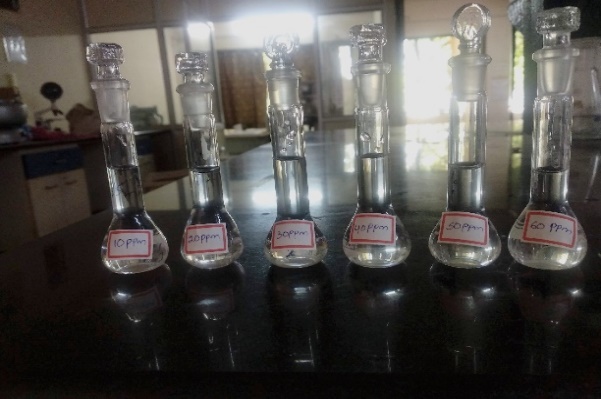
Figure 3: Serial dilutions
2.2.2 Drug excipient compatibility studies by FTIR studies:
Drug-excipient compatibility assessment using FTIR (Fourier Transform infrared spectroscopy) plays a vital role in pharmaceutical formulation development, as it ensures the stability and effectiveness of the product. FTIR detects possible interactions between the drug and excipients by monitoring alterations in their spectral profiles. Such evaluations are necessary to avoid undesirable reactions that may compromise the drug’s quality, safety, or shelf life. FTIR spectroscopy operates by detecting how molecules absorb and transmit infrared radiation. Each functional group within a molecule absorbs IR light at characteristic frequencies, generating a distinct spectral fingerprint.
Table 1: Formulation Table of Vildagliptin sustained release microspheres
|
Formulation |
API(g) used in the total formulation (For 10 capsules). capsule is 200mg |
Sodium |
Metalose |
Metalose |
Natrosol 250 (g) |
Carbopol |
CaCl2 (%) |
Ethanol (ml) |
|
F1 |
2 |
3 |
0.05 |
0.05 |
0.75 |
0.1 |
7 |
- |
|
F2 |
2 |
3 |
0.1 |
0.2 |
0.1 |
0.3 |
5 |
- |
|
F3 |
2 |
2 |
0.3 |
0.3 |
0.1 |
- |
5 |
- |
|
F4 |
2 |
2 |
0.5 |
0.5 |
0.2 |
- |
5 |
5 |
|
F5 |
2 |
2 |
0.5 |
0.5 |
0.3 |
- |
5 |
- |
|
F6 |
2 |
2 |
0.8 |
0.7 |
0.4 |
- |
5 |
- |
2.2.3 Preparation of Vildagliptin sustained release microspheres: (Ramu Samineni, 25 December 2016)
Several steps were performed to prepare the microspheres:
Preparation of sodium alginate solution:
Took 1gram of extra pure sodium alginate in 50ml of distilled water to get the 2% solution. Homogenized until sodium alginate is well dissolved.
Addition of API and Excipients:
The required amount of excipients was added to the alginate solution and homogenized until excipients are evenly dissolved without any lumps. Then the required amount of Vildagliptin is added by dissolving it in few ml of water.
Homogenization:
The entire content was homogenized for 15 minutes to evenly distribute the drug throughout the solution, to maintain the uniformity and to prevent the lump formation.
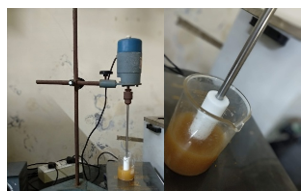
Figure 4: Homogenization of API and Excipients
Preparation of calcium chloride solution:
Took 5 grams of anhydrous calcium chloride and dissolved in few ml of water and transferred in to 100ml volumetric flask and made the volume up to the mark with water to get the 5% calcium chloride solution.
Preparation of microspheres:
Through ionotropic gelation method, with the help of syringe, dispersed the prepared solution drop by drop without any bubbles in to the calcium chloride solution which is placed on the magnetic stirrer along with the magnetic bead inside the beaker and stirred at 250rpm.
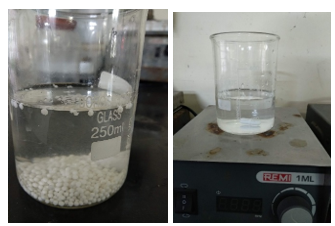
Figure 5: Preparation of Vildagliptin sustained release microspheres
Filtration:
The obtained microspheres were separated from the calcium chloride solution by filtration using perforated funnel and washed with water to remove the calcium chloride which is present on the microspheres.
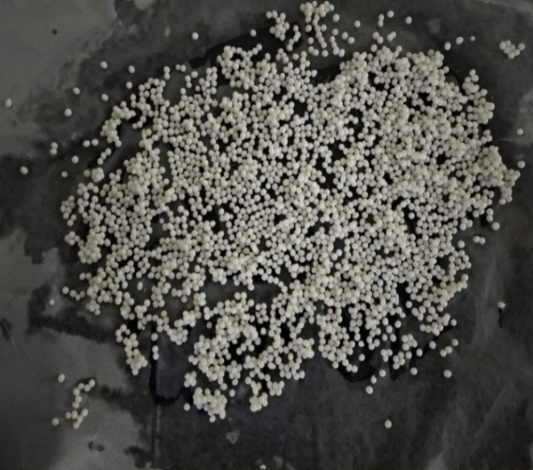
Figure 6: Filtered Vildagliptin sustained release microspheres
Drying:
The filtered microspheres were placed on the glycerine applied butter paper and dried in the hot air oven for 2 hours at 60 degrees Celsius and air dried for 24hours. Dried microspheres were filled in the capsules.
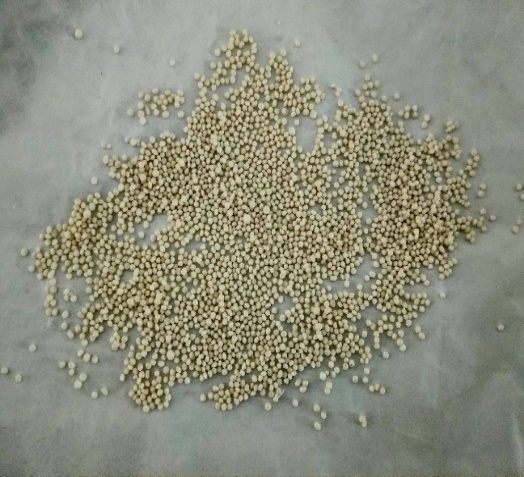
Figure 7: Dried Vildagliptin sustained release microspheres
2.2.4 Evaluation of Vildagliptin sustained release microspheres:
1: Physical appearance:
The colour, shape, odour and surface of the obtained microspheres were observed physically.
2: Percentage yield:
Percentage yield = practical yield/theoretical yield * 100
3: Flow properties:
Angle of repose:
Bulk density:
Tapped density:
Carr’s compressibility index:
Hausner’s ratio:
4: Swelling index:
In 10ml of pH 7.4 buffer 100mg of microspheres were added. After 2 hours filtered them and again checked the weight. Calculated the swelling index using the formula.
Swelling index = final weight of microspheres – initial weight of microspheres/ initial weight of microspheres* 100.
The high swelling index indicates the controlled / sustained release mechanism. The compound which absorbs the much fluid will swell more and releases the drug in a controlled manner. The compound which doesn’t absorb much fluid and swell less leads to immediate release of the drug.
5: Drug content:
Weighed 50mg of dried microspheres, crushed and added to the 100ml of pH 7.4 buffer. Left it for 24 hours. Next day kept the solution on magnetic stirrer for 15 minutes, filtered and the filtrate is observed under the UV visible spectrophotometer. In the same way took 25.5mg of Vildagliptin in 100ml of buffer and analysed using UV and the obtained responses were used in the calculation. Based on the drug content microspheres were filled in the hard gelatine capsules.
Sample response/standard response * standard dilution * sample dilution* average weight.
6: Entrapment efficiency:
% Drug entrapment efficiency = Actual drug content in the formulation / Theoretical drug content of the formulation*100 (Peeriga, 2024)
7: Invitro dissolution studies:
Used USP Type II (paddle) dissolution apparatus for invitro dissolution studies. Dissolution baskets were filled with pH 7.4 buffer up to 900ml and gave the program. According to the drug content the capsules were filled with the microspheres; after reaching the certain required temperature, each capsule was added to each basket. At different time intervals the samples were collected such as for every 1 hour up to 12 hours, replaced with the same amount of buffer and analysed under UV visible spectrophotometer.
8: Particle size analysis:
Particle size of microspheres was analysed by optical stage microscope. Particle size analysis for all six formulations (F1–F6) was carried out using an optical microscope. Initially, the eyepiece micrometre was calibrated with a stage micrometre. A small amount of microspheres was carefully placed on a clean glass slide using a fine brush, then covered with a cover slip. The sample was examined under 10X magnification.
Average particle diameter = Σ(nd) / Σn
Where n represents the number of particles within a specific size range, and d is the diameter of particles in that range, Σn indicates the total no of particles. (Arshad Bashir Khan, october 2013)
3. RESULTS AND DISCUSSION:
UV visible absorption spectrum of Vildagliptin:
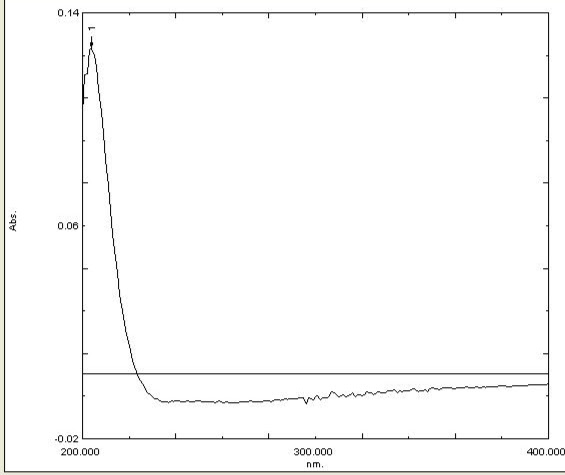
Figure 8: Absorption spectrum of Vildagliptin.
The maximum absorbance of Vildagliptin in pH 7.4 was observed at wavelength 206nm.
The calibration curve was obtained through the UV visible spectrophotometer by the photometric method
Table 2: Concentration vs absorbance table
|
Sample ID |
Concentration (ppm) |
Absorbance n=3 |
|
10ppm |
10 |
0.149 ± 0.0195 |
|
20ppm |
20 |
0.258 ± 0.0182 |
|
30ppm |
30 |
0.352 ± 0.0236 |
|
40ppm |
40 |
0.461 ± 0.0184 |
|
50ppm |
50 |
0.535 ± 0.0192 |
|
60ppm |
60 |
0.601 ± 0.0215 |
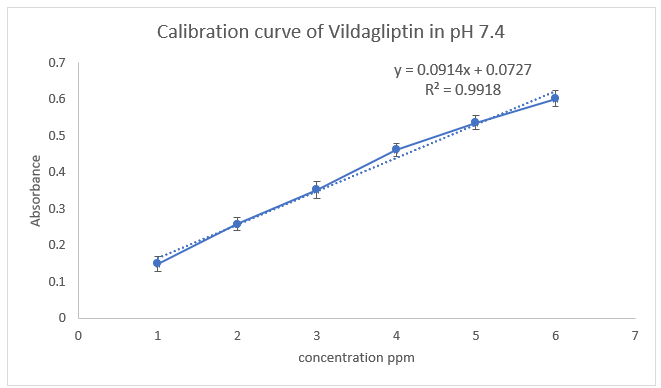
Figure 9: Graphical representation of Calibration curve of Vildagliptin in pH 7.4 buffer
Organoleptic properties:
Table 3: Organoleptic properties of all formulations
|
Formulation |
Shape |
Colour |
Odour |
Surface |
|
F1 |
Spherical |
Pale Yellow |
Odour less |
Smooth |
|
F2 |
Spherical |
Pale Yellow |
Odour less |
Smooth |
|
F3 |
Spherical |
Pale Yellow |
Odour less |
Smooth |
|
F4 |
Irregular |
Pale Yellow |
Odour less |
Smooth |
|
F5 |
Spherical |
Pale Yellow |
Odour less |
Smooth |
|
F6 |
spherical |
Pale Yellow |
Odour less |
Smooth |
Flow properties of microspheres:
Table 4: Flow properties of Vildagliptin sustained release microspheres
|
Formulation |
Angle of repose |
Hausner’s ratio |
Carr’s index |
Bulk density gm/ml |
Tapped density gm/ml |
|
F1 |
38.5° (fair) |
1.27 (passable) |
21.49 (passable) |
0.358 |
0.456 |
|
F2 |
28.7° (excellent) |
1.09 (excellent) |
8.69 (excellent) |
0.63 |
0.69 |
|
F3 |
34.6° (good) |
1.16 (good) |
13.8 (good) |
0.56 |
0.65 |
|
F4 |
31.8° (good) |
1.22 (fair) |
18.453 (fair) |
0.464 |
0.569 |
|
F5 |
32.7° (good) |
1.26 (passable) |
21.01 (passable) |
0.381 |
0.482 |
|
F6 |
26.57°(Excellent) |
1.13 (Good) |
11.58 (Good) |
0.74 |
0.837 |
Drug excipient compatibility studies by FTIR:
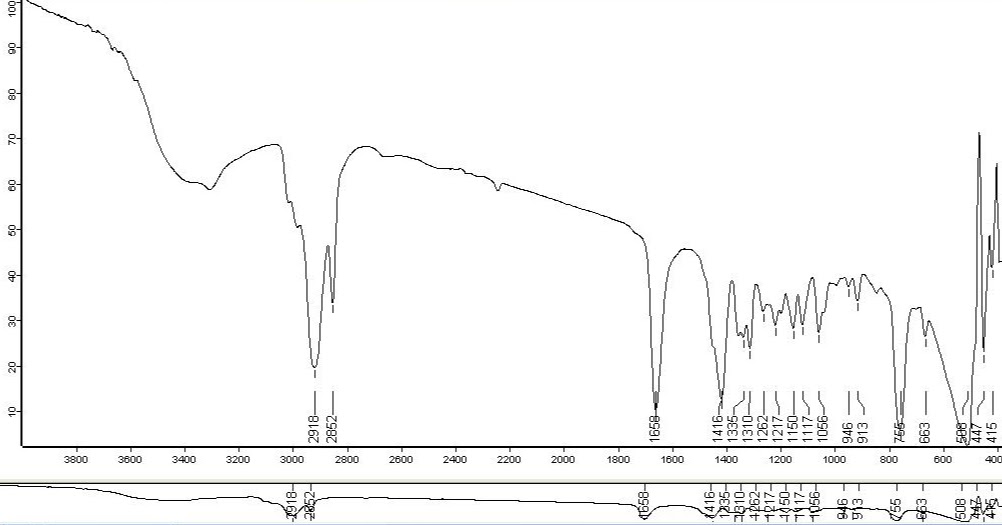
Figure 10: IR Spectra of Vildagliptin API
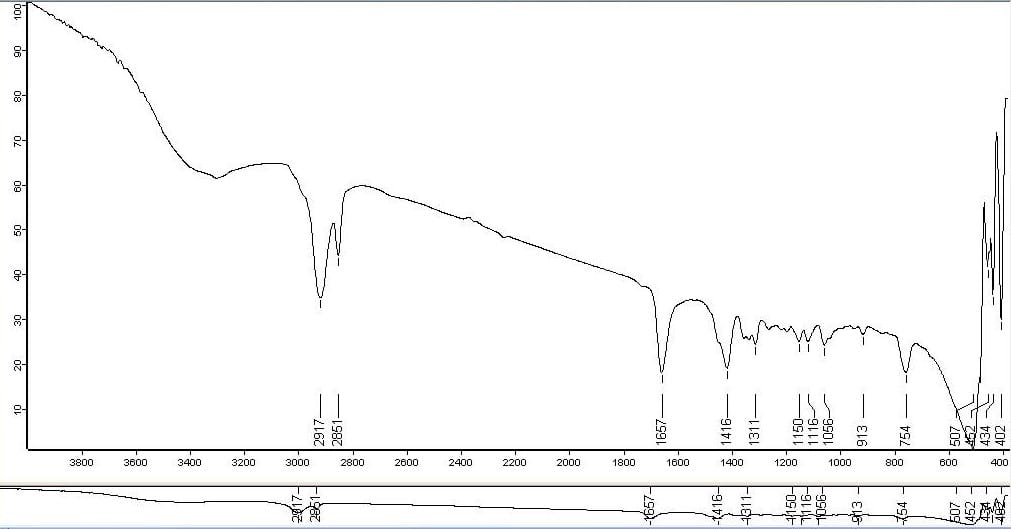
Figure 11: IR Spectra of Optimized Formulation F6
Table 5: Comparison between the peaks of Vildagliptin (API) and Optimized formulation F6
|
Peaks cm-1 of Vildagliptin (API) |
Peaks cm-1 of Optimized Formulation F6 |
Description |
|
2918 |
2917 |
C-H stretching |
|
2852 |
2851 |
C-H stretching |
|
1658 |
1657 |
C=O Stretching |
|
1416 |
1416 |
C-N Stretching |
|
1310 |
1311 |
C-N Stretching |
|
1056 |
1056 |
C-N/C-O Stretching |
|
755 |
754 |
C-H Bending |
The FTIR spectra of Vildagliptin (API) and Formulation (F6) were compared. The characteristic peaks of the API were observed in the formulation with only minor shifts in wavenumber. No significant disappearance of functional group peaks was noted. These results confirm that there is no major drug-excipient interaction, and the API remains stable in the formulation.
Table 6: Swelling index, percentage yield, entrapment efficiency, drug content of six formulations
|
Formulation |
Swelling index |
Percentage yield |
Entrapment efficiency (%) |
Drug content (%) (Dose:200mg) |
|
F1 |
17 ± 0.15 |
70.38 ± 0.26 |
58 ± 0.46 |
63.24 ± 0.72 |
|
F2 |
35 ± 0.26 |
85.78 ± 0.43 |
77 ± 0.38 |
82.36 ± 0.63 |
|
F3 |
119 ± 0.18 |
76.89 ± 0.12 |
64 ± 0.61 |
54.32 ± 0.58 |
|
F4 |
20 ± 0.19 |
72.39 ± 0.47 |
40 ± 0.56 |
59.47 ± 0.66 |
|
F5 |
98 ± 0.24 |
80.63 ± 0.28 |
75 ± 0.42 |
90.26 ± 0.47 |
|
F6 |
101 ± 0.14 |
81.63 ± 0.24 |
79 ± 0.37 |
94.17 ± 0.51 |
Table 7: Particle size analysis of six formulations
|
Formulation |
Particle size (µm) |
|
F1 |
245 ± 0.12 |
|
F2 |
540 ± 0.26 |
|
F3 |
625 ± 0.18 |
|
F4 |
567 ± 0.37 |
|
F5 |
832 ± 0.42 |
|
F6 |
984 ± 0.39 |
Dissolution:
Table 8: Dissolution profile of six formulations
|
Time (hrs) |
F1 (% CDR) |
F2 (%CDR) |
F3 (%CDR) |
F4 (% CDR) |
F5 (%CDR) |
F6 (% CDR) |
|
0 |
0 |
0 |
0 |
0 |
0 |
0 |
|
1 |
20.35±0.01 |
18.76±0.09 |
34.27±1.24 |
27.43±0.06 |
16.48±0.15 |
14.01±0.04 |
|
2 |
35.53±0.02 |
25.63±0.08 |
56.29±2.36 |
37.64±0.08 |
28.71±0.19 |
23.37±0.09 |
|
3 |
46.58±0.01 |
33.44±0.09 |
65.75±1.56 |
43.89±0.06 |
36.84±0.24 |
30.22±0.06 |
|
4 |
57.41±0.03 |
38.51±0.05 |
87.23±2.78 |
56.78±0.08 |
48.27±0.28 |
33.73±0.09 |
|
5 |
83.20±0.01 |
49.15±0.09 |
98.47±2.86 |
79.18±0.05 |
57.48±0.17 |
40.26±0.06 |
|
6 |
97.47±0.04 |
66.74±0.04 |
|
92.46±0.08 |
79.43±0.37 |
46.36±0.06 |
|
8 |
|
95.57±0.08 |
|
|
84.32±0.12 |
62.28±0.09 |
|
10 |
|
|
|
|
99.76±0.20 |
77.89±0.04 |
|
12 |
|
|
|
|
|
96.75±0.09 |
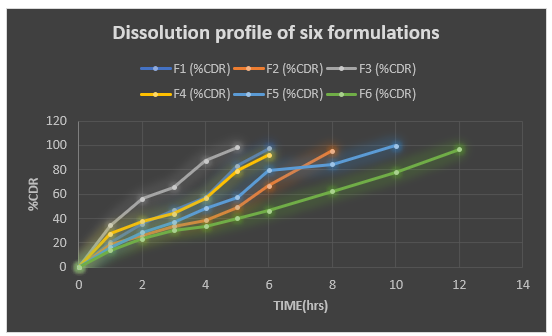
Figure 12: Dissolution profile of Six formulations. % CDR of F6 at 12 Hours is found to be 96.75%.
4. Release kinetics of optimum formulation F6
Table 9: Zero order Kinetics of Formulation F6
|
Time (hours) |
%CDR |
|
0 |
0 |
|
1 |
14.01 |
|
2 |
23.37 |
|
3 |
30.22 |
|
4 |
33.73 |
|
5 |
40.26 |
|
6 |
46.36 |
|
8 |
62.28 |
|
10 |
77.89 |
|
12 |
96.75 |
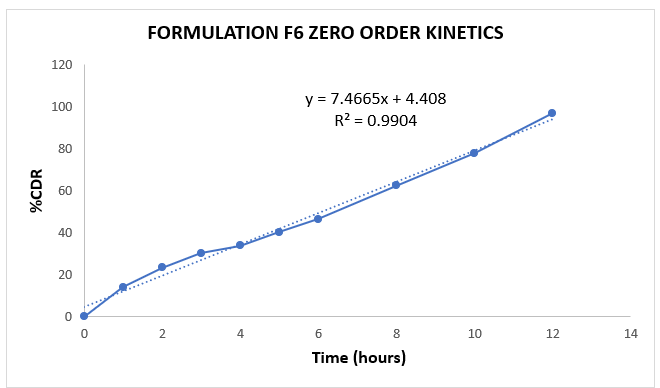
Figure 13: Graphical representation of Zero order kinetics of Formulation F6
Table 10: First order Kinetics of Formulation F6
|
Time (hours) |
Log % drug remaining |
|
0 |
0 |
|
1 |
1.93 |
|
2 |
1.88 |
|
3 |
1.84 |
|
4 |
1.82 |
|
5 |
1.77 |
|
6 |
1.72 |
|
7 |
1.57 |
|
10 |
1.34 |
|
12 |
0.51 |
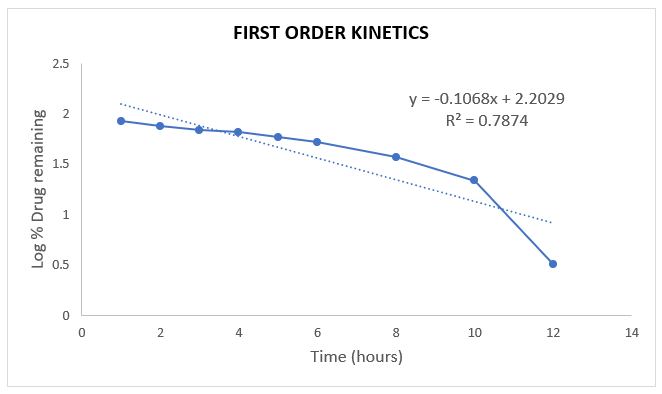
Figure 14: Graphical representation of First order Kinetics of Formulation F6
Table 11: Higuchi model of Formulation F6
|
√T |
%CDR |
|
0 |
0 |
|
1 |
14.01 |
|
2 |
23.37 |
|
3 |
30.22 |
|
4 |
33.73 |
|
5 |
40.26 |
|
6 |
46.36 |
|
8 |
62.28 |
|
10 |
77.89 |
|
12 |
96.75 |
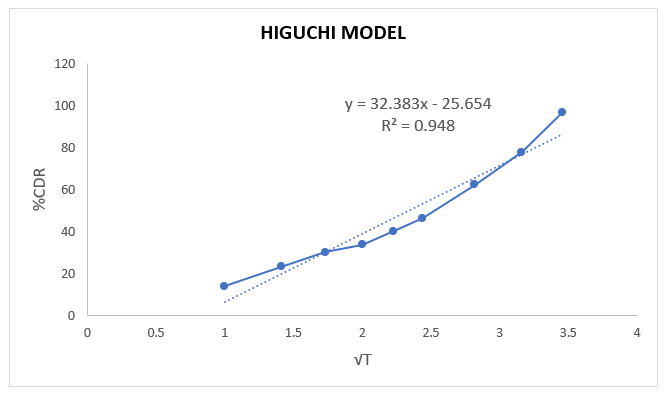
Figure 15: Graphical representation of Higuchi mode of Formulation F6
Table 12: Hixson-Crowell model of Formulation F6
|
Time (hours) |
Q01/3-Qt1/3 |
|
0 |
0 |
|
1 |
4.41 |
|
2 |
4.24 |
|
3 |
4.11 |
|
4 |
4.04 |
|
5 |
3.90 |
|
6 |
3.77 |
|
8 |
3.35 |
|
10 |
2.80 |
|
12 |
1.48 |
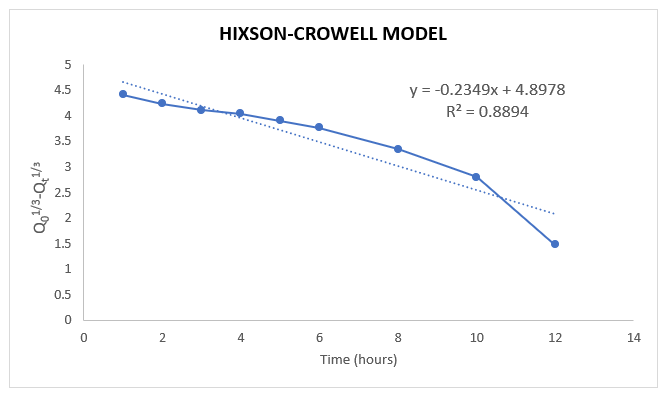
Figure 16: Graphical representation of Hixson-Crowell model of Formulation F6
Table 13: Korsmeyer-Peppas model of Formulation F6
|
Log time |
Log % CDR |
|
0 |
0 |
|
0 |
1.14 |
|
0.30 |
1.36 |
|
0.47 |
1.48 |
|
0.60 |
1.52 |
|
0.69 |
1.60 |
|
0.77 |
1.66 |
|
0.90 |
1.79 |
|
1 |
1.89 |
|
1.07 |
1.98 |
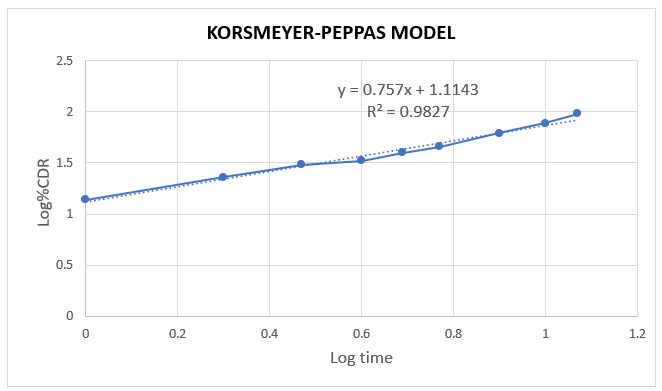
Figure 17: Graphical representation of Korsemeyer-peppas model of Formulation F6
Stability studies:
Optimized formula F6, after 3 months storage period there is no much variation in the physical appearance like shape and colour.
Table 14: Swelling index & drug content of optimized formulation after stability studies
|
Evaluation tests |
Before |
After 3 months |
|
Swelling index (%) |
101 ± 0.14 |
98 ± 0.16 |
|
Drug content |
96.52 ± 0.51 |
95.36 ± 0.32 |
Table 15: Dissolution profile of optimized formulation after stability studies
|
Time (hrs) |
% CDR of optimized formulation F6 |
|
|
Before |
After 3 Months |
|
|
0 |
0 |
0 |
|
1 |
14.13 ± 0.026 |
18.95 ± 0.036 |
|
2 |
23.37 ± 0.019 |
25.43 ± 0.012 |
|
3 |
30.22 ± 0.014 |
31.58 ± 0.016 |
|
4 |
33.73 ± 0.018 |
38.62 ± 0.014 |
|
5 |
40.26 ± 0.021 |
44.98 ± 0.028 |
|
6 |
46.36 ± 0.017 |
58.74 ± 0.024 |
|
8 |
62.28 ± 0.012 |
67.86 ± 0.036 |
|
10 |
77.89 ± 0.014 |
82.72 ± 0.028 |
|
12 |
96.75 ± 0.013 |
98.48 ± 0.022 |
SUMMARY & CONCLUSION:
Sustained release Vildagliptin microspheres were successfully prepared and evaluated. F6 is found to be the optimum formulation it has shown the drug content of 94.17%, %CDR at 12th hour is found to be 96.75% that indicates it has followed the sustained release mechanism. Formulation F3 has shown the highest swelling index of 119%. Release kinetic studies provided the information that these sustained release Vildagliptin microspheres were following zero order kinetics and non-Fickian diffusion model of drug release. Through FTIR studies Drug-excipient compatibility was confirmed major peaks were found to be intact.
Compliance with ethical standards
ACKNOWLEDGEMENTS
I would like to express the sincere gratitude to Dr. M. Sunitha Reddy and Dr. K. Anie Vijetha for their valuable guidance and support and JNTUH University college of engineering, science and technology Hyderabad for providing the laboratory facilities required to carry out this research work.
Disclosure of Conflict of Interest
All the authors declare no conflict of interest.
REFERENCES

Marela Harisri*, Dr. M. Sunitha Reddy, Dr. K. Anie Vijetha, Formulation and Evaluation of Vildagliptin Sustained Release Microspheres, Int. J. of Pharm. Sci., 2025, Vol 3, Issue 9, 260-275 https://doi.org/10.5281/zenodo.17043130
 10.5281/zenodo.17043130
