Bhupal Noble’s Institute of Pharmaceutical Sciences, Bhupal Noble’s University, Udaipur, Rajasthan, India
Posaconazole (POS) is a widely utilized antifungal medication for the treatment of fungal infections. It falls under the triazole class of drugs. The bioavailability of Posaconazole experiences a significant decrease due to its low solubility in water (less than 1 g/ml) and substantial metabolism in the liver during the first pass. The development of effective pharmacological formulations poses a significant challenge, as instability or reduced solubility in the medium can greatly diminish pharmacological efficacy. Among the most advanced methods for improving the bioavailability and solubility of Posaconazole is the nano-emulgel drug delivery system. The aim of the study is to create a posaconazole-loaded nanoemulsion based gel for topical application, which will provide sustained release of the drug, enhance patient compliance, and eliminate the need for frequent administration.
Posaconazole (POS) is a widely utilized antifungal medication for the treatment of fungal infections. It falls under the triazole class of drugs. Studies have shown that Posaconazole effectively inhibits sterol C-14 demethylation by fungi cytochrome P-450. The bioavailability of Posaconazole experiences a significant decrease due to its low solubility in water (less than 1 g/ml) and substantial metabolism in the liver during the first pass. Recent research in pharmaceutical technology has been focused on novel drug delivery systems (NDDS) as they hold the potential to enhance the effectiveness of future treatments. Nanoemulgel, with its remarkable solubilizing properties, is being utilized as a new dosage formulation for various drugs that are either oil- or water-soluble. The development of effective pharmacological formulations poses a significant challenge, as instability or reduced solubility in the medium can greatly diminish pharmacological efficacy. Among the most advanced methods for improving the bioavailability and solubility of lipophilic medications is the nano-emulgel drug delivery system. Nano-emulgel, also referred to as nano-sized emulsions, serves as a drug carrier to enhance the body's absorption of the medication. Through the fusion of a water-insoluble oil phase and a highly stressed aqueous phase, these emulsions can be produced in large quantities with minimal difficulty. Lipids, surfactants, co-surfactants, and co-solvents are the essential ingredients employed in their creation [1-2].
Objective of this study is to formulate a nanoemulsion of posaconazole in order to enhance its solubility. Additionally, the study aims to create a posaconazole-loaded nanoemulsion based gel for topical application, which will provide sustained release of the drug, enhance patient compliance, and eliminate the need for frequent administration.
MATERIALS AND METHODS
2.1 Materials
Posaconazole source from Neuland Laboratories, Hyderabad, Phospholipid source from Lipoid GmbH, Germany, Methanol and Isopropyl alcohol source from Fisher Scientific India Pvt. Ltd., Potassium Dihydrogen orthophosphate and Disodium hydrogen orthophosphate source from Thomas Baker, HCl and n-octanol source from SD Fine-chem. Ltd, Mumbai, Chloroform, DCM and Acetone source from Fisher Scientific India Pvt. Ltd.
2.2 Melting point of Posaconazole
The USP method was utilized to determine the melting point. A small amount of Posaconazole was carefully inserted into a sealed capillary tube, which was then positioned in the melting point apparatus. The temperature within the apparatus was slowly raised, and the point at which Posaconazole began to melt, as well as the temperature at which the entire substance melted, were both recorded. This technique is commonly referred to as the capillary method. [3].
2.3 UV spectrum of Posaconazole
The λ max of the drug was determined using a Double beam UV-visible spectrophotometer (Shimadzu, UV-1800, Japan). A solution containing 30 µg/ml of Posaconazole in methanol was scanned within the wavelength range of 200-400nm, revealing a λ max value of 264nm.
2.4 Estimation of Posaconazole by UV-visible spectrophotometer
The methanol solution was used to prepare the standard curve for Posaconazole. Initially, 10 mg of Posaconazole was dissolved in 100 ml of methanol to create the stock solution. Subsequently, dilutions were made from the stock solution, ranging from 5-30µg/ml. The absorbance of these solutions was measured at 264 nm using a UV-visible spectrophotometer, with methanol serving as the blank. The concentration of Posaconazole was plotted against the standard curve, allowing for the determination of the intercept, slope, straight line equation, and correlation coefficient. [4].
2.5. Solubility studies of Posaconazole in oils, surfactant and Co-surfactant
The solubility of Posaconazole in different oils, surfactant, and co-surfactant was assessed by adding 10mg of Posaconazole to 3mL of the selected oils, surfactant, and co-surfactant (Oleic acid, Labrafil M2125CS, Capmul PG-8NF, Tween 80, Tween 20, Transcutol HP, PEG 200, PEG 400, Propylene Glycol) individually in 5 mL stopper vials. The mixture was then thoroughly mixed using a vortex mixer. Subsequently, the vials were placed in a thermal shaker set at 25 ± 1.0°C for 72 hours to achieve equilibrium. After equilibration, the samples were taken out from the shaker and centrifuged at 3000 rpm for 15 minutes. The resulting supernatant was filtered through a 0.45 µm membrane filter. The concentration of Posaconazole in the oils, surfactant, and co-surfactant was determined using UV Spectroscopy within the range of (λmax= 264 nm). [5].
2.6 Optimization of nano-emulsion formulation
Based on the results of Posaconazole solubility results, the oil, surfactant and co-sufactant with the highest solubilization capacity for posaconazole was chosen.
For optimization of nanoemulsion formulation to generate ternary phase diagram different composition of oil, surfactant and co-surfactant were tested. This evaluation involved conducting a screening procedure to determine their potential to form a nano-emulsion. Subsequently, the impact of different components on the emulsifying ability was investigated. [6-7].
2.7 Construction of Ternary phase diagram
Posaconazole: oil was chosen as the oil phase based on solubility studies. As for the surfactant and co-surfactant, Tween 80 and Transcutol HP were selected, respectively. Water was utilized as the aqueous phase. To determine the existence zone of the nanoemulsion, pseudo ternary phase diagrams were created using the water titration method, also known as the spontaneous emulsification method. The surfactant and co-surfactant (S mix) were mixed in different weight ratios, specifically 1:1 and 2:1. These Smix ratios were selected in increasing concentrations of the co-surfactant relative to the surfactant. Each phase diagram involved thorough mixing of the oil and specific Smix in various ratios. [8].
2.8. Preparation of nanoemulsion
Posaconazole was incorporated into the oil, surfactant, and cosurfactant mixture with different ratios obtained from pseudo-ternary phase diagrams outlined in Table 5.9. The mixture was preheated to 75?C and vortexed for 5 minutes until the drug was completely dissolved. Subsequently, the aqueous phase was slowly added to the oil phase and vortexed for 2 minutes. A 100 mg sample was withdrawn from the total mixture and mixed with 5 ml of distilled water. The nanoemulsion containing posaconazole was formed by stirring the mixtures at room temperature. Formulations C1, C7, C9 and C10 from the pseudo-ternary phase were chosen for various physical stability tests. [9].
2.9.1 Physical stability of nanoemulsion [10-11]
2.9.1 Heating-Cooling Cycle: The stability of the nanoemulsion was assessed by subjecting it to different temperatures (4°C and 45°C) for a maximum duration of 48 hours. This experiment aimed to investigate the impact of temperature fluctuations on the nanoemulsion.
2.9.2. Centrifugation Study: The Posaconazole nanoemulsion underwent centrifugation at a speed of 5000 rpm for a duration of 30 minutes in order to identify any signs of creaming, cracking, or phase separation. It is important to note that all measurements were conducted in triplicate.
2.9.3 Freeze Thaw Cycle: The dispersibility efficiency of Posaconazole nanoemulsion was evaluated by subjecting it to three freeze-thaw cycles, with temperatures ranging from -21°C to +25°C. The nanoemulsion was stored at each temperature for a minimum of 48 hours to assess its performance.
2.10. Characterization of nanoemulsion [12-13]
2.10.1 Appearance
The nanoemulsion formulation was analyzed through visual observation to complete the task.
2.10.2. Determination of Emulsification
The emulsification process involved the addition of 0.3 ml of self-emulsifying drug formulations to a beaker containing 200 ml of methanol at a temperature of 37°C. The mixture was then stirred and visually observed to determine the duration required for complete emulsification.
2.10.3 pH determination
A single gram of nanoemulsion was dispersed within 100 milliliters of distilled water, and the pH was determined through the use of a pH meter. The gel was brought into contact with the solution and allowed to equilibrate for a duration of 1 minute. The pH measurements were conducted three times, and the average values were subsequently calculated.
2.10.4 Drug content
To obtain clear solutions, 100 mg of the posaconazole NE was dissolved in 10 mL of methanol and sonicated for 1 minute. The resulting solutions were then centrifuged at 10000 rpm for 30 minutes. The drug content was estimated by analyzing the extract spectrophotometrically at a wavelength of 264 nm, using methanol as a blank.
2.10.5 % Transmittance
The spectro photometric determination of the percentage transmittance for the prepared nanoemulsion formulations was conducted using the Shimadzu UV–VIS spectrophotometer. To perform the analysis, 1 mL of the formulation was diluted 100-fold with distilled water and examined at a wavelength of 264 nm.
2.11 Percentage drug loading
The quantity of posaconazole encapsulated in the oil, surfactant, and cosurfactant was utilized to determine the drug loading of the nanoemulsion. 1 mL of Posaconazole NE was mixed with 100 ml of methanol to assess the drug loading of Posaconazole in the nanoemulsion. The NE underwent centrifugation at 15,000 rpm for 15 minutes. Subsequent to centrifugation, the supernatant was collected, and spectrophotometric analysis was employed to calculate the percentage drug loading of free Posaconazole (λmax= 264 nm).
2.12. Transmission Electron Microscopy (TEM) Analysis
The morphological characterization and visualization of emulsion droplets in the nanoemulsion were conducted through TEM analysis. To achieve this, the nanoemulsion formulation was diluted using deionized water and mixed gently by shaking. After dilution, a small amount of the sample was placed on copper grids. These grids were then stained with a 1% phosphotungstic acid solution for a duration of 30 seconds. Finally, the grids were observed under an electron microscope to visualize the particle morphology.
2.13. Particle size and Zeta Potential
The nanoemulsion's particle size (PS) and zeta potential were analyzed using photon correlation spectroscopy and electrophoretic mobility, respectively, with a Zeta-sizer Nano instrument. The emulsion was diluted 100 times, then introduced into the sample cell and placed in the sample holder unit for determination of zeta potential and particle size, respectively. [14-15].
2.14. Preparation of Hydrogel
The hydrogel was formulated through the dispersion of 1gm of Carbopol 934 in a nanoemulsion. Following complete dispersion, the solution was left to stand for 24 hours to allow for the full swelling of Carbopol 934. Triethanolamine was introduced for crosslinking purposes. A clear and transparent 1% gel of Carbopol 934 was successfully produced. [16-17].
2.15 Characterization of Hydrogel
The optimization of nanoemulsion based gel involved the evaluation of the following parameters.
2.15.1 Physical Appearance
The gel formulation was analyzed through visual observation to complete the task.
2.15.2 pH determination
The digital pH meter was utilized to determine the pH of gel formulations. To achieve this, one gram of gel was dispersed in 100 ml of distilled water. The pH meter was then brought into contact with the gel and allowed to equilibrate for 1 minute, after which the pH was recorded. The pH measurement was conducted three times, and the average values were calculated. [18].
2.15.3 Measurement of gel viscosity
The rheological studies involved the utilization of the Visco QC100 viscometer. A gel sample weighing 30 g was placed in a beaker and allowed to acclimate for five minutes at a speed of 10 rpm and a temperature of 25°C. Subsequently, the dial reading was measured using a T-4 spindle rotating at a speed of five revolutions per minute. The viscometer's dial reading was carefully noted at this speed. Furthermore, the dial reading corresponding to each decrease in spindle speed was recorded. To ensure accuracy, each measurement was repeated three times, and the average value along with the standard deviation (± SD) was reported. [19].
2.15.4 Drug content
In order to analyze the drug content, 100mg of gel was combined with 10 ml of methanol and sonicated for 1 minute to achieve clear solutions. The resulting solutions were then centrifuged at 10000 rpm for 15 minutes. By utilizing methanol as a blank, the drug content was determined using a UV spectrophotometer at the λ-max of 264nm. [20].
2.15.5 Spreadability Test
The spreadability of gel was measured using a laboratory device consisting of two glass slides. The lower slide was connected to a wooden plate, while the upper slide was attached to a balance through a hook. In this experiment, 1 gram of gel was placed on the lower slide, while the upper slide received a certain weight. As the weight was applied, the upper slide moved in a linear direction towards the weight. The time taken for the upper slide to completely displace was recorded. [21].
2.16. FTIR of Optimized Formulation
The FTIR spectroscopy was utilized to measure the FTIR spectrum of the optimized formulation.
2.17. In vitro release
The investigation was conducted utilizing a Franz diffusion cell apparatus with a dialysis membrane. To prevent pore blockage, the membrane was immersed in a 40% ethanol solution overnight. Subsequently, the treated membrane was positioned between the donor and acceptor compartments of the diffusion cell. Posaconazole loaded hydrogel (C7G2) and Control gel, each weighing 1gm, were applied to the treated membrane. The receptor compartment of the diffusion cell was filled with 7.4 pH phosphate buffers. The entire setup was placed on a magnetic stirrer, with the solution in the receptor compartment being stirred continuously at 100 rpm using magnetic beads. The temperature was maintained at 37±0.50°C. Samples of 2 ml were collected at time intervals of 0.25, 0.5, 1, 2, 3, 4, 6, 8, 10, and 12 hours for drug analysis using UV method. The receptor phase was replenished with an equal volume of 7.4 pH phosphate buffer each time a sample was withdrawn. [22].
2.18. Drug release kinetics [23-26]
Model-specific techniques relied on various mathematical functions to characterize the release profile. After choosing an appropriate function, the release profiles were assessed based on the model parameters derived. The results from ex vivo permeation studies were analyzed using various data treatment models.
2.18.1 Zero order kinetics
The drug dissolution of various types of modified release pharmaceutical dosage forms can be described using it. This includes transdermal systems, matrix tablets with low soluble drugs in coated forms, osmotic systems, and more. The concept of zero order release can be represented in its simplest form as: Q0 - Qt = K0t. In this equation, Qt represents the amount of drug dissolved in time t, Q0 is the initial amount of drug in the solution (often Q0=0), and K0 is the zero order release constant expressed in units of concentration/time. To analyze the release kinetics, data obtained from in vitro drug permeation studies are plotted as cumulative amount of drug released versus time.
2.18.2 First order kinetics
The drug dissolution in pharmaceutical dosage forms, particularly those with water-soluble drugs in porous matrices, can be described using this equation:
Log C = log C0– K.t / 2.303
Here, C0 represents the initial concentration of the drug, k is the first order rate constant, and t is the time. By plotting the data as log cumulative percentage of drug remaining against time, a straight line with a slope of K/2.303 can be obtained.
2.18.3 Higuchi’s Model
The drug release from a matrix system was anticipated to be determined by this particular model. Initially designed for planar systems, it was subsequently expanded to encompass various geometries and porous systems. This model was established on several hypotheses: (i) the initial drug concentration in the matrix exceeded the drug solubility by a significant margin, (ii) drug diffusion occurred solely in one dimension with the edge effect being negligible, (iii) the drug particles were considerably smaller than the thickness of the system, (iv) the swelling and dissolution of the matrix were insignificant, (v) the drug's diffusivity remained constant, and (vi) the release environment consistently achieved perfect sink conditions.
2.18.4 Korsmeyer-Peppas Model
Korsmeyer established a basic correlation to explain the release of drugs from a polymeric system. The release patterns from controlled release polymeric matrices can be elucidated using the formula proposed by Korsmeyer et al. expressed as Q = K.tn. In this equation, Q represents the percentage of drug released at a specific time 't', K denotes a kinetic constant that considers the structural and geometric properties of the tablets, and 'n' signifies the diffusional exponent that reflects the release mechanism. For Fickian release, the value of n is 0.45, whereas for anomalous (Non-Fickian) transport, n falls within the range of 0.45 to 0.89. In the case of zero-order release, n equals 0.89. The Korsmeyer-Peppas model involves plotting log cumulative % drug releases against log time.
RESULT AND DISCUSSION
3.1 Melting point
The melting point range of Posaconazole was determined to be between 169.33±1.53 and 171.33±2.08°C and Reference melting point is 170-172°C this indicating the absence of impurities in the drug sample.
3.2 Determination of absorption maxima by UV spectroscopy
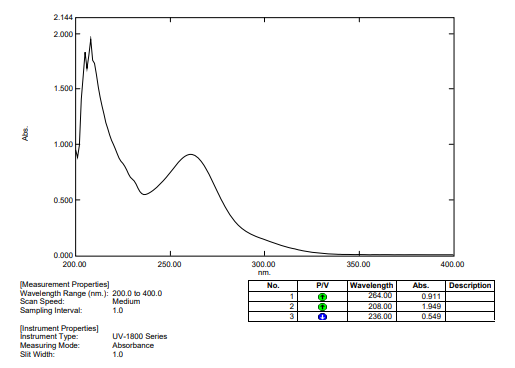
Figure 1: UV spectrum of Posaconazole
Discussion: The reference standard is 264 nm, indicated that the maximum wavelength of Posaconazole was observed at 264 nm, which coincided with the findings.
3.3 Preparation of calibration curve of Posaconazole in methanol
The Posaconazole stock solution (100µg/ml) was initially prepared using methanol. Subsequently, this solution underwent dilution with methanol to achieve appropriate concentrations (5-30µg/ml) for spectrophotometric analysis at 264nm. The outcomes of the analysis are represented in Figure 9.2.
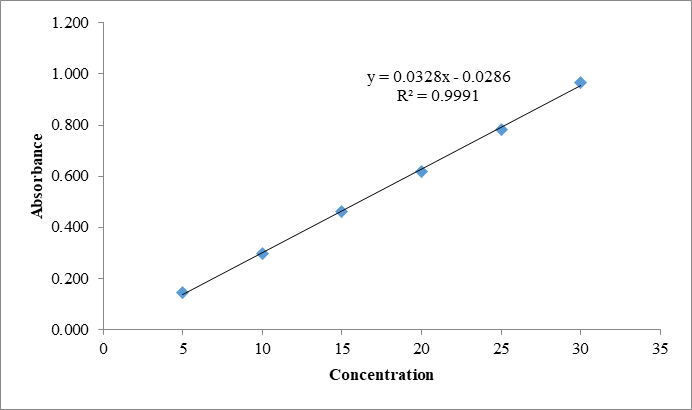
Figure 2: Calibration curve of Posaconazole in methanol
Discussion: The concentration range of Posaconazole in methanol used to obtain the calibration curve was 5 to 30µg/ml. The absorbance was measured at 264nm. The graph displaying the standard curve of Posaconazole indicated a regression equation of y= 0.0328x-0.0286 and an R2 value of 0.999, demonstrating excellent linearity.
3.4. Solubility studies of Posaconazole for different Oil, surfactant and co-surfactant
|
S.No. |
Name of oil |
Solubility (mg/ml) |
|
1. |
Oleic acid (Oil) |
7.142±0.093 |
|
2. |
Labrafil M2125CS (Oil |
4.908±0.032 |
|
3. |
Capmul Pg8nf (Oil) |
2.002±0.008 |
|
4. |
Tween 80 (Surfactant) |
8.912±0.030 |
|
5. |
Tween 20 (Surfactant) |
5.365±0.032 |
|
6. |
Transcutol HP |
8.109±0.023 |
|
7. |
PEG 400 |
5.526±0.063 |
|
8. |
PEG 200 |
3.373±0.032 |
|
9. |
Propyelne glycol |
1.014±0.004 |
Table 1: Different oils, surfactant and co-surfactant were used to conduct solubility studies of Posaconazole.
Discussion:
Solubility studies of oil was found that Posaconazole had more affinity toward Oleic acid >Labrafil M2125CS > Capmul Pg8nf. Solubility investigations of Posaconazole in surfactants was found the Posaconazole had more affinity toward Tween 80>Tween 20. Solubility studies of Posaconazole in different Co-surfactant was found the Posaconazole had more affinity toward Transcutol HP> PEG 400> PEG 200> Propylene glycol.
3.4 Phase studies
3.4.1 Phase studies of Oleic acid + Tween 80 + PEG 400 [1:1, 2:1]
During the screening studies, it was noted that two combinations consisting of three different Co-surfactants and surfactants with the same oil combination exhibited very similar % transmittance values. Consequently, it was essential to determine the ultimate combination by constructing a pseudo-ternary phase diagram. This diagram will highlight the optimal region for nanoemulsion formation, with the final selected combinations maintaining a fixed Smix ratio of 1:1 and 2:1. refer table 2.
|
Formulation Code |
Ratios |
Oleic acid (mg) |
Tween 80 (mg) |
PEG 400 (mg) |
Transmittance (%) (λ=630 nm) |
Appearance |
|
1:1 |
||||||
|
C1 |
1:9 |
96 |
432 |
432 |
98.45±.0.268 |
Clear |
|
C2 |
2:8 |
192 |
384 |
384 |
94.44±.0.220 |
Clear |
|
C3 |
3:7 |
288 |
336 |
336 |
90.48±.0.324 |
Clear |
|
C4 |
4:6 |
384 |
288 |
288 |
75.59±.0.446 |
Turbid |
|
C5 |
5:5 |
480 |
240 |
240 |
65.34±.0.299 |
Turbid |
|
2:1 |
||||||
|
C6 |
1:9 |
96 |
576 |
288 |
90.69±.0.015 |
Clear |
|
C7 |
2:8 |
192 |
512 |
256 |
92.44±.0.384 |
Clear |
|
C8 |
3:7 |
288 |
448 |
224 |
92.58±.0.127 |
Clear |
|
C9 |
4:6 |
384 |
384 |
192 |
76.35±.0.391 |
Turbid |
|
C10 |
5:5 |
480 |
320 |
160 |
70.34±.0.276 |
Turbid |
Table 2: Combination of Oleic acid + Tween 80+ PEG 400 (Surfactant: Cosurfactant [1:1, 2:1]
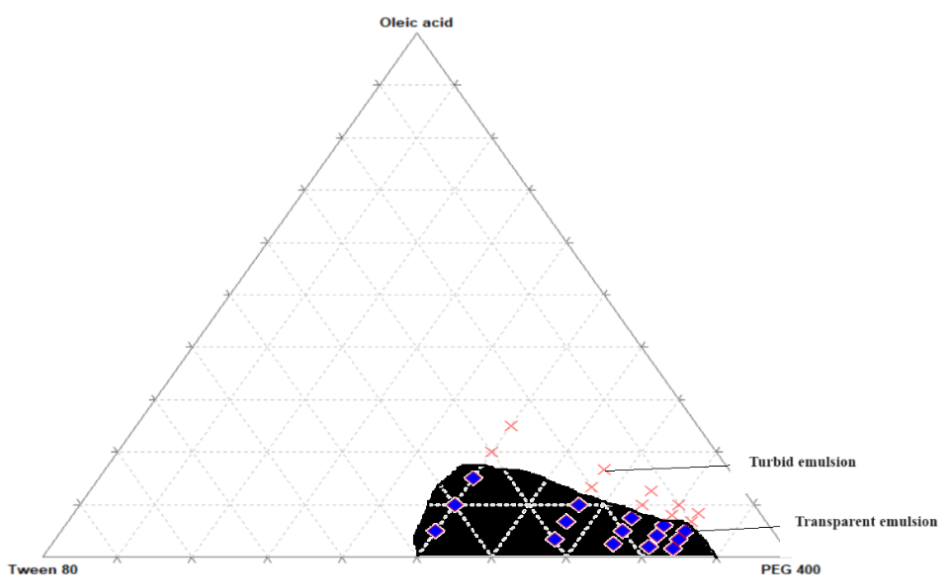
Figure 3: Oleic acid + Tween 80 + PEG 400
Discussion: Based on the information presented in Figure 6.15, one can deduce that the creation of nanoemulsion is influenced by the proportions in which the oil, surfactant, and co-surfactant are introduced. The pseudo-ternary diagram illustrates the specific area (highlighted in black) where the likelihood of nanoemulsion formation was observed in Figure 6.15. Additionally, the red crossed region signifies the turbidity of the emulsion, while the blue dots represent the highly transparent emulsion.
3.4.2 Phase studies of Oleic acid + Tween 80 + Transcutol HP [1:1, 2:1 Ratio]
During the screening studies, it was noted that three combinations consisting of three distinct Co-surfactants and surfactants with the same oil combination exhibited very similar % transmittance. Consequently, it was imperative to determine the ultimate combination by constructing a pseudo-ternary phase diagram. This diagram will highlight the optimal region for nanoemulsion formation, with the final selected combinations maintaining a fixed O: Smix ratio of 1:1 and 2:1, as illustrated in Table 3.
|
Formulation Code |
Ratios |
Oleic acid (mg) |
Tween 80 (mg) |
Transcutol HP (mg) |
Transmittance (%) (λ=630 nm) |
Appearance |
|
1:1 |
||||||
|
C11 |
1:9 |
96 |
432 |
432 |
90.67±.0.230 |
Clear |
|
C12 |
2:8 |
192 |
384 |
384 |
26.34±.0.286 |
Turbid |
|
C13 |
3:7 |
288 |
336 |
336 |
20.38±.0.323 |
Turbid |
|
C14 |
4:6 |
384 |
288 |
288 |
3.74±.0.137 |
Turbid |
|
C15 |
5:5 |
480 |
240 |
240 |
10.17±.0.239 |
Turbid |
|
2:1 |
||||||
|
C16 |
1:9 |
96 |
576 |
288 |
94.30±.0.312 |
Clear |
|
C17 |
2:8 |
192 |
512 |
256 |
90.49±.0.215 |
Clear |
|
C18 |
3:7 |
288 |
448 |
224 |
23.55±.0.291 |
Turbid |
|
C19 |
4:6 |
384 |
384 |
192 |
18.32±.0.380 |
Turbid |
|
C20 |
5:5 |
480 |
320 |
160 |
2.61±.0.250 |
Turbid |
Table 3: Combination of Oleic acid + Tween 80+ Transcutol HP (Surfactant: Cosurfactant [1:1, 2:1]
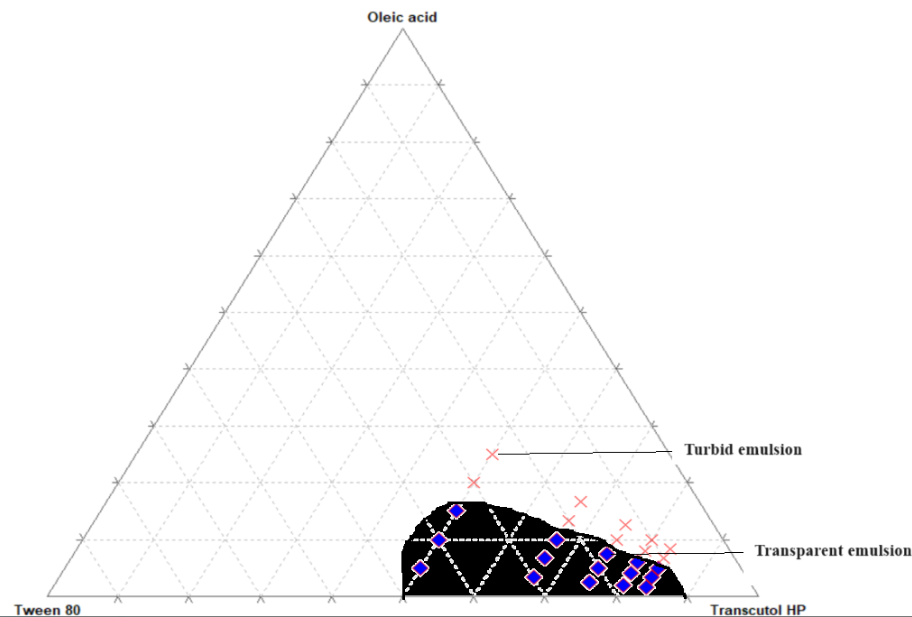
Figure 4: Oleic acid + Tween 80 + Transcutol HP
Discussion: Based on Figure 6.16, it is evident that the creation of nanoemulsion is influenced by the proportions at which the oil, surfactant, and co-surfactant are combined. The pseudo-ternary diagram illustrates the specific area (highlighted in black) where nanoemulsion formation is likely to occur as shown in Figure 6.16. The red crossed area signifies emulsion turbidity, while the blue dots represent the formation of highly transparent emulsion.
3.5 Preparation of nanoemulsion
Based on phase studies, optimized nanoemulsion formulations C1, C7, C11 and C16 are chosen for further characterization.
|
Sr. No. |
Formulation Code |
Drug Posaconazole (mg) |
Oleic acid (mg) |
Surfactant Tween 80 (mg) |
Co-surfactant PEG 400 (mg) |
Water (ml) |
|
1 |
C1 |
40 |
96 |
432 |
432 |
5 |
|
2 |
C7 |
40 |
192 |
512 |
256 |
5 |
|
3 |
C11 |
40 |
96 |
432 |
432 |
5 |
|
4 |
C16 |
40 |
96 |
576 |
288 |
5 |
Table 4: Composition of Optimized formulations by pseudo ternary diagram
3.6 Physical stability of nano-emulsion
|
Formulation Code |
Physical stability test |
Inference |
||
|
Heating |
Freeze thaw cycle |
Centrifugation |
||
|
C1 |
Stable |
Phase separation |
Disperse |
Passed |
|
C7 |
Stable |
Phase separation |
Disperse |
Passed |
|
C11 |
Stable |
Phase separation |
Disperse |
Passed |
|
C16 |
Stable |
Phase separation |
Disperse |
Passed |
Table 5: Physical stability test of formulations (Oleic acid+ Tween 80+ PEG 400)
Discussion: The physical stability parameters are possessed by the transparent nano-emulsions formulations.
3.7 Characterization of nano-emulsion
Discussion: Upon visual inspection, the naked eye was utilized to assess the successful formulation of NE. It is imperative to monitor the abrupt turbidity of the otherwise transparent and clear NE. The presence of no precipitation or phase separation signifies the stability of the formulation illustrated in Table Table 6. Emulsification process occurred rapidly, making it difficult to measure accurately. The fast rate of emulsification prevented the establishment of a dissolution profile, as the formulations exhibited 70% drug release within the shortest time frame recorded (3 minutes) illustrated in Table 6. Based on the data in Table 6, it was observed that the pH values of all the formulations fell within the range of 5.67±0.006 to 5.92±0.023.
The drug content ranged from 89.268±0.305 to 94.705±0.317%. The C7 formulation had the highest drug content at 94.705±0.317% compared to the others illustrated in Table 6. The Percentage Transmittance ranged from 90.67±0.230 to 98.45±0.268% in the study. All formulations exhibited satisfactory levels of percentage Transmittance illustrated in Table 6. The drug loading ranged from 18.70±0.127 to 19.10±0.135% in the study. The drug loading percentage in all formulations met the acceptable criteria illustrated in Table 6.
3.8 Evaluation of nano-emulsion
3.11.1 TEM
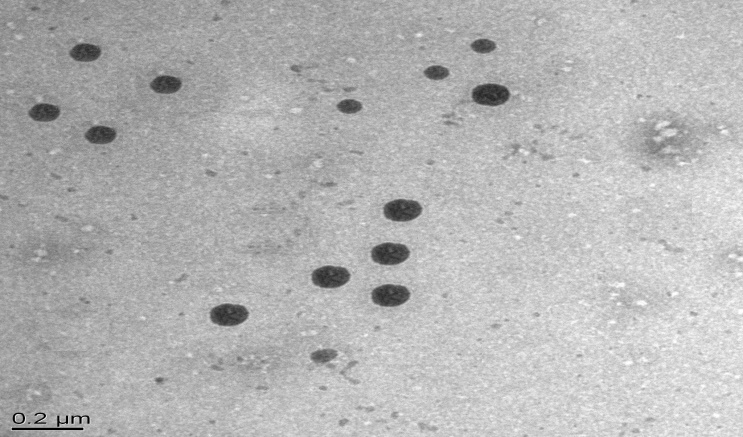
Figure 5: TEM of Nanoemulsion
Discussion: Based on the findings from figure 5, it was determined that the nanoemulsion created from the optimized formulation (C7) exhibited a spherical to oval shape.
3.9. Particle Size
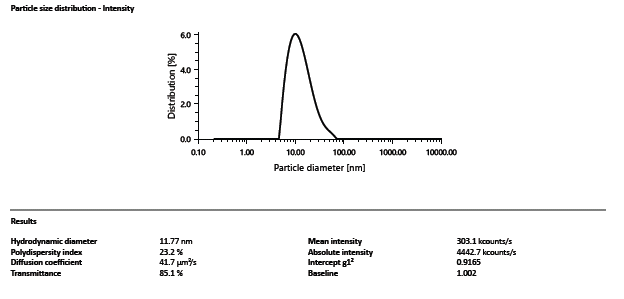
Figure 6: Particle size of Formulation (C7)
Discussion: The particle size of the C7 formulation was shown to be 11.77nm with a PDI of 0.232, as depicted in Figure 6.
3.10. Zeta potential
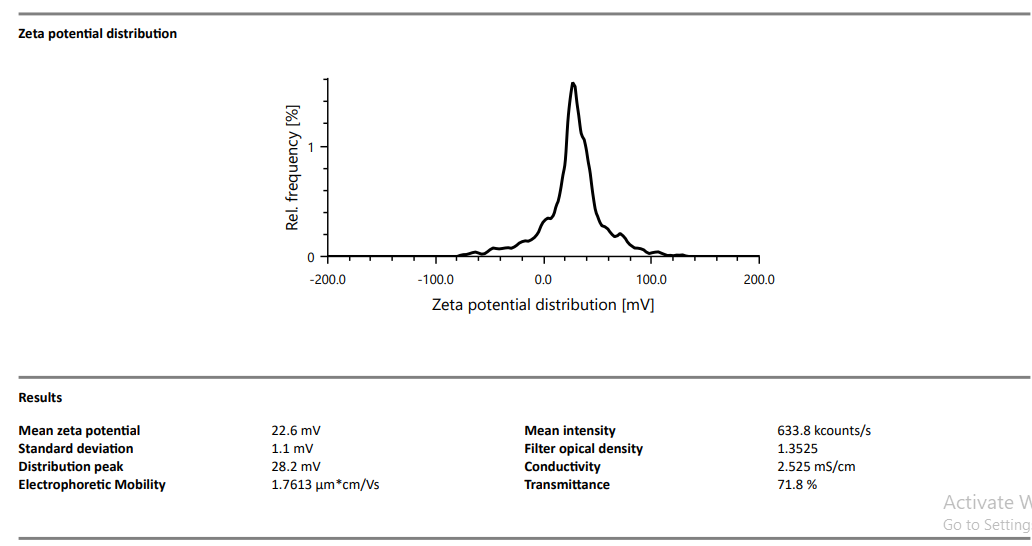
Figure 7: Zeta potential graph of C7 formulation
Discussion: Figure 7 illustrates that the zeta potential of the C7 formulation is 22.6 mV, indicating the stability of the formulation.
3.11 Preparation of Hydrogel
The hydrogel was formulated through the dispersion of 1gm of Carbopol 934 in a nanoemulsion. Following complete dispersion, the solution was left to stand for 24 hours to allow for the full swelling of Carbopol 934. Triethanolamine was introduced for crosslinking purposes. A clear and transparent 1% gel of Carbopol 934 was successfully produced. [101-102].
|
Sr. No. |
Ingredients |
Formulation Code |
|||
|
C7G1 |
C7G2 |
C7G3 |
C7G4 |
||
|
1 |
Nanoemulsion (mL) |
5 |
5 |
5 |
5 |
|
2 |
Carbopol 934P (%) |
0.5 |
1 |
1.5 |
2 |
|
3 |
Triethanolamine (mL) |
q.s |
q.s |
q.s |
q.s |
Table 7: Ingredients for Hydrogel Preparation
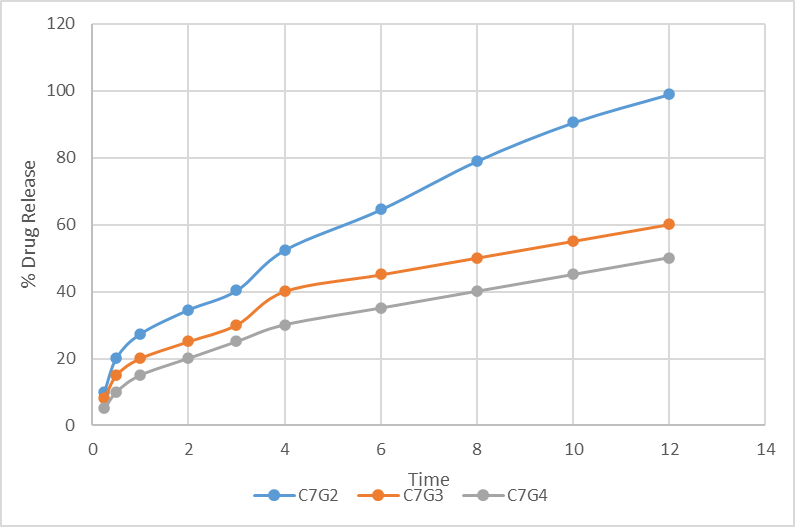
3.12 Evaluation of Nanoemulsion based Hydrogel
3.12.1 Physical Appearance
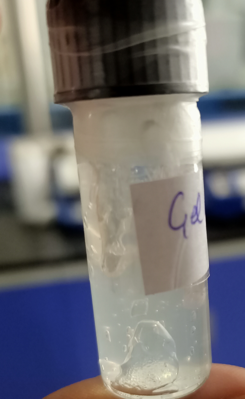
Figure 8: Visual Appearance of Posaconazole- loaded hydrogel
|
Sr. no. |
Formulation code |
Visual Appearance |
|
1 |
C7G1 |
Gel not Formed |
|
2 |
C7G2 |
Uniform Gel Formed |
|
3 |
C7G3 |
Sticky Gel Formed |
|
4 |
C7G4 |
Sticky Gel Formed |
Table 8: Visual Appearance of Posaconazole- loaded hydrogel
Discussion: Upon visual examination, the prepared gel was observed to possess a smooth consistency. It was determined that the gel formulations batches (C7G2 to C7G4) exhibited excellent homogeneity, devoid of any lumps. Consequently, these batches were selected for further investigation.
3.12.2 Characterization of Hydrogel:
|
S.No. |
Formulation code |
pH (Mean ± S.D) |
Viscosity (cps) (Mean ± S.D) |
Spreadability (g.cm/sec) |
% Drug Content |
|
1 |
C7G2 |
6.04±0.031 |
8764±2.65 |
13.23±0.021 |
97.500±0.384 |
|
2 |
C7G3 |
6.12±0.023 |
7965±1.53 |
12.17±0.015 |
95.467±0.233 |
|
3 |
C7G4 |
6.14±0.038 |
7885±1.53 |
11.72±0.023 |
94.807±0.317 |
Table 9: Characterization Parameters of hydrogel
Discussion: Based on Table 9, it was determined that the pH values of all formulations fell within the range of 6.04±0.031 to 6.14±0.038, viscosity of each formulation fell within the range of 7885±1.53 to 8764±2.65 cps, spreadability of the entire formulation fell within the range of 11.72±0.023 to 13.23±0.021 g.cm/sec and the drug content gels ranged from 94.807±0.317 to 97.500±0.384%. The drug content percentage in all formulations met the required standards. Therefore, the chosen method for preparing the gel formulations was deemed appropriate.
3.13 FTIR Study
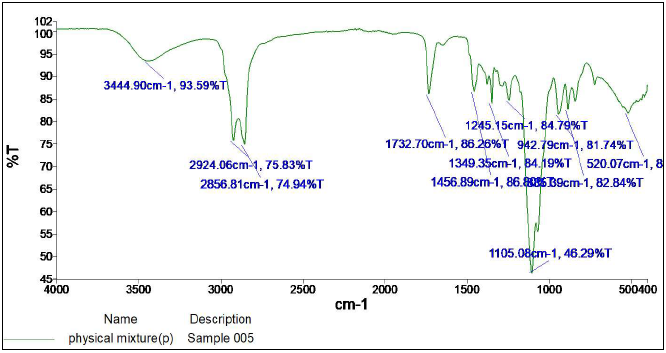
Figure 9: FTIR Spectra of Formulation C7G2
|
Reported peak (cm-1) |
Observed peak (cm-1) |
Functional group |
|
2918 |
2924.06 |
-CH2 stretch |
|
1735 |
1732.70 |
C=O stretching |
|
1452 |
1456.89 |
CH2 bending and CH3 bending |
Table 10: Interpretation of FTIR spectrum of Formulation C7G2
Discussion: In Figure 6.25, the spectrum of formulation C7G2 showed peaks at 29.24.06cm–1 (-CH2 stretch), 1732.70 cm–1 (C=O stretching), and 2855.73cm-1 (C–H stretching band). The FT-IR spectra of the ultimate formulation C7G2 retained certain posaconazole peaks with minor adjustments.
3.14 In vitro drug release studies
|
Sr. No. |
Time (hr) |
Drug Release of Pure Gel (%) |
Drug Release of Formulation C7G2 (%) |
|
1 |
0.25 |
5.611±0.015 |
10.122±0.061 |
|
2 |
0.5 |
10.607±0.089 |
20.243±0.122 |
|
3 |
1 |
19.014±0.222 |
27.421±0.211 |
|
4 |
2 |
25.900±0.255 |
34.580±0.089 |
|
5 |
3 |
32.532±0.333 |
40.354±0.117 |
|
6 |
4 |
33.527±0.122 |
52.452±0.447 |
|
7 |
6 |
35.844±0.179 |
64.545±0.878 |
|
8 |
8 |
36.960±0.155 |
79.077±0.894 |
|
9 |
10 |
38.735±0.122 |
90.586±0.585 |
|
10 |
12 |
42.812±0.155 |
99.051±0.894 |
Table 11: Drug release of Posaconazole in hydrogel and pure gel was studied in vitro.
.
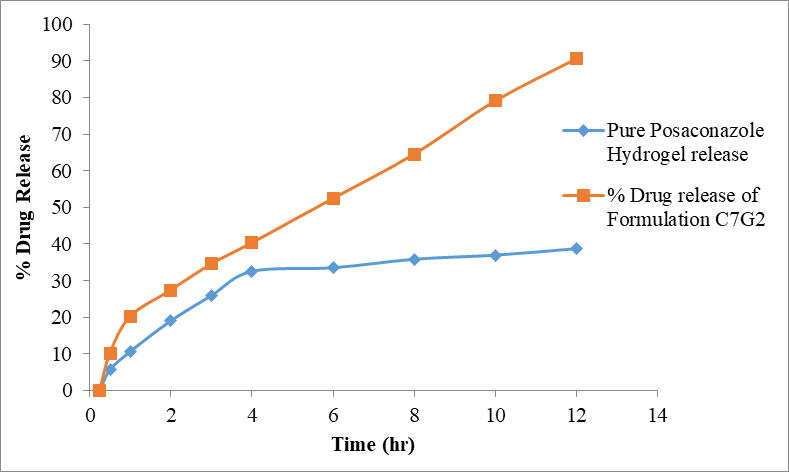
Figure 12: Percentage drug release of Posaconazole- loaded hydrogel & control gel
Result: The drug release profiles of a Posaconazole-loaded hydrogel and control gel were presented in Table 11. The hydrogel formulations exhibited a significantly prolonged drug release compared to the control gel. Specifically, the control gel released 42.812±0.155% of the drug within 12 hours, whereas the Posaconazole-loaded hydrogel formulation C7G2 released 99.051±0.894% within the same time frame. Therefore, it is evident that formulation C7G2 provides a sustained drug release.
3.15 Drug release kinetic studies
3.15.1 Zero order kinetics
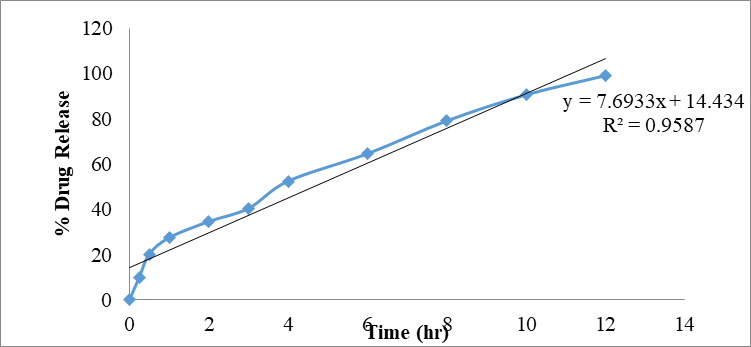
Figure 11: Zero order graph of formulation C7G2
3.15.2 First order kinetics
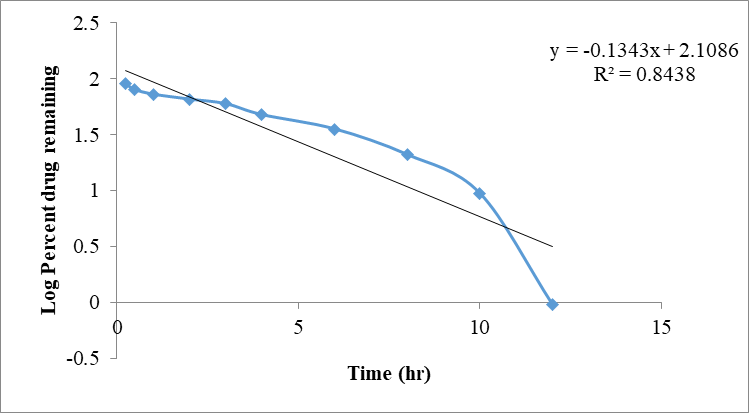
Figure 12: First order graph of formulation C7G2
3.15.3 Higuchi’s Model
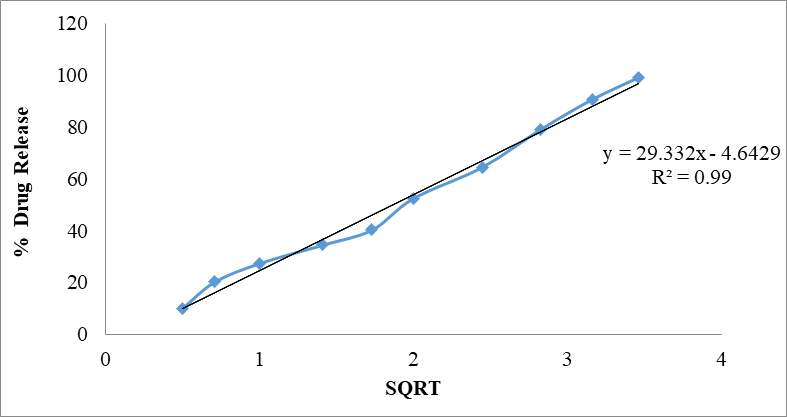
Figure 13: Higuchi order graph of formulation C7G2
3.15.4 Korsmeyer-Peppas Model
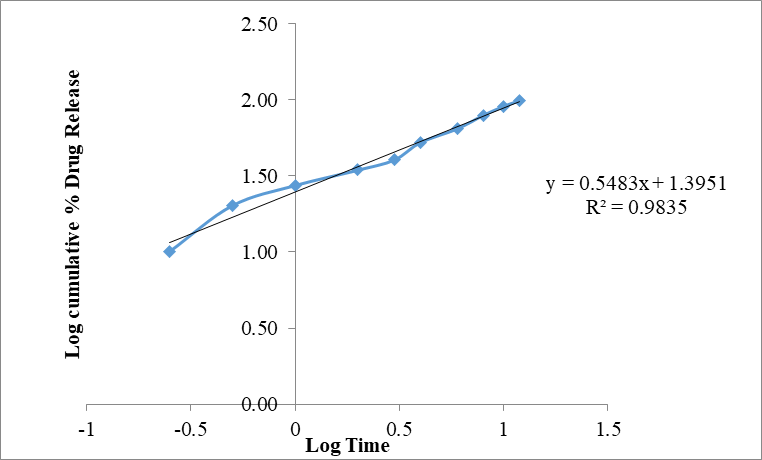
Figure 14: Korsmeyerpeppas order graph of formulation C7G2
|
Formulation Code |
Zero-order |
First-order |
Higuchi |
K. Peppas |
||||
|
K0 |
R2 |
K0 |
R2 |
K0 |
R2 |
K0 |
R2 |
|
|
C7G2 |
7.693 |
0.958 |
-0.134 |
0.843 |
29.332 |
0.990 |
0.548 |
0.983 |
Table 12: Kinetic equation parameter of formulation C7G2
Mathematical models were frequently utilized in forecasting the release mechanism and comparing release profiles. The optimized formulation involved plotting % drug release versus time (zero order), log percent drug remaining versus time (first order), log percent drug release versus square root of time (Higuchi plot), and log of log percent drug release versus log time (Korsmeyer and Peppas Exponential Equation). The R2 value was determined from the graphs and documented in Table 12. Based on the determination coefficients, the Higuchi model (R2=0.979) was identified as the most suitable fit for the release data. The findings suggest that the drug was released from Posaconazole-loaded hydrogel through a sustained mechanism.
4.0 Summary and Conclusion
The anti-fungal drug posaconazole's drug delivery system was created by incorporating the drug into a nanoemulsion formulation. The high solubility of POS in oleic acid facilitated the encapsulation of the solubilized drug in nanosized oil droplets with excellent loading efficiency. The oil-in-water nanoemulsion was evenly dispersed within the aqueous hydrogel system matrix, resulting in a formulation with the greatest solubility, nanoscale droplet size, narrow PDI, and negative zeta potential, all of which indicate enhanced stability and sustained drug release.
Upon physicochemical assessment, the melting point of posaconazole was determined to be between 169.33±1.53-171.33±2.08°C. The UV spectrophotometer analysis showed an absorption maxima of 264nm in methanol solvent. The partition coefficient of posaconazole in n-Octanol: Water was calculated to be 5.53±0.054, indicating its lipophilic nature. In terms of solubility, posaconazole was soluble in methanol, ethanol, and DCM, slightly soluble in Phosphate buffer 6.8 and water. FTIR spectroscopy analysis confirmed no interaction between the drug and excipients. A nanoemulsion of posaconazole was successfully prepared using a simple and reproducible method. The percentage drug content analysis revealed that C7G2 had the highest posaconazole content at 94.705±0.317%.
The ideal composition was chosen for the production of hydrogel using Carbopol 934P at varying concentrations. The pH of the resulting hydrogel ranged from 6.04±0.031 to 6.14±0.038. After conducting spreadability tests, it was determined that the gels exhibited optimal characteristics. The drug content percentage in all gel formulations ranged from 94.807±0.317 to 97.500±0.384%. Formulation C7G2 showed a drug release rate of 99.051±0.894% within a 12-hour period. The model that provides the best fit is characterized by a high regression coefficient value of the first order. Consequently, after considering all factors, we have determined that the release of drugs can be achieved instantly through the appropriate design of the formulation and the selection of an appropriate preparation method. Our study has successfully developed drug delivery systems that sustain the release of posaconazole.
REFERENCES


Dr. Amul Mishra, Mohammad Azhar, Formulation and Evaluation of Nano-emulsion Based Hydrogel of Posaconazole for Enhanced Antifungal Activity, Int. J. of Pharm. Sci., 2025, Vol 3, Issue 3, 598-615. https://doi.org/10.5281/zenodo.14995303
 10.5281/zenodo.14995303
