Surabhi Dayakar Rao College of pharmacy, Rimmanaguda, Gajwel, Siddipet, Telanagana, India, 502311
The present study focuses on the formulation and evaluation of sustained-release tablets of Zidovudine (AZT), a widely used antiretroviral drug for the treatment of HIV infection. Due to its short biological half-life and frequent dosing requirements, Zidovudine poses challenges in maintaining therapeutic drug levels and ensuring patient adherence. To overcome these limitations, sustained-release formulations were developed using various polymeric matrices and excipients aimed at achieving a controlled and prolonged drug release. Preformulation studies were conducted to assess the physicochemical properties of the drug and its compatibility with selected excipients. Tablets were prepared using the direct compression method and were subjected to a series of evaluation parameters including hardness, friability, weight variation, drug content, disintegration time, and in vitro drug release studies. The release kinetics were analyzed using mathematical models such as zero-order, first-order, Higuchi, and Korsmeyer-Peppas to understand the drug release mechanism. The optimized formulation demonstrated desirable physical characteristics and sustained drug release over an extended period, indicating its potential to improve therapeutic efficacy, reduce dosing frequency, and enhance patient compliance in the management of HIV infection.
Zidovudine (AZT), a nucleoside reverse transcriptase inhibitor (NRTI), is a cornerstone drug in the treatment of Human Immunodeficiency Virus (HIV) infection. Despite its efficacy, Zidovudine is associated with a short biological half-life of approximately 1 to 1.5 hours, necessitating frequent dosing (typically every 4–6 hours) to maintain effective plasma concentrations. This dosing regimen often leads to poor patient compliance, fluctuating plasma levels, and potential side effects. Sustained-release (SR) drug delivery systems offer a promising strategy to address these limitations by releasing the drug at a controlled rate over an extended period. The development of sustained-release formulations can significantly improve the pharmacokinetic and pharmacodynamic profiles of drugs like Zidovudine. By maintaining consistent drug levels in the bloodstream, SR tablets reduce the frequency of administration, minimize side effects, and improve patient adherence to antiretroviral therapy. Moreover, the incorporation of suitable polymers and excipients in the tablet matrix allows the tailoring of drug release kinetics to achieve the desired therapeutic outcomes. To address these limitations, sustained-release (SR) drug delivery systems offer a promising alternative. These systems are designed to release the drug gradually over an extended period, maintaining therapeutic drug levels for longer durations. This reduces the frequency of dosing, improves patient compliance, and minimizes fluctuations in drug concentration that can lead to side effects or sub-therapeutic responses. The use of hydrophilic and hydrophobic polymers in SR formulations enables the modulation of drug release profiles, allowing for controlled and predictable delivery. Incorporating Zidovudine into a sustained-release matrix not only enhances its pharmacokinetic and pharmacodynamic performance but also aligns with the goals of long-term HIV management strategies, where consistent drug levels are crucial for viral suppression and prevention of resistance. In this study, sustained-release tablets of Zidovudine were formulated and evaluated using various polymers. The research includes preformulation studies to assess the physicochemical properties and compatibility of the drug with selected excipients, formulation development, evaluation of physicochemical characteristics of the tablets, in vitro drug release studies, and mathematical modeling of release kinetics. This work aims to develop an effective sustained-release formulation that enhances therapeutic efficacy, reduces dosing frequency, and improves patient outcomes in the treatment of HIV infection.
MATERIALS AND METHODS
Excipient Profiles
The sustained-release matrix tablets of Zidovudine were formulated using key excipients including Ethyl Cellulose (EC), Xanthan Gum, Hydroxypropyl Methylcellulose (HPMC), and Talc, each selected for its functional role in modifying drug release and enhancing formulation stability. Ethyl Cellulose, a cellulose ether derivative, was utilized as a hydrophobic matrix former due to its insolubility in water and its ability to control drug release. It appears as a white to light tan, tasteless powder with excellent film-forming and binding properties. EC is stable, slightly hygroscopic, and chemically resistant to alkalis and salts. It is commonly employed in modified-release formulations as a coating agent or binder. Xanthan Gum, a high molecular weight polysaccharide, served as a viscosity enhancer and release modifier. It is cream to white in color, odorless, and freely dispersible in water. Known for its stability over a wide pH and temperature range, it imparts high viscosity and is especially useful in controlling the drug diffusion rate from hydrophilic matrices. Hydroxypropyl Methylcellulose (HPMC), also known as Hypromellose, was included for its excellent swelling and gel-forming ability, which helps regulate drug release through diffusion and erosion mechanisms. It is a white fibrous or granular powder that dissolves in cold water to form a viscous colloidal solution, making it ideal for extended-release formulations. HPMC is non-toxic and widely used in oral and topical dosage forms as a binder and rate-controlling agent. Talc, a white to greyish-white crystalline powder, functioned as a glidant and lubricant, enhancing powder flow during tablet compression. It is practically insoluble in water and other solvents and is commonly used in tablet and capsule formulations. Although generally regarded as non-toxic, pharmaceutical-grade talc must be free from asbestos and other harmful impurities. All excipients used were pharmaceutically acceptable and conformed to compendial specifications, ensuring both the performance and safety of the developed formulation.
Pre-Compression Evaluation of Sustained Release Zidovudine Tablets
Before compression of the Zidovudine sustained release tablets, the granules of all 12 formulations (Z1–Z12) were evaluated for various pre-compression parameters to ensure uniformity in flow and compressibility properties. These include bulk density, tapped density, Hausner’s ratio, compressibility index, and angle of repose. Bulk density (DB) is defined as the ratio of the weight of the granules to their bulk volume and gives insight into the packing behavior of the particles. Tapped density (DT) is the mass of powder divided by the volume after tapping, representing the powder's ability to settle. These values were used to determine Hausner’s ratio (DT/DB) and compressibility index (%CI), which are indicative of flowability and compressibility characteristics. A lower Hausner’s ratio (below 1.25) and a lower CI (below 20%) generally suggest better flow properties. Additionally, the angle of repose, measured using the fixed funnel method, provides a visual assessment of the powder flow, where an angle less than 30° indicates excellent flow and values greater than 40° indicate poor flow. Overall, these pre-compression parameters are crucial in tablet formulation development as they help in predicting and improving the efficiency of the tablet manufacturing process. Consistent results among formulations suggest suitability for direct compression and reliable scale-up in production. Evaluation results are typically tabulated (as in Table 14) to compare formulations, identify optimal granule properties, and ensure batch-to-batch reproducibility.
Flow property
Table No.7.2 The flow property of powder blend
|
Flow property |
Angle of repose |
Compressibility index (%) |
Hausner’s ratio |
|
Excellent |
25-30 |
<10 |
1.00-1.11 |
|
Good |
31-35 |
11-15 |
1.12-1.18 |
|
Fair |
36-40 |
16-20 |
1.19-1.25 |
|
Passable |
41-45 |
21-25 |
1.26-1.34 |
|
Poor |
46-55 |
26-31 |
1.35-1.45 |
|
Very poor |
56-65 |
32-37 |
1.46-1.59 |
|
Very very poor |
>66 |
>38 |
>1.60 |
Post Compression parameters
Weight variation test
Twenty tablets were randomly selected and weighed, to estimate the average weight and that were compared with individual tablet weight. The percentage weight variation was calculated as per Indian Pharmacopoeial Specification. Tablets with an average weight 250 mg so the % deviation was ±5 %.
Table 8.3 IP standards of uniformity of weight
|
S. No. |
Average weight of tablet |
% of deviation |
|
1 |
≤ 80 mg |
10 |
|
2 |
> 80 mg to <250 mg |
7.5 |
|
3 |
≥ 250 mg |
5 |
Friability test
Twenty tablets were weighed and subjected to drum of friability test apparatus. The drum rotated at a speed of 25 rpm. The friabilator was operated for 4 minutes and reweighed the tablets. % loss(F) was calculated by the following formula.
F =100 (W0-W)/W0
Where W0 = Initial weight, W = Final weight
Hardness test
The hardness of tablets was measured by using Monsanto hardness tester. The results were complied with IP specification.
Thickness test 63
The rule of physical dimension of the tablets such as sizes and thickness is necessary for consumer acceptance and maintain tablet uniformity. The dimensional specifications were measured by using screw gauge. The thickness of the tablet is mostly related to the tablet hardness can be used as initial control parameter.
Drug content
The amount of drug in tablet was important for to monitor from tablet to tablet, and batch to batch is to evaluate for efficacy of tablets. For this test, take ten tablets from each batch were weighed and powdered. Weighed equivalent to the average weight of the tablet powder and transferred into a 100 ml volumetric flask and dissolved in a suitable quantity of media. The solution was made up to the mark and mixed well. Then filter the solution. A portion of the filtrate sample was analyzed by UV spectrophotometer.
In vitro drug release studies
Apparatus -- USP-II, Paddle Method
Dissolution Medium -- 0.1 N HCL, pH 6.8 Phosphate buffer
RPM -- 50
Sampling intervals (hrs) -- 1, 2, 4, 6, 8, 10, 12, 16, 20 and 24
Temperature -- 37°c + 0.5°c
Procedure:
900ml 0f 0.1 HCL was placed in vessel and the USP apparatus –II (Paddle Method) was assembled. The media was allowed to equilibrate to temp of 37°c + 0.5°c. Tablet was placed in the vessel and apparatus was operated for 2 hours. Then 0.1 N HCL was replaced with pH 6.8 phosphate buffer and process was continued upto 24 hrs at 50 rpm. At specific time intervals, withdrawn 5 ml of sample and again 5ml media was added to maintain the sink condition. Withdrawn samples were analyzed at 260 nm wavelength of drug using UV-spectrophotometer.
Application of Release Rate Kinetics to Dissolution Data61
Various models were tested for explaining the kinetics of drug release. To analyze the mechanism of the drug release rate kinetics of the dosage form, the obtained data were fitted into zero-order, first order, Higuchi, and Korsmeyer-Peppas release model.
Zero order release rate kinetics:
To study the zero–order release kinetics the release rate data ar e fitted to the following equation.
F = Ko t
Where, ‘F’ is the drug release at time‘t’, and ‘Ko’ is the zero order release rate constant. The plot of % drug release versus time is linear.
First order release rate kinetics: The release rate data are fitted to the following equation
Log (100-F) = kt
A plot of log cumulative percent of drug remaining to be released vs. time is plotted then it gives first order release.
Higuchi release model: To study the Higuchi release kinetics, the release rate data were fitted to the following equation.
F = k t1/2
Where, ‘k’ is the Higuchi constant.
In higuchi model, a plot of % drug release versus square root of time is linear.
Korsmeyer and Peppas release model:
The mechanism of drug release was evaluated by plotting the log percentage of drug released versus log time according to Korsmeyer- Peppas equation. The exponent ‘n’ indicates the mechanism of drug release calculated through the slope of the straight Line.
Mt/ M∞ = K tn
Where, Mt/ M∞ is fraction of drug released at time ‘t’, k represents a constant, and ‘n’ is the diffusional exponent, which characterizes the type of release mechanism during the dissolution process. For non-Fickian release, the value of n falls between 0.5 and 1.0; while in case of Fickian diffusion, n = 0.5; for zero-order release (case I I transport), n=1; and for supercase II transport, n > 1. In this model, a plot of log (Mt/ M∞) versus log (time) is linear.
RESULTS AND DISCUSSION
The present work was designed to developing Sustained tablets of Zidovudine using various polymers. All the formulations were evaluated for physicochemical properties and in vitro drug release studies.
Analytical Method
Standard graph of Zidovudine in 0.1N HCL:
The scanning of the 10µg/ml solution of Zidovudine in the ultraviolet range (200-400nm) against 0.1 N HCL the maximum peak observed at lmax as 260 nm. The standard concentrations of Zidovudine (10-50 µg/ml) was prepared in 0.1N HCL showed good linearity with R2 value of 0.9998, which suggests that it obeys the Beer-Lamberts law.
Table 8.1: Standard curve of Zidovudine in 0.1N HCL
|
Concentration (µg/ ml) |
Absorbance |
|
0 |
0 |
|
10 |
0.115 |
|
20 |
0.221 |
|
30 |
0.327 |
|
40 |
0.431 |
|
50 |
0.541 |
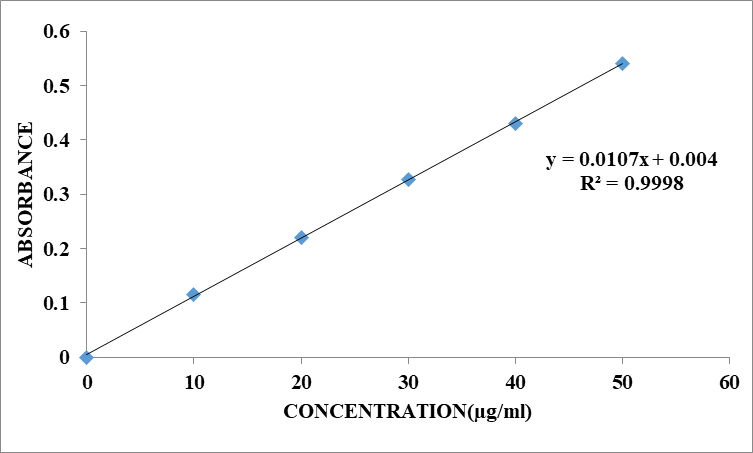
Fig. 8.1: Calibration curve of Zidovudine in 0.1 N HCL at 260 nm
Standard Curve of Zidovudine in Phosphate buffer pH 6.8
The scanning of the 10µg/ml solution of Zidovudine in the ultraviolet range (200-400nm) against 6.8 pH phosphate the maximum peak observed at the lmax as 260nm. The standard concentrations of Zidovudine(10-50µg/ml) prepared in 6.8 pH phosphate buffer showed good linearity with R2 value of 0.9998, which suggests that it obeys the Beer-Lamberts law
Table 8.2: Standard curve of Zidovudinein Phosphate buffer pH 6.8
|
Concentration (µg / ml) |
Absorbance |
|
0 |
0 |
|
10 |
0.125 |
|
20 |
0.22 |
|
30 |
0.333 |
|
40 |
0.440 |
|
50 |
0.536 |
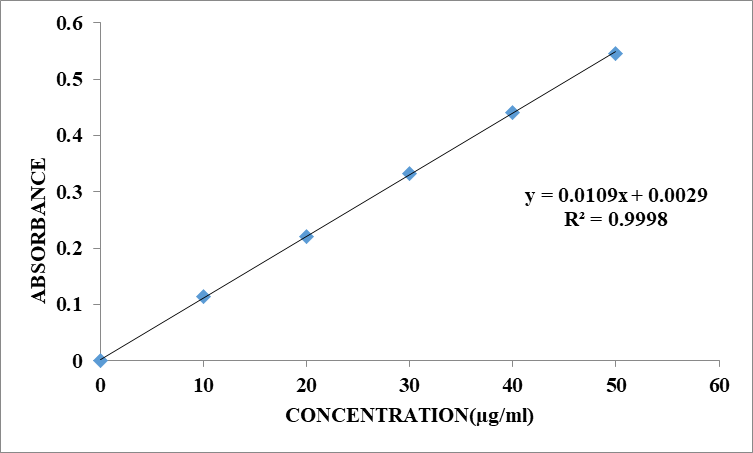
Fig.8.2: Calibration of Zidovudine in Phosphate buffer pH 6.8
8.2 Drug and Excipient Compatibility Studies
8.2.1 FTIR study
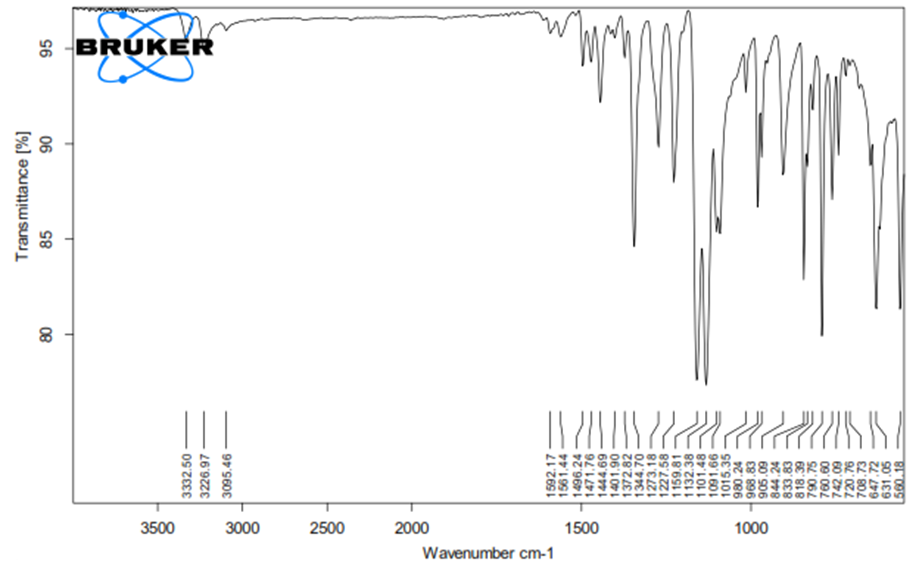
Fig. 8.3 : FTIR GRAPH OF PURE DRUG
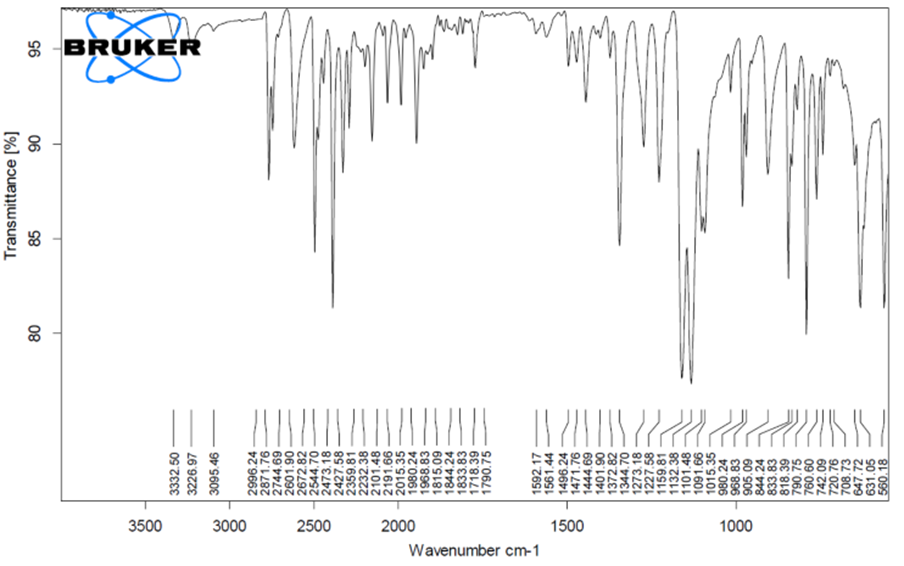
Fig. 8.4: FTIR GRAPH OF OPTIMISED FORMULATION
From the FTIR data it was evident that the drug and excipients doses not have any interactions. Hence they were compatible.
EVALUATION PARAMETERS
Pre-compression parameters
Table 8.3: Pre-compression parameters of powder blend
|
Formulation Code |
Angle of Repose |
Bulk density (gm/ml) |
Tapped density (gm/ml) |
Carr’s index (%) |
Hausner’s Ratio |
|
Z1 |
25.15 ± 0.58 |
0.49 ± 0.01 |
0.56 ± 0.08 |
12.5 ± 0.21 |
1.14 ± 0.012 |
|
Z2 |
28.53 ± 0.57 |
0.48 ± 0.06 |
0.56 ± 0.08 |
14.28 ± 0.47 |
1.16 ± 0.032 |
|
Z3 |
28.38 ± 0.56 |
0.47 ± 0.08 |
0.54 ± 0.01 |
12.96 ± 0.42 |
1.14 ± 0.031 |
|
Z4 |
27.61 ± 0.63 |
0.53 ± 0.09 |
0.61 ± 0.071 |
13.1 ± 0.15 |
1.15 ± 0.021 |
|
Z5 |
25.41 ±0.65 |
0.52 ±0.091 |
0.59 ±0.064 |
14.21 ±0.17 |
1.25 ±0.022 |
|
Z6 |
26.08 ± 0.51 |
0.55 ± 0.011 |
0.62 ± 0.06 |
11.29 ± 0.35 |
1.12 ± 0.023 |
|
Z7 |
25.25 ±0.52 |
0.43 ±0.022 |
0.61 ±0.033 |
11.20 ±0.03 |
1.10 ±0.06 |
|
Z8 |
25.46 ± 0.57 |
0.55 ± 0.08 |
0.62 ± 0.011 |
11.29 ± 0.57 |
1.12 ± 0.015 |
|
Z9 |
26.43 ±0.62 |
0.56 ± 0.07 |
0.63 ± 0.012 |
11.11 ± 0.12 |
1.12 ± 0.056 |
|
Z10 |
24.16 ±0.68 |
0.54 ± 0.051 |
0.64 ±0.013 |
11.21 ±0.21 |
1.14 ±0.051 |
|
Z11 |
26.12 ± 0.1 |
0.44 ± 0.03 |
0.50± 0.061 |
12 ± 0.58 |
1.13 ± 0.012 |
|
Z12 |
27.26 ± 0.56 |
0.52 ± 0.055 |
0.59 ± 0.08 |
11.86 ± 0.57 |
1.13 ± 0.026 |
Tablet powder blend was subjected to various pre-compression parameters. The angle of repose values was showed from 25 to 30; it indicates that the powder blend has good flow properties. The bulk density of all the formulations was found to be in the range of 0.44±0.03 to 0.56 ± 0.07 (gm/cm3) showing that the powder has good flow properties. The tapped density of all the formulations was found to be in the range of 0.50± 0.061to 0.63 ± 0.012 showing the powder has good flow properties. The compressibility index of all the formulations was found to be ranging from 11 to 14.28 which showed that the powder has good flow properties. All the formulations were showed the hausner ratio ranging from 0 to 1.25 indicating the powder has good flow properties.
Post Compression Parameters For tablets
Table.8.4: Post Compression Parameters of Tablets
|
Formulation codes |
Average Weight (mg) |
Hardness (kg/cm2) |
Friability (%loss) |
Thickness (mm) |
Drug content (%) |
|
Z1 |
200.23 ±0.25 |
4.8±0.03 |
0.52±0.03 |
4.7±0.04 |
103.5 ± 0.14 |
|
Z2 |
201.53 ± 0.34 |
4.5 ± 0.02 |
0.561 ±0.03 |
4.2 ±0.02 |
99.50 ± 0.22 |
|
Z3 |
199.25 ± 2.02 |
4.6±0.09 |
0.48±0.08 |
4.6 ±0.09 |
104.3 ± 012 |
|
Z4 |
198.25± 1.15 |
4.7±0.01 |
0.45±0.02 |
4.3 ±0.05 |
97.2 ± 0.19 |
|
Z5 |
202.5 ± 0.86 |
4.7±0.04 |
0.55±0.07 |
4.3 ±0.05 |
98.3 ± 0.20 |
|
Z6 |
203.26 ± 1.25 |
4.7±0.01 |
0.45±0.02 |
4.4±0.05 |
98.2 ± 0.19 |
|
Z7 |
199.5 ± 0.95 |
4.8±0.07 |
0.51±0.04 |
4.3 ±0.03 |
102.3 ± 0.28 |
|
Z8 |
202.26 ± 0.81 |
4.5±0.01 |
0.55±0.02 |
4.6±0.06 |
98.2 ± 0.15 |
|
Z9 |
201.36 ± 1.17 |
4.7±0.04 |
0.56±0.04 |
4.7±0.08 |
100.8 ± 0.17 |
|
Z10 |
199.95 ± 1.72 |
4.8±0.01 |
0.45±0.05 |
4.4 ±0.05 |
98.8 ± 0.14 |
|
Z11 |
202.15 ± 1.31 |
4.7±0.05 |
0.54±0.07 |
4.6±0.04 |
99.3 ± 0.13 |
|
Z12 |
201.5 ± 0.25 |
4.8±0.04 |
0.51±0.04 |
4.6±0.03 |
102.3 ± 0.21 |
Weight variation and thickness: All the formulations were evaluated for uniformity of weight using electronic weighing balance and the results are shown in table 9.5. The average tablet weight of all the formulations was found to be between 298.25± 1.15± 2.02 to 303.26 ± 1.25. The maximum allowed percentage weight variation for tablets weighing >250 mg is 5% and no formulations are not exceeding this limit. Thus all the formulations were found to comply with the standards given in I.P. And thickness of all the formulations was also complying with the standards that were found to be between 4.2 ±0.02 to 4.7±0.08.
Hardness and friability: All the formulations were evaluated for their hardness, using monsanto hardness tester and the results are shown in table 9.5. The average hardness for all the formulations was found to be between (4.5 ± 0.01 to 4.8±0.07) Kg/cm2 which was found to be acceptable. Friability was determined to estimate the ability of the tablets to withstand the abrasion during packing, handling and transporting. All the formulations were evaluated for their percentage friability using Roche friabilator and the results were shown in table 9.5. The average percentage friability for all the formulations was between 0.45±0.04 and 0.56±0.04, which was found to be within the limit.
Drug content: All the formulations were evaluated for drug content according to the procedure described in methodology section and the results were shown in table 9.5. The drug content values for all the formulations were found to be in the range of (98.2 ± 0.15 to 104.3 ± 012). According to IP standards the tablets must contain not less than 95% and not more than 105% of the stated amount of the drug. Thus, all the FDT formulations comply with the standards given in IP.
In Vitro Drug Release Studies
The formulations prepared with different polymers by direct compression method. The tablets dissolution study was carried out in paddle dissolution apparatus using 0.1N HCL for 2 hours and 6.8 pH phosphate buffers for remaining hours as a dissolution medium.
Table 8.5: Dissolution Data of Zidovudine Tablets Prepared with HPMC K100M in Different Ratios
|
TIME (hr) |
CUMULATIVE percent drug released |
|||
|
Z1 |
Z2 |
Z3 |
Z4 |
|
|
0 |
0 |
0 |
0 |
0 |
|
1 |
21.56 |
22.67 |
38.31 |
28.20 |
|
2 |
29.56 |
27.19 |
46.57 |
36.58 |
|
4 |
35.43 |
33.86 |
53.86 |
45.69 |
|
6 |
44.95 |
39.60 |
58.48 |
53.55 |
|
8 |
52.12 |
47.86 |
65.77 |
59.38 |
|
10 |
63.76 |
56.78 |
71.68 |
65.60 |
|
12 |
68.27 |
62.41 |
79.54 |
71.42 |
|
16 |
72.54 |
79.17 |
85.43 |
78.31 |
|
20 |
78.45 |
84.33 |
90.38 |
86.34 |
|
24 |
89.14 |
91.01 |
96.61 |
90.29 |
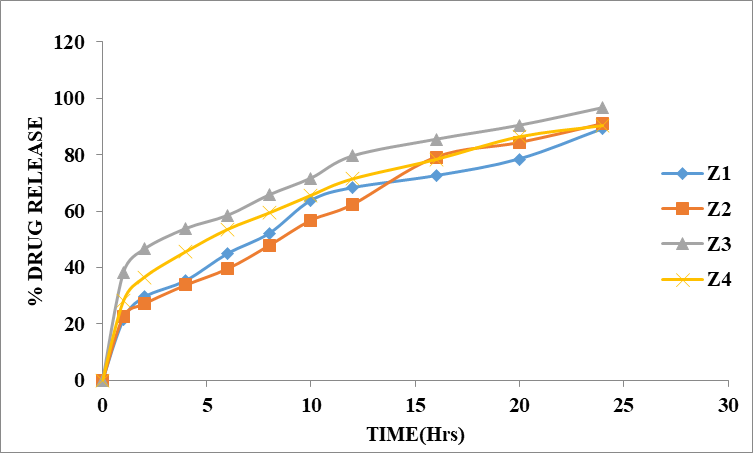
Figure 8.5: Dissolution study of Zidovudine Sustained tablets (Z1 to Z4)
The % drug release of formulations (Z1 to Z4) containing HPMC K100M depends on the concentration of polymer. The concentration of HPMC K100M 1:1 and 1:2 was unable to retard the drug release up to desired time. When the concentration of polymer increased to 1:3 was able to retard the drug up to 24 hours. In Z3 formulation 1:3 ratio (drug: polymer) concentration was used, showed maximum % drug release up to 24 hours i.e., 96.61%.
Table 8.6: Dissolution Data of Zidovudine Tablets Prepared With Ethyl cellulose in Different Concentrations
|
TIME (hr) |
CUMULATIVE percent drug released |
|||
|
Z5 |
Z6 |
Z7 |
Z8 |
|
|
0 |
0 |
0 |
0 |
0 |
|
1 |
19.32 |
20.16 |
27.50 |
19.55 |
|
2 |
26.49 |
28.33 |
31.50 |
28.17 |
|
4 |
31.42 |
36.45 |
37.41 |
36.27 |
|
6 |
36.50 |
45.62 |
48.34 |
47.44 |
|
8 |
39.56 |
54.89 |
59.49 |
59.15 |
|
10 |
44.24 |
61.30 |
63.56 |
67.80 |
|
12 |
51.45 |
66.31 |
67.65 |
72.83 |
|
16 |
59.50 |
72.79 |
74.42 |
75.61 |
|
20 |
65.72 |
79.31 |
80.43 |
77.86 |
|
24 |
71.34 |
85.66 |
89.25 |
80.10 |
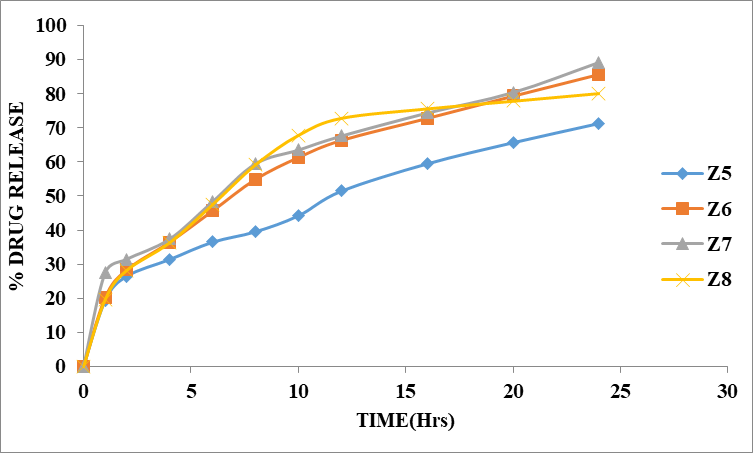
Figure 8.6: Dissolution study of Zidovudine tablets (Z5 to Z8)
The % drug release of Z5 to Z8 formulations depends on ratio of polymer in the solution. The concentration of Ethyl cellulose polymer 1:1 was More retard the drug release up to desired time. When the ratio of polymer 1:2 was retard the drug up to desired time period i.e 85.66% at 24 hours. In Z7 formulations, polymer ratio is 1:3 showed maximum % drug release i.e 89.25% at 24 hours.
Table 8.7: Dissolution Data of Zidovudine by using Xanthan gum
|
TIME (hr) |
CUMULATIVE percent drug released |
|||
|
Z9 |
Z10 |
Z11 |
Z12 |
|
|
0 |
0 |
0 |
0 |
0 |
|
1 |
20.97 |
25.78 |
14.93 |
12.71 |
|
2 |
31.94 |
38.13 |
26.93 |
22.99 |
|
4 |
43.31 |
49.00 |
35.41 |
31.96 |
|
6 |
50.41 |
56.10 |
45.22 |
42.28 |
|
8 |
57.48 |
68.11 |
55.72 |
51.60 |
|
10 |
66.42 |
75.56 |
63.16 |
59.19 |
|
12 |
70.09 |
81.95 |
67.84 |
63.19 |
|
16 |
74.56 |
86.79 |
71.30 |
67.67 |
|
20 |
80.06 |
88.71 |
83.55 |
70.44 |
|
24 |
83.53 |
90.78 |
86.64 |
71.83 |
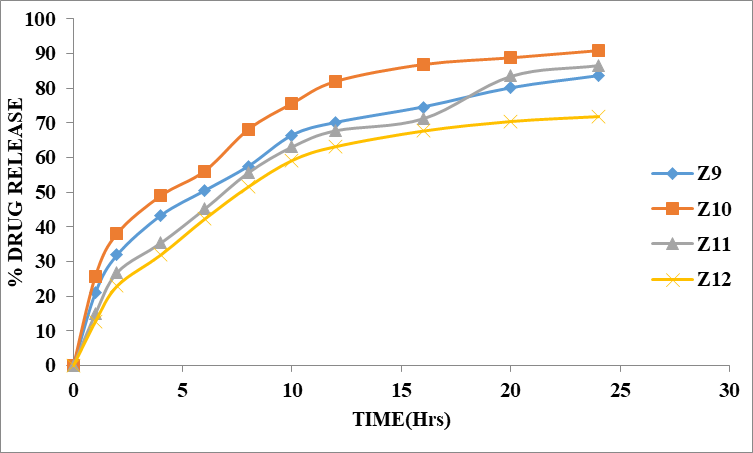
Figure 8.7: Dissolution study of Zidovudine tablets with different ratios of Xanthan gum (Z9 to Z12)
The % drug release of Z9 to Z12 formulations depends on ratios of polymer in the solution. The Xanthan gum natural polymer 1:1 ratio was more to retard the drug release up to desired time. When the ratio of Xanthan gum natural polymer 1:2 was retard the drug up to desired time period i.e 90.78 % at 24 hours. In Z10 formulations, gumr ratio is 1:2 showed maximum % drug release i.e 90.78% at 24 hours but the maximum drug is released at within 24 hours. Hence based on dissolution data of 12 formulations, Z3 formulation showed better release (96.61%) up to 24 hours. So Z11 formulation is optimised formulation.
Application of Release Rate Kinetics to Dissolution Data
Data of in vitro release studies of formulations which were showing better drug release were fit into different equations to explain the release kinetics of Zidovudine release from Sustained tablets. The data was fitted into various kinetic models such as zero, first order kinetics; higuchi and korsmeyer peppas mechanisms and the results were shown in below table
Table 8.9: Release kinetics data for optimized formulation (Z11)
|
Cumulative (%) Release Q |
Time (T) |
Root (T) |
Log ( %) Release |
Log (T) |
Log (%) Remain |
Release Rate (Cumulative % Release / T) |
1/Cum% Release |
Peppas Log Q/100 |
% Drug Remaining |
Q01/3 |
Qt1/3 |
Q01/3-Qt1/3 |
|
0 |
0 |
0 |
2.000 |
100 |
4.642 |
4.642 |
0.000 |
|||||
|
38.31 |
1 |
1.000 |
1.583 |
0.000 |
1.790 |
38.310 |
0.0261 |
-0.417 |
61.69 |
4.642 |
3.951 |
0.690 |
|
46.57 |
2 |
1.414 |
1.668 |
0.301 |
1.728 |
23.260 |
0.0215 |
-0.332 |
53.43 |
4.642 |
3.766 |
0.875 |
|
53.86 |
4 |
2.000 |
1.731 |
0.602 |
1.664 |
13.465 |
0.0186 |
-0.269 |
46.14 |
4.642 |
3.587 |
1.055 |
|
58.48 |
6 |
2.449 |
1.767 |
0.778 |
1.618 |
9.747 |
0.0171 |
-0.233 |
41.52 |
4.642 |
3.463 |
1.179 |
|
65.77 |
8 |
2.828 |
1.818 |
0.903 |
1.534 |
8.221 |
0.0152 |
-0.182 |
34.23 |
4.642 |
3.247 |
1.395 |
|
71.68 |
10 |
3.162 |
1.855 |
1.000 |
1.452 |
7.168 |
0.0140 |
-0.145 |
28.32 |
4.642 |
3.048 |
1.593 |
|
79.54 |
12 |
3.464 |
1.901 |
1.079 |
1.311 |
6.628 |
0.0126 |
-0.099 |
20.46 |
4.642 |
2.735 |
1.907 |
|
85.43 |
16 |
4.000 |
1.932 |
1.204 |
1.163 |
5.339 |
0.0117 |
-0.068 |
14.57 |
4.642 |
2.442 |
2.199 |
|
90.38 |
20 |
4.472 |
1.956 |
1.301 |
0.983 |
4.519 |
0.0111 |
-0.044 |
9.62 |
4.642 |
2.127 |
2.515 |
|
96.61 |
24 |
4.899 |
1.985 |
1.380 |
0.530 |
4.025 |
0.0104 |
-0.015 |
3.39 |
4.642 |
1.502 |
3.139 |
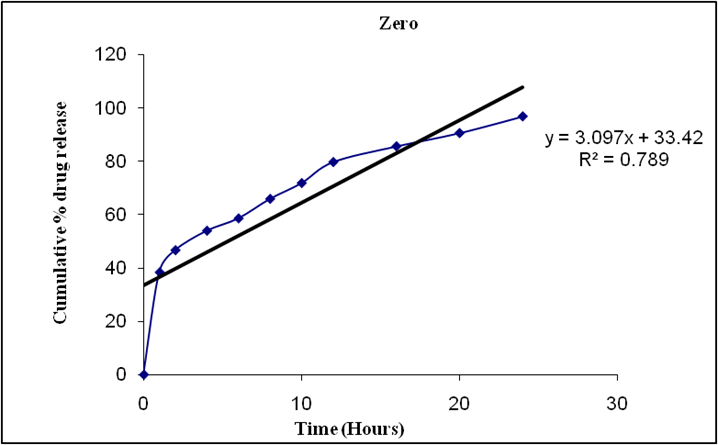
Figure 8.9: Graph of Zero order kinetics

Figure 8.10: Graph of Higuchi release kinetics
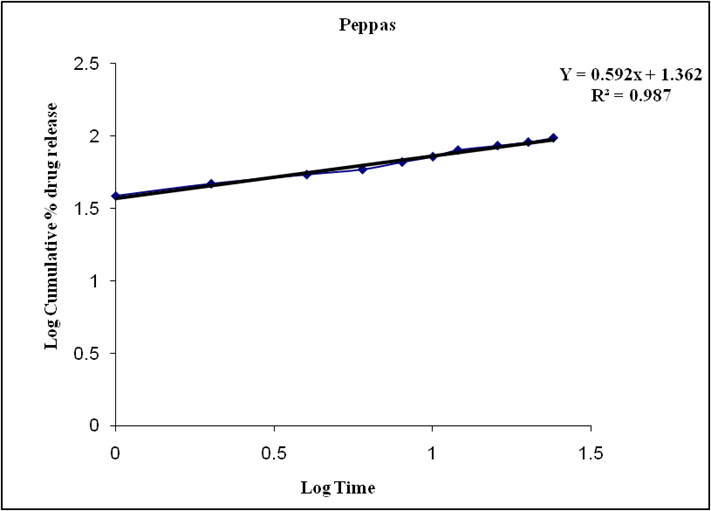
Figure 8.11: Graph of Peppas release kinetics

Figure 8.12: graph of First order release kinetics
Based on the data above results the optimized formulation followed Higuchi release kinetics.
CONCLUSION
The present study successfully formulated and evaluated sustained-release tablets of Zidovudine, demonstrating their potential to enhance the drug's pharmacokinetic profile. By optimizing the selection and concentration of polymeric excipients, the developed formulation achieved a controlled and prolonged release of Zidovudine over a 24-hour period—an essential factor in maintaining consistent therapeutic plasma concentrations and improving patient adherence. The sustained-release profile significantly reduced peak-to-trough plasma fluctuations, thereby potentially minimizing dose-related side effects and enabling reduced dosing frequency when compared to conventional immediate-release formulations. In vitro drug release studies confirmed the extended-release behavior, and the tablets met pharmacopoeial standards in terms of physical characteristics such as hardness, friability, and drug content uniformity. Kinetic modeling indicated that the release mechanism followed diffusion-controlled (Higuchi) kinetics with a non-Fickian transport pattern as per the Korsmeyer-Peppas model, suggesting a combination of diffusion and erosion processes in drug release. Overall, the sustained-release Zidovudine tablets developed in this study present a promising advancement in antiretroviral therapy, offering improved drug delivery performance and enhanced patient-centric outcomes in the long-term management of HIV infect.
CONFLICT OF INTEREST
The authors declare that there is no conflict of interest regarding the publication of this manuscript.
REFERENCES


Santhosh Suddagoni, Bharathi Narsapuram, M. D. Shadulla, K. Naveen, V. Vikram, K. Lekhana, M. Tejaswini, Formulation And Evaluation of Sustained Release Tablets of Zidovudine, Int. J. of Pharm. Sci., 2025, Vol 3, Issue 6, 5037-5052. https://doi.org/10.5281/zenodo.15747540
 10.5281/zenodo.15747540
