Department of Pharmaceutics, Mewar University. Gangrar, Chittorgarh, Rajasthan-132901.
Aim: To prepare and evaluate gastroretentive floating tablet of alfuzosin hydrochloride. Background: The innovative approach of floating drug delivery significantly contributes to the improvement of sustained release characteristics, thereby enhancing the bioavailability and half-life of the medication. Floating tablets of Alfuzosin have been formulated to extend the gastric residence time, which results in increased drug bioavailability, minimizes drug dumping, and reduces the frequency of dosing. This study aimed to develop and evaluate a sustained release floating tablet that incorporates alfuzosin hydrochloride as the active ingredient, utilizing hydrophilic polymers for the management of benign prostatic hyperplasia. Methodology: Alfuzosin HCl serves as the active pharmaceutical ingredient. Hydrophilic polymers, specifically HPMC K4M and HPMC K100M, are utilized in the formulation. The excipients employed include microcrystalline cellulose, polyvinylpyrrolidone, magnesium stearate, talc, and aerosil. The drug and polymers are combined in a mortar and pestle, followed by the uniform incorporation of the required excipients, leading to the preparation of tablets via the direct compression method. The drug was analyzed using UV spectrophotometry, while compatibility studies of the excipients were conducted through FTIR analysis. The resulting tablets underwent evaluation for various parameters, including weight variation, thickness, hardness, friability, drug content, swelling index, lag time, and drug release profiles. Ultimately, the most promising formulation was assessed for stability in accordance with ICH guidelines. Results: Considering all the evaluation parameters F5 was found to be the best formulations, with a sustained Release of 61% of the drug at the end of 8th hours.
Oral drug delivery is the most preferred and convenient option for drug administration because it provides the most active surface area of any drug delivery system and patient acceptability. The awareness to toxicity and ineffectiveness of drug results towards the attractiveness of these dosage form either in tablets or capsules. Oral drug delivery effectiveness may be affected by factors such as gastric emptying, gastrointestinal transit time of the dosage form, drug release from the dosage form, and site of drug absorption. Over the years, oral dosage form has shown tremendous advances with major role being played by control release drug delivery system CRDDS.[1] The goal of the design of an oral controlled drug delivery system is to achieve more predictable and increased bioavailability, resulting in the greatest therapeutic effect possible. However, some of these systems do not work as planed due to several physiological difficulties, such as inability to restrain and localize the drug delivery system under the high variable nature of gastric emptying and preferred region of GIT. It can be anticipated that, depending upon the physiological state of subject and the design of pharmaceutical formulation, the emptying process can last from a few minutes to 12 hrs.[2] Because the majority of drugs are absorbed in the stomach or upper part of the small intestine, rapid GI transit can prevent complete drug release in the absorption zone and reduce the efficacy of administered dose. Thus, placement of drug delivery system in a specific region of the GIT offers a numerous advantage especially to the drug having narrow absorption window, stability problem in intestine, poor alkaline pH solubility, local activity in the stomach, and ability to degrade in a column. Therefore, the design of a sustained release preparation requires both prolongation of GI transit of dosage form as well as controlled drug release.[2] The majority of orally administered dosage forms have several physiological limitations, such as gastrointestinal (GI) transit time, incomplete drug release from devices, or insufficient residence time of pharmaceutical dosage forms in the GI tract absorption region. This results in low bioavailability of sustained release dosage forms, and even if slow release of the drug is achieved, the drug released after passing the absorption site is not utilized, lowering the drug's efficacy. The gastrointestinal transit time is one of several physiological limitations that must be controlled in the development of oral sustained release dosage forms.[3] To address these limitations, several controlled oral drug delivery systems with extended gastric residence times have recently been reported. Gastro retentive drug delivery system is an approach to prolong gastric residence time, thereby targeting site-specific drug release in upper gastro intestinal tract. The gastro retentive drug delivery system can be retained in the stomach and assist in an improving the oral sustained delivery of drug that have an absorption window in a region of the gastrointestinal tract. The systems aid in the continuous release of the drug prior to it reaching the absorption window, ensuring optimal bioavailability. CRDDS releases the drug at a predetermined rate by the pharmacokinetics of the drug and the desired therapeutic concentration. This aids in achieving the required drug plasma concentration for therapeutic effect. The effectiveness of an oral CRDDS is determined by-
Drugs with short half-lives that are simply absorbed from the alimentary canal (GIT) or quickly eliminated from the circulation to attain adequate therapeutic activity, these medication should be treated on an everyday basis to beat this limitation, the event of oral sustained-release formulations is an effort to slowly release the drug into the alimentary canal (GIT) whereas maintaining an efficient drug concentration within the circulation for associate degree extended amount of your time. The identification of recent diseases and also the resistance shown towards the prevailing medicine caught up the introduction of new therapeutic molecules. In response, several chemical entities are introduced, of that some have absorption everywhere the duct (GIT), some have absorption windows (i.e. absorption sites), particularly the higher part of the tiny bowel and a few medicine have poor solubility in enteral media. The medicine happiness to the second and third classes, and also the medicine that area unit needed for native action within the abdomen, need a specialised delivery system. All the above requirements can be met and effective delivery of the medicine to the absorption window, for native action and for the treatment of internal organ disorders like gastro-esophageal reflux, is achieved by floating drug delivery systems (FDDS).[5] The hydrodynamic balanced system (HBS), also known as the floating drug delivery system (FDDS), is an oral dosage form (capsule or tablet) designed to extend the dosage form's residence time within the GIT. It is a formulation of a drug with gel forming hydrocolloids meant to stay buoyant within the abdomen contents. Drug dissolution and release from the dosage form retained in the stomach fluids occur at the pH of the stomach under controlled conditions.[6]
The objectives of the present study are as follows:
Research Design
Materials Used
Table 1: List of drugs and chemicals
|
Sl. No |
Materials |
Sources |
|
1 |
Alfuzosin |
Biocon Pharma Bengaluru |
|
2 |
HPMC K4M |
Colorcon Asia Pvt.Limited, Goa |
|
3 |
HPMC K100M |
Biocon Pharma Bengaluru |
|
4 |
Na CMC |
S.D. Fine chemicals limited, Mumbai |
|
5 |
Sodium Bicarbonate |
S.D. Fine chemicals limited, Mumbai |
|
6 |
Aerosil |
S.D. Fine chemicals limited, Mumbai |
|
7 |
Magnesium stearate |
S.D. Fine chemicals limited, Mumbai |
|
8 |
Hydrochloric acid |
S.D. Fine chemicals limited, Mumbai |
|
9 |
Methanol |
Fischer Scientific, Bengaluru |
|
10 |
Acetone |
Fischer Scientific, Bengaluru |
Instruments
Table 2: List of instruments and Manufacture Company
|
Equipment |
Company |
|
Electronic Balance |
Shimadzu2000 |
|
Standard sieve (#60) |
Ajanta Sieves, Chennai. |
|
10 station Rotary Punch Tablet Compression Machine |
Rimek Minipress, Ahmadabad |
|
Hardness Tester |
Monsanto |
|
Friability Tester |
Roche Friabilator |
|
USP Tablet dissolution apparatus type II |
Disso 2000 Shimadzu |
|
UV Spectrophotometer |
Shimadzu 1700, Japan |
|
pH Mete |
Eutech, Singapore |
Preformulation Studies:
The preformulation study serves as the foundational step in the logical development of a dosage form, involving an analysis of the drug's properties both independently and in combination with various excipients. This study encompasses the characterization of the physical, chemical, and mechanical attributes of the drug and excipients, with the objective of formulating a dosage form that is safe, effective, and stable. The overarching aim of this preformulation study is to compile information that will aid formulators in creating a dosage form that is stable, bioavailable, and amenable to mass production. For any drug substance to be effectively formulated into a dosage form, it is essential to examine all relevant properties, including organoleptic features, crystallinity, polymorphism, hygroscopicity, flow characteristics, solubility, stability, and compatibility. [7]
API Characterization
A small quantity of Alfuzosin hydrochloride was taken on a butter paper. The drug was viewed under a well-illustrated place and was evaluated for its organoleptic properties i.e. colour, odour and taste.
Determination of Melting Point:
he melting point of Alfuzosin was determined using the capillary method. Alfuzosin fine powder was placed in a glass capillary tube (previously sealed on one end). The capillary tube is placed in the melting point apparatus and magnified. It was discovered that the powder will melt at a certain temperature.
Solubility:
Alfuzosin's solubility was determined in 95% ethanol, chloroform, acetone, ether, water, and 0.1 N HCl. Solubility studies were carried out by dissolving an excess of Alfuzosin in various beakers containing the solvents. The mixtures were shaken at regular intervals for 24 hours. Whatman's filter paper grade no. 41 was used to filter the solutions. The filtered solutions are spectrophotometrically analysed.[8]
Compatibility Studies:
The analysis utilizing Fourier Transform Infrared (FTIR) spectroscopy was performed to characterize the surface structure of the formulated tablets, as well as the pure drug and polymers. The tablets were prepared in a KBr pellet and analyzed using the SHIMADZU 8400s FTIR instrument from Japan. The findings from the FTIR study indicate that there is no interaction between the pure drug and the excipients, with all functional groups present in the IR spectrum of both the pure drug and the excipients being identified. The IR spectra for the pure drug and various excipients were recorded within the range of 4000-400 cm-1 using the KBr disc method. The substance was triturated with an adequate amount of KBr, and a disc with a diameter of 10-15 mm was formed to achieve a spectrum of appropriate intensity using a hydraulic press.
Identification of Alfuzosin HCl:
A 10 µg/ ml solution of Alfuzosin was prepared in 0.1 N HCl, and the UV spectrum was recorded using a Shimadzu UV/Vis double beam spectrophotometer. The solution was scanned in the 200–400 range to determine the lambda maximum absorbed by the drug molecule.
Preparation of Standard Calibration Curve of Alfuzosin HCl:[9]
Method:
Alfuzosin 10mg was precisely weighed and transferred to a 10ml volumetric flask. It was dissolved and diluted to volume with 0.1N HCl to yield a stock solution with a concentration of 100g/ml. The standard stock solution was then serially diluted with 0.1N HCl to achieve a concentration of 5 to 40 µg/ml of Alfuzosin hydrochloride. The absorbances of the solution were measured at 330 nm against 0.1N HCl as a blank using a Shimadzu UV-1800 spectrophotometer. To obtain the standard calibration curve, the absorbance values were plotted against concentration (µg/ml).
Evaluation of Powder Blend:10]
Angle of repose:
blend was accurately weighed and placed in the funnel. The funnel's height was adjusted so that the tip of the funnel just touched the apex of the powder blend. The powder mixture was allowed to freely flow through the funnel and onto the surface. The powder cone's diameter was measured, and the angle of repose was calculated using the following equation (1).
tan h
r
Where, h and r are the height and radius of the powder cone respectively.
Table 3: Angle of repose as an indication of flow properties
|
Angle of repose(?) |
Type of flow |
|
25-30 |
Excellent |
|
31-35 |
Good |
|
36-40 |
Fair |
|
41-45 |
Passable |
|
46-55 |
Poor |
|
56-65 |
Very poor |
|
>66 |
Very very poor |
Bulk density:
The bulk density of the formulated granules was evaluated using a bulk density apparatus. It is the ratio of total mass of powder to the bulk volume of powder. It was measured by pouring the weighed powder into a graduated measuring cylinder and the volume was noted. It is expressed in gm/cc and is given by equation (2) -
Bulk density = Weight of the powder blend
Bulk volume
Tapped density:
It is the ratio of total mass of powder to the tapped volume of powder. The tapped volume was measured by tapping the powder to constant volume. It is expressed in gram/ml and is given by equation (3)
Tapped density = Weight of the powder blend
Tapped volume
Compressibility Index:
Carr's compressibility index was used to calculate the powder blend's Compressibility Index. It is a simple test for determining the bulk density and tapped density of a powder as well as the rate at which it packed down. The formula for Carr’s Index is given in the below equation (4):
Carr's Index(%) =
Tapped density—bulkdensity×100
tapped density
Table 4: Carr’s index as an indication of flow properties
|
Carr’s Index (%) |
Type of flow |
|
?10 |
Excellent |
|
11-15 |
Good |
|
16-20 |
Fair |
|
21-25 |
Passable |
|
26–31 |
Poor |
|
32–37 |
Very poor |
|
>38 |
Very very poor |
Hausner’s Ratio:
It is the ratio of tapped density and bulk density. The Hausner’s ratio of powder blend was calculated by the following equation (5):
Hausner rat
tapped density
bulk density
Table 5: Hausner’s ratio as an indication of flow properties
|
Flow character |
Hausner’s Ratio |
|
Excellent |
1.00-1.11 |
|
Good |
1.12-1.18 |
|
Fair |
1.19-1.25 |
|
Passable |
1.26-1.34 |
|
Poor |
1.35-1.45 |
|
Very poor |
1.46-1.59 |
|
Very very poor |
>1.60 |
Preparation Of Gastro Retentive Floating Tablets:[11]
An effervescent floating tablet containing alfuzosin hydrochloride was developed using the direct compression method. Various formulations were created by adjusting the concentrations of different grades of HPMC polymers, specifically HPMC K4M and HPMC K100M, along with NaHCO3 as a gas-generating agent. Microcrystalline cellulose (MCC) and polyvinylpyrrolidone (PVP) served as the binder and filler, while sodium carboxymethyl cellulose (Na CMC) was incorporated to enhance solubility, and aerosil was included as a moisture-absorbing agent. A total of nine formulations were designed using a 32 full factorial approach, and Design Expert software was employed to determine the most effective formulation. The requisite amounts of the drug and excipients were thoroughly mixed in a mortar, with the lubricant added at the final stage to ensure smooth tablet punching. The powder for each formulation was then compressed using a 10-station rotary tablet punching machine.
Experimental Design: 32 Factorial Design:[12]
The impact of the two primary variables, namely the concentrations of HPMC K4M and HPMC K100M, was assessed concerning the responses (?R, Swelling Index, FLT). HPMC K4M concentrations were tested at 10%, 15%, and 20%, while HPMC K100M concentrations were examined at 35%, 40%, and 45%. A preliminary screening utilized a 32 factorial design (FFD; 2-factor, 3-level) to optimize the alfuzosin FDDS. The FFD was chosen for this investigation due to its ability to produce fewer experimental runs with two factors, making it suitable for exploring quadratic equations, deriving polynomial equations, and generating response surface plots. The experimental design was formulated and analyzed using Design Expert software. Nine batches were prepared according to the FFD, with their compositions detailed in Table no. 8 below. To assess the significance of the experimental model, ANOVA (Analysis of Variance) was conducted.
Table 6: 32 full factorial design
|
Std. |
Run |
Factor 1 |
Factor 2 |
||
|
A: HPMC K4M |
B: HPMC K100M |
||||
|
Coded values |
Conc. (mg) |
Coded values |
Conc. (mg) |
||
|
6 |
1 |
1 |
20 |
0 |
40 |
|
8 |
2 |
0 |
15 |
1 |
45 |
|
9 |
3 |
0 |
15 |
0 |
40 |
|
4 |
4 |
1 |
20 |
1 |
45 |
|
5 |
5 |
-1 |
10 |
0 |
40 |
|
3 |
6 |
-1 |
10 |
1 |
45 |
|
1 |
7 |
-1 |
10 |
-1 |
35 |
|
7 |
8 |
0 |
15 |
-1 |
35 |
|
2 |
9 |
1 |
20 |
-1 |
35 |
Table 7: Formulation table:
|
Ingredients (mg) |
F1 (-1,-1) |
F2 (-1,0) |
F3 (-1,+1) |
F4 (0,-1) |
F5 (0,0) |
F6 (0,+1) |
F7 (+1,-1) |
F8 (+1,0) |
F9 (+1,+1) |
|||
|
Drug |
10 |
10 |
10 |
10 |
10 |
10 |
10 |
10 |
10 |
|||
|
HPMC K4M |
10 |
10 |
10 |
15 |
15 |
15 |
20 |
20 |
20 |
|||
|
HPMC K100M |
35 |
40 |
45 |
35 |
40 |
45 |
35 |
40 |
45 |
|||
|
NaHCO3 |
20 |
20 |
20 |
20 |
20 |
20 |
20 |
20 |
20 |
|||
|
Na CMC |
10 |
10 |
10 |
10 |
10 |
10 |
10 |
10 |
10 |
|||
|
MCC |
34 |
29 |
24 |
29 |
24 |
19 |
24 |
19 |
14 |
|||
|
PVP K30 |
7 |
7 |
7 |
7 |
7 |
7 |
7 |
7 |
7 |
|||
|
Aerosil |
2 |
2 |
2 |
2 |
2 |
2 |
2 |
2 |
2 |
|||
|
Magnesium stearate |
2 |
2 |
2 |
2 |
2 |
2 |
2 |
2 |
2 |
|||
|
Total weight |
130 |
130 |
130 |
130 |
130 |
130 |
130 |
130 |
130 |
|||
Weight variation test:
To investigate weight variation using an electronic balance, ten tablets of the formulation were weighed, and the test was carried out in accordance with the official method. To check for weight variation, ten tablets from each batch were weighed individually, and the difference has been calculated by the following equation (6).
Weigh variation initial weight — final
weight final wei× 100
Drug content:
Three tablets were individually weighed and powdered. The powder equivalent to the average weight of tablets was weighed, and the drug was extracted in 0.1 N HCl. The drug content was determined at 330nm absorbance using a Shimadzu UV-1800 double beam spectrophotometer after suitable dilution. The equation (7) is best suitable to calculate the drug content.
Drug content = concentration × Dilution factor
% Drug content = Drug content (mg) × 100
label claim (mg)
Hardness:
The resistance of the tablet to chipping, abrasion or breakage under conditions of storage, transportation and handling usage depend on its hardness. The different tablet hardness tester instruments are:
•Monsanto Hardness tester
•Strong Cobb hardness tester
•Pfizer hardness tester
•Schleuniger apparatus
•Erweka tester
Select 10 tablets randomly and the hardness was determined using the instrument, Pfizer hardness tester. Three tablets were chosen at random, and their hardness was measured. The hardness at which the tablet crushes is the hardness of the tablet. Units of hardness is kg/cm2.
Thickness:
Vernier callipers were used to measure the thickness of the tablets. Three tablets were chosen at random, and average values were computed.
Friability Test:
The Roche Friabilator was used to determine the friability of tablets. It is given as a percentage (%). Tablets weighing 1.3 gm were taken and weighed (W0) before being placed in the friabilator. The friabilator was run at 25rpm for 4 minutes or 100 revolutions. The tablets were weighed once more (Wf). The % friability was then calculated by following equation (8).m% Friability W0 — Wƒ × 100 W0
Tablets with a friability of less than 1% are considered acceptable.
In vitro buoyancy studies:
The floating lag time method described by Dave B.S. was used to determine in vitro buoyancy. The tablets were immersed in a 250 ml beaker of 0.1 N HCl. The floating lag time was calculated as the time it took for the tablets to rise to the surface and float. The time between the introduction of the dosage form and its buoyancy in 0.1 N HCl, as well as the time the dosage form remained buoyant, were measured. The time it takes for the dosage form to emerge on the surface of the medium is known as Floating Lag Time (FLT) or Buoyancy Lag Time (BLT), and the total duration of time the dosage form remains buoyant is known as Total Floating Time (TFT).[13]
In Vitro dissolution studies:
The dissolution testing apparatus II, according to The United States Pharmacopoeia (USP) XXIV, was utilized to evaluate the release kinetics of Alfuzosin from floating tablets. The dissolution test was performed with 900 ml of 0.1 N HCl maintained at 37±0.5 °C and agitated at 100 rpm. At various time points, a 5 ml aliquot of the solution was withdrawn from the apparatus and replaced with an equal volume of fresh, pre-warmed dissolution medium. The withdrawn sample was subsequently diluted to 10 ml with 0.1 N HCl in a suitable volumetric flask. The absorbance of these diluted solutions was recorded at 330 nm using a Shimadzu UV-1800 double beam spectrophotometer. The cumulative percentage of drug release was determined using the equation obtained from a standard curve.[14]
Swelling index:
Swelling index test enables us to know the relative absorption capacity of polymers and also gives an idea about their integrity properties after moisture absorption. The initial weight (W0) of each formulation was taken and these formulations were placed in a petri plate containing 20ml of HCl buffer pH 1.2. The plates were kept at a room temperature. After each hour, the tablets were taken out and the excess of water wiped off using filter paper on the surface of the tablet up to 8 hrs. At each time interval the swollen tablets were re-weighed (Wt). Swelling index was calculated by the following equation (9):[15]
Swelling index (W ) = Wt– W0 × 100
W0
Where, Wt = Weight of tablet at time t.
W0 = Initial weight of tablet.
Different models are used to regard dissolution data:[16]
To analyze the mechanism of drug release from the floating tablet, the data obtained from the drug release studies was analyzed according to the following equations.
Zero order model:
Qt=Q0+ k0t (equation 10)
Where,
Qt = The amount of drug dissolved in time t Q0 = initial amount of drug in the solution K0 = zero order release constant (hr-1)
R2 value near to 1 of plot amount of drug release vs time indicates zero order release mechanism.
Qt = Q0e-kt (equation 11) Log Qt = Log Q0 + Kt/2.303 where,
Qt = The amount of drug dissolved in time t Q0 = initial amount of drug in the solution K = first order release constant (hr-1)
A straight line is obtained when the data is plotted as log cumulative percent drug remaining versus time, indicating that the release follows first order kinetics. By multiplying 2.303 by the slope values, you can get the constant K.
R2 value near to 1 of plot log % ARR (Amount remaining to release) vs time indicates first order release.
The Higuchi model was developed for several theoretical models to study the release of water soluble and water low soluble drugs in semisolid and/or solid matrices. For drug particles dispersed in a uniform matrix acting as a diffusion medium, mathematical expressions are obtained. And the equation is as follows:
Qt = KH t1/2 (equation 12)
where,
Qt = The amount of drug dissolved in time t KH = Higuchi dissolution constant
R2 value near to 1 of plot log % of drug release vs square root of time indicates anomalous release.
log (Qt/Q?) =log k+ n log t (equation 13)
In all of the above equations, Qt represents the amount of drug released at time t, Q represents the total amount of drug in the dosage form, k0 represents the zero order release rate constant, k1 represents the first order release rate constant, KH represents the Higuchi square root of time release rate constant, k is a constant that depends on the geometry of the dosage form, and is the diffusion exponent indicating the mechanism of drug release.[17]
Stability Studies:
For all the pharmaceutical dosage forms it is important to determine the stability of the dosage form. This will include storage at both normal and exaggerated temperature conditions, with the necessary extrapolations to ensure the product over its designed shelf life, provide medication for absorption at the same rate as when originally formulated. The design of the formal stability studies for the drug product should be based on the knowledge of the behaviour and properties of the drug substance and formal stability studies on the drug substance. Specification which is list of test, reference to the analytical procedures and proposed acceptance criteria, including the concept of different acceptable criteria for release and shelf life specifications, is addressed in ICH Q1A. These studies also deal with study of product related factors that influences its quality, safety and efficacy like for example container closure systems, interaction of drug with excipients and packaging materials. Stability tests on drug and dosage forms are conducted by means of real time and long-term tests at specific temperatures and relative humidity representing the storage conditions experienced in the distribution chain of the climatic zones of the country or the region concerned.[18] The optimised formulations were packed appropriately and kept in a stability chamber under the following conditions for a period as prescribed by ICH Q1A guidelines to conduct the studies at 40 ±1°C and RH 75% ± 5%. The samples were analysed at 30, 60, and 90-day intervals for physiochemical and in-vitro drug release parameters.
Rationale for stability studies:
Table 8: ICH guidelines for stability study
|
Study |
Storage condition |
Minimum time |
|
|
Temperature |
Relative humidity (%) |
||
|
Long term |
250C±20C |
60% ±5% RH |
12 Months |
|
Intermediate |
300±20C |
65%±5% RH |
6 Months |
|
Accelerated |
400±20C |
75%±5% RH |
3 Months |
The Floating drug delivery system (FDDS) is an oral dosage form designed to prolong the residence time of the dosage form within the GIT. It is a drug formulation that contains gel-forming hydrocolloids to keep the drug buoyant in the stomach contents. Drug dissolution and release from the dosage form is retained in the stomach fluids occur at acidic pH in the stomach under fairly controlled conditions. Hydro dynamically balanced tablets of Alfuzosin (gastro retentive drug delivery systems) were prepared and evaluated to increase its bioavailability and reduce dosing frequencies. In the present study 9 formulations with variable concentration of polymer were prepared and evaluated for physico-chemical parameters, in vitro buoyancy studies, in vitro release studies, swelling index and stability studies. The formulated batches were shown in the table 8.
Preformulation studies [19]
Standard solution of Alfuzosin hydrochloride of concentration 10?g/ml was scanned over the wavelength range of 400 nm to 200 nm. At 239, 292 and 330 nm wavelength, lambda maximum peaks of Alfuzosin were observed and the solution shows maximum absorbance ( ? max) at 330 nm.
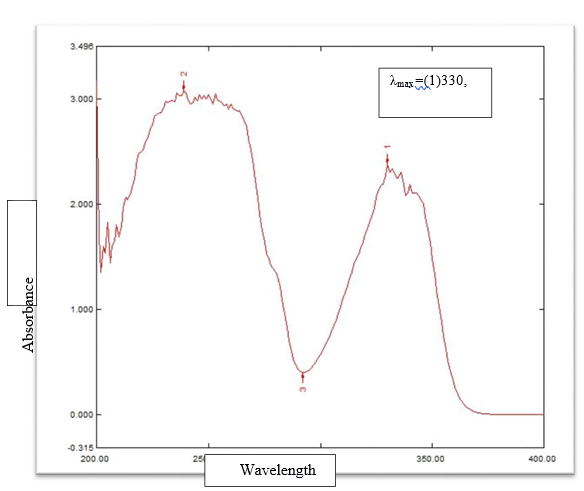
Figure 1: ?max detreminatiion in UV spectrophotometer
Table 9 : Organoleptic properties of Alfuzosin hydrochloride
|
Test |
Specification |
Observations |
|
Colour |
White |
White |
|
Taste |
Slightly bitter to pungent |
Bitter |
|
Odour |
Odourless |
Odourless |
The colour, taste and odour of Alfuzosin hydrochloride comply with the information given in the various literature sources. The preliminary studies of the drug are very important step because if the product does not have acceptable colour, flavour and taste the patient would try to avoid using it.
Melting Point Determination
Melting point of Alfuzosin was found to be in the range 225-235 0C, which complied with IP standards, indicating purity of the drug sample.
Solubility
Alfuzosin was found to exhibit pH depended solubility, the drug is sparingly soluble in water (92 mg/L). Organic solvents such as ethanol and DMSO, which should be purged with an inert gas, are soluble in alfuzosin. Alfuzosin (hydrochloride) is soluble in these solvents at about 1 mg/ml.
Table 10: standard curve of Alfuzosin hydrochloride
|
Concentration (µg/ml) |
Absorbance |
|
0 |
0 |
|
5 |
0.157 |
|
10 |
0.267 |
|
15 |
0.376 |
|
20 |
0.567 |
|
25 |
0.676 |
|
30 |
0.704 |
|
35 |
0.855 |
|
40 |
0.987 |
The scanning of drug solution in UV region (200–400 nm) to find out the wavelength of maximum absorption (? max). The ? max was found to be at, 239, 292 and 330 nm. So, the Standard calibration curve of Alfuzosin was developed at these wave lengths. The standard calibration curve of Alfuzosin was determined in 0.1 N HCl, by plotting absorbance against concentration at 330 nm and it follows the Beer’s law. The calibration curve was linear between 5 – 40 ?g/ml concentration ranges. Results were tabulated in table no 11. Plotted in fig. no. 9. The R and slope were found to be 0.9952and 0.0233 respectively in 0.1 N HCl.
Figure 9: Calibration curve of Alfuzosin hydrochloride Standard Curve Equation: y = 0.0233x + 0.021
Where, y = absorbance and x = concentration
Compatibility Studies:
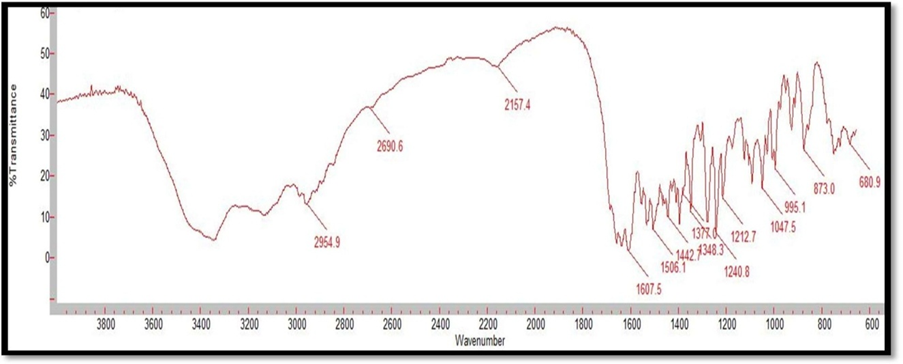
Figure 2: FTIR Spectrum of Alfuzosin HCl
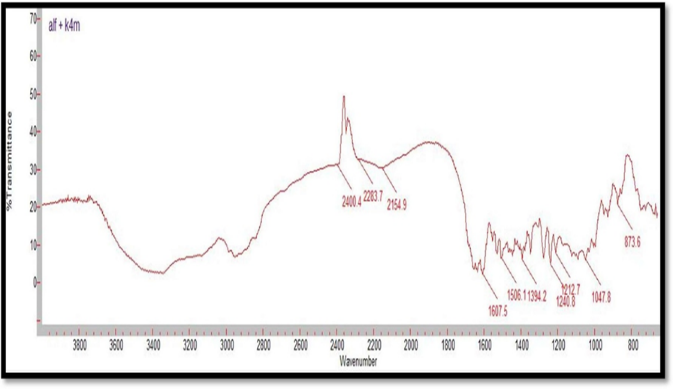
Figure 3: FTIR Spectrum of Alfuzosin HCl and HPMC K4M
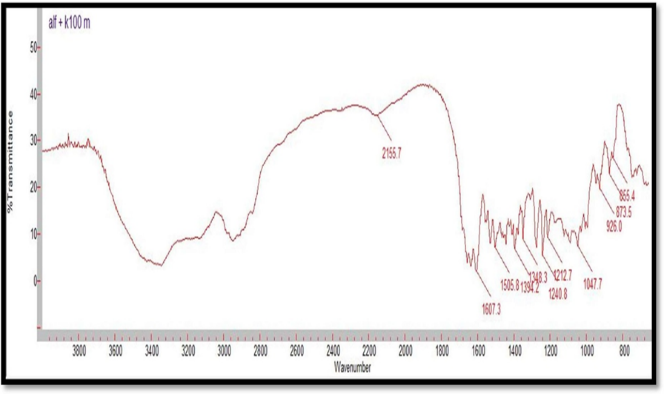
Figure 4: FTIR Spectrum of Alfuzosin HCl and HPMC K100M
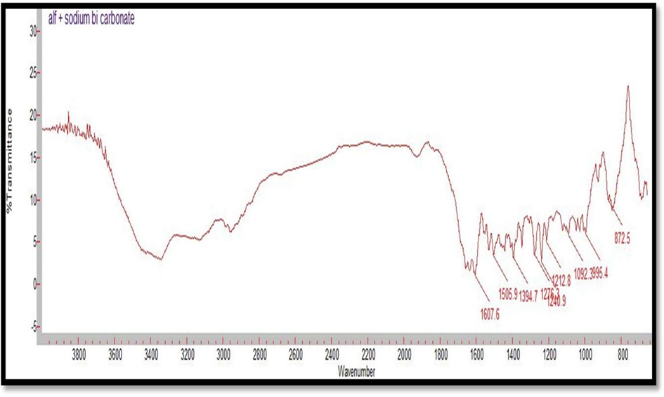
Figure 5: FTIR Spectrum of Alfuzosin HCl and NaHCO3
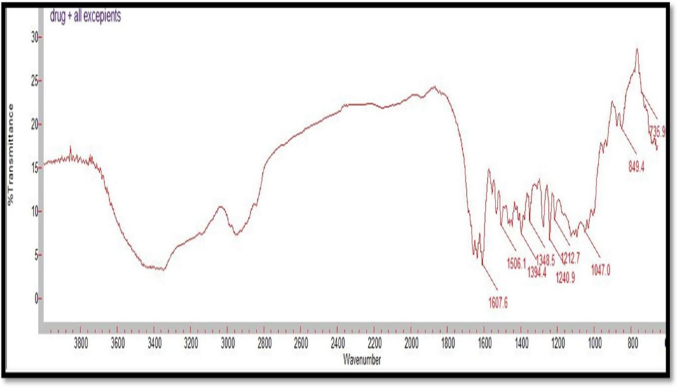
Figure 06: FTIR Spectrum of Alfuzosin HCl and all excipients
Table 11: FT-IR spectra- Interpretation and comparison of Alfuzosin
|
Functional group and vibration |
Reported Frequencies range(cm-1) |
Pure drug (cm-1) |
Drug + HPMC K4M(cm-1) |
Drug + HPMC K100M (cm-1) |
Drug+NaHCO3 (cm-1) |
Drug + All excipients (cm-1) |
|
-COOH group |
1720-1760 |
1731 |
1732 |
1727 |
1732 |
1733 |
|
-NO Stretching |
1500-1550 |
1506.1 |
1510 |
1525 |
1532 |
1538 |
|
-OH Bending |
1395-1440 |
1400 |
1421 |
1425 |
1428 |
1433 |
|
-C=O Stretching |
1650-1685 |
1661 |
1663 |
1655 |
1663 |
1652 |
|
-OH Stretching |
3550-3700 |
3584 |
3554 |
3571 |
3566 |
3570 |
|
-NH Stretching |
3330-3500 |
3420 |
3427 |
3438 |
3440 |
3445 |
Compatibility studies were performed using IR spectrophotometer. The IR spectrum of a pure drug as well as a physical mixture of drug and polymers was investigated. The characteristic absorption peaks of Alfuzosin were obtained at ~1421 cm?1, ~1510 cm?1, ~1655 cm?1, ~1732 cm?1, ~3420 cm?1, ~3566 cm?1. The interactions between drug excipients are crucial for the release of the drug from its formulation. This study revealed that there are no chemical interactions between Alfuzosin and the excipients utilized. The data presented in Figures 10, 11, 12, 13, and 14 demonstrate that the primary peaks in the IR spectra of the drug and polymer mixture remained unchanged, suggesting that there were no interactions between the drug and the polymers or excipients. The peaks observed in the spectra of each polymer align with those found in the drug spectrum. A comparison of the spectrum of the pure drug with that of the drug combined with excipients showed no significant interactions, and the characteristic peaks of both the drug and excipients remained unaffected. Therefore, it can be concluded that the selected excipients for the formulations are compatible with the drug.
: Micrometric properties of powder blend
|
Table 12: Micrometric properties of powder blend |
|||||
|
Formulation |
Bulk density (gm/cc) |
Tapped density (gm/cc) |
Compressibility index (%) |
Hausner’s ratio |
Angle of repose (?) |
|
F1 |
0.454 |
0.520 |
13.46 |
1.15 |
28.80 |
|
F2 |
0.476 |
0.556 |
14.38 |
1.16 |
30.90 |
|
F3 |
0.454 |
0.588 |
22.78 |
1.29 |
32.21 |
|
F4 |
0.476 |
0.588 |
19.04 |
1.23 |
29.60 |
|
F5 |
0.477 |
0.526 |
8.50 |
1.10 |
27.47 |
|
F6 |
0.454 |
0.500 |
9.20 |
1.11 |
27.92 |
|
F7 |
0.455 |
0.526 |
13.68 |
1.15 |
31.79 |
|
F8 |
0.486 |
0.556 |
18.34 |
1.22 |
31.38 |
|
F9 |
0.454 |
0.500 |
9.20 |
1.11 |
32.60 |
Angle of Repose (?)
The angle of repose for the formulated blend was carried out and the results were shown in table 12. It concludes all the formulations blend was found to be in the range 32.600' to 27.470 which indicates good flow property.
Bulk density (gm/cm3)
The bulk density for the formulated blend was carried out and the results were shown in table 13. It can be concluded that all the formulation was found in the range of 0.454 to 0.486 which indicates good flow property.
Tapped density (gm/cm3)
The tapped density for the formulated blend was carried out and the results were shown in table 13. It can be concluded that all the formulation was found in the range of 0.500 to 0.588 which indicates good flow property
Compressibility Index (%)
Compressibility index was carried out, and was found between 8.50 and 22.78 indicating the powder blend has the required flow property for compression as mentioned in table no. 13.
Hausner’s Ratio
In figure 13, the Hausner ratios was found between 1.10 and 1.29. Thus indicating good flow property.
Table 13: Study design: 32 FFD
|
Std |
Run |
Factor 1 |
Factor 2 |
Response 1 |
Response 2 |
Response 3 |
|
A:HPMC K4M |
B:HPMC K100M |
% drug Release |
Swelling index |
FLT |
||
|
|
|
Mg |
Mg |
% |
% |
Secs |
|
6 |
1 |
1 |
0 |
52.9 |
382.3 |
14.55 |
|
8 |
2 |
0 |
1 |
58.5 |
379.69 |
11.09 |
|
9 |
3 |
0 |
0 |
63 |
369.53 |
10.35 |
|
4 |
4 |
1 |
1 |
49.6 |
399.23 |
16.16 |
|
5 |
5 |
-1 |
0 |
71.5 |
384.37 |
9.15 |
|
3 |
6 |
-1 |
1 |
69.8 |
370.62 |
8.5 |
|
1 |
7 |
-1 |
-1 |
74.4 |
354.72 |
7.3 |
|
7 |
8 |
0 |
-1 |
67.3 |
351.25 |
9.44 |
|
2 |
9 |
1 |
-1 |
56.1 |
367.36 |
13.2 |
The 2 factor, 3 level FFD was used to systematically explore the main, quadratic and interaction effects of each individual factor on the responses. The ‘+’ sign indicate the highest value of the factor considered and ‘0’ sign imply to the intermediate value whereas ‘-’ sign specify to the lowest value of the factor considered or the independent variables. Experimental runs were conducted, and the results are shown in the figure 15, 16, 17. The 3D response surface plots were used to enumerate the interaction and correlation between factors and the measured responses. ANOVA was used to carry out the data analysis and estimation of the quantitative effect of the factors. All the formulations showed minimum 8 hrs floating time, hence % swelling index, ?R and FLT were considered as the responses.
Study of Swelling Index by Response Surface Methodology:
: (a) Response surface plot showing influence of HPMC K4M and HPMC K100M on swelling index. (b) corresponding contour plot showing the relationship between different levels of two polymers. The profound effect of concentration of the HPMC K4M and HPMC K100M on the swelling index of the formulation. The counter plot clearly indicates that the swelling index is increased with increase in concentration of HPMC K4M and HPMC K100M. From the formulations containing HPMC K4M and HPMC K100M, it was observed that the optimized floating and swelling index was obtained with the formulation F5. From the swelling index study of F1–F9, it was observed that formulations containing high concentration of HPMC K4M and HPMC K100M show more swelling index. Maximum swelling index was observed with F9 containing maximum concentration of both the polymers. Besides minimum swelling index was observed with F1 containing lowest concentration of both the polymers.
Study of Drug Release by Response Surface Methods
(1) Response surface plot showing influence of HPMC K4M and HPMC K100M on ?R
(2) corresponding contour plot showing the relationship between different levels of two polymers. ?R is the important response that determines the drug release and bioavailability of any formulation. It was found out that conc. of polymers affected the ?R. The figure below
represent the effect of the polymer concentration of HPMC K4M and HPMC K100M on the ?R of the formulation. The formulations containing HPMC K4M and HPMC K100M, it has been observed that the optimized floating and ?R was obtained with the formulation F5. From the ?R study of F1–F9, it was observed that formulations containing high concentration of HPMC K4M and HPMC K100M show less ?R. Minimum ?R was observed with F9 containing maximum concentration of both the polymers.
Study of Floating lag Time by Response Surface Methodology:
(1) Response surface plot showing influence of HPMC K4M and HPMC K100M on floating lag time (2) corresponding contour plot showing the relationship between different levels of two polymers. FLT is significant for any Floating formulation as long FLT may result in flushing of formulation into intestine due to contraction in stomach, hence leading to improper release of drug and poor bioavailability. The mean FLT developed according to 32 FFD was in the range of 5–20 seconds. NaHCO3 has a significant effect of on FLT, as the concentration of polymers (HPMC K4M and HPMC K100M) changes and the concentration of sodium bicarbonate was maintained constant. However variation in the concentration of polymers had shown significant changes in Floating time. The plots indicates that optimum floating lag time was obtained with formulation F5.
|
Table 14: Evaluation of Physical Parameters of Floating Tablets |
|||||||
|
Formal ation |
Weight variation (%) |
Hardness (kg/cm2) |
Friability (%) |
Swelling index at 8th hour (%) |
Dissolution at 8th Hour (%) |
Floating lag time (seconds) |
Drug content (%) |
|
F1 |
± 1.75 |
4.5 |
0.375 |
314.72 |
73.4 |
6.30 |
81.5 |
|
F2 |
±3.52 |
4.2 |
0.521 |
334.37 |
69.5 |
7.15 |
77.2 |
|
F3 |
±2.15 |
5.0 |
0.519 |
360.62 |
66.8 |
7.50 |
73.8 |
|
F4 |
±1.56 |
5.2 |
0.445 |
331.25 |
64.3 |
8.44 |
71.2 |
|
F5 |
±3.54 |
4.9 |
0.369 |
339.53 |
61 |
9.35 |
67.8 |
|
F6 |
±1.42 |
5.6 |
0.451 |
377.69 |
57.5 |
10.09 |
64.2 |
|
F7 |
±2.11 |
4.6 |
0.517 |
357.69 |
54.1 |
12.2 |
60.08 |
|
F8 |
±1.89 |
5.3 |
0.377 |
372.30 |
50.9 |
13.55 |
56.65 |
Evaluation of Tablets Shape of the tablet
All tablets from F1 to F9 were found to be circular shape with no cracks.
Hardness test
The measured hardness of tablets of each batch ranged between 4 to 6 kg/cm characteristics of all batches.
Friability
The values of friability test were tabulated in Table 15. The % friability was less than 1% in all the formulations ensuring that the tablets were mechanically stable.
Weight Variation Test
The percentage weight variations for all formulations were tabulated in Table 15. All the formulated (F1 to F9) tablets passed weight variation test as the % weight variation was within the pharmacopoeial limits of ±5 % of the weight. The weights of all the tablets were found to be uniform with low standard deviation values.
Drug Content Uniformity
The percentage of drug content for F1 to F9 was found to 53.21 to 81.5 % of Alfuzosin at the end of 8th hour it complies with official specifications. The results were shown in Table 14.
Cumulative % drug release of all the 9 formulation
|
Table 15: Effect of different polymer conc. on drug release by paddle method |
|||||||||
|
Cumulative % Drug release in 0.1 N HCL |
|||||||||
|
Time (hrs.) |
F1 |
F2 |
F3 |
F4 |
F5 |
F6 |
F7 |
F8 |
F9 |
|
0 |
0.0 |
0.0 |
0.0 |
0.0 |
0.0 |
0.0 |
0.0 |
0.0 |
0.0 |
|
1 |
30.1 |
46.4 |
21.6 |
26.3 |
31.7 |
20.9 |
29.4 |
23.2 |
20.9 |
|
2 |
34 |
49.4 |
27 |
32.4 |
37.9 |
25.5 |
33.2 |
27 |
27.8 |
|
3 |
39.4 |
51.8 |
35.5 |
37.9 |
44 |
30.9 |
37.9 |
30 |
30.9 |
|
4 |
47.9 |
54.1 |
44.8 |
s43.3 |
48.7 |
34.8 |
41.7 |
33.2 |
34 |
|
5 |
54.8 |
56.4 |
49.4 |
47.9 |
51.8 |
39.4 |
44.8 |
37.1 |
37.1 |
|
6 |
60.3 |
60.3 |
57.2 |
53.3 |
55.6 |
43.3 |
47.9 |
39.4 |
40.2 |
|
7 |
68.8 |
64.9 |
61 |
57.2 |
59.6 |
49.4 |
51.8 |
41.7 |
43.3 |
|
8 |
73.4 |
69.5 |
66.8 |
64.1 |
61 |
57.9 |
54.1 |
51 |
47.9 |
|
FLT (sec.) |
6.30 |
7.15 |
7.50 |
8.44 |
9.35 |
10.09 |
12.2 |
13.55 |
15.16 |
|
TFT (hrs.) |
>8 |
>8 |
>8 |
>8 |
>8 |
>8 |
>8 |
>8 |
>8 |
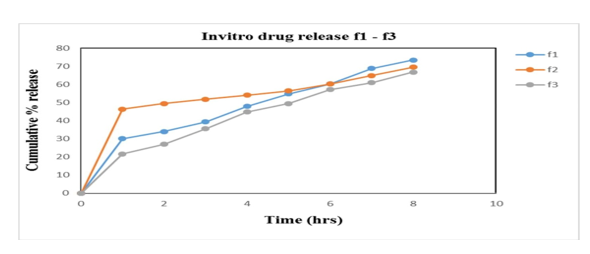
Figure 7: % cumulative drug release f1-f3
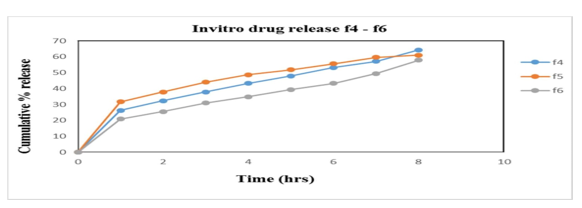
Figure 8: % cumulative drug release f4-f6
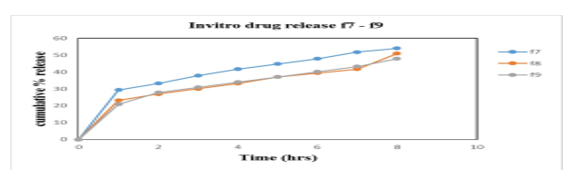
Figure 9: % cumulative drug release f7-f9
Invitro Drug Release Studies [20]
In vitro studies were carried out in HCl buffer pH 1.2 solution. The in vitro data for all Alfuzosin HCl formulations are given in the results and represented by the graphs. Studies are performed by using USP Dissolution apparatus type II (Paddle type) with a 900ml of dissolution medium at a constant temperature of 37?±0.5?C with 100 rpm. Samples were withdrawn and analysed in UV Spectrophotometer at 330nm. The influence of hydrophilic polymers as HPMC K4M & HPMC K100M and gas generating agent NaHCO3, responsible for floating of tablet was studied. The release data obtained for formulations F1 to F9 were tabulated in table 15 and figure 18, 19, 20 shows the plot of cumulative % drug released as a function of time for different formulations. The in vitro release of all nine batches of floating tablets showed the release with an initial effect. In the first hour % drug released were 30.1; 46.4; 21.6; 26.3; 31.7; 20.9; 24.9, 23.2 and 20.9 for F1, F2, F3, F4, F5, F6, F7, F8 and F9 respectively. So, the comparison of drug release is made from the formulations F1-F9. From the in-vitro dissolution data it was found that formulation F1 and F2 released more drug before 8th hrs of the study indicating that the polymer amount is not enough to control the drug release. While F3, F4, F6, F8 and F9 did not show any burst release at the 1st hour. F7 showed burst release at the initial hour whereas very less release had been observed at the end of 8 hrs. F5 had better controlled release of 61% at 8th hours which is better than the other formulations and is considered to be an optimised formulation. Thus, it can be concluded that the release of Alfuzosin Hydrochloride from the floating tablets was found to be decreased when the polymer concentration was increased i.e. when the HPMC K4M and HPMC K100M was increased the drug release was decreased this may be due to high cross-linked polymer that swells and does not disintegrate easily, because of the structure the release rate from the formulations may be delayed. On the other hand, it was proved that decrease in the polymer concentration leads to increase in drug release as the polymer can’t withstand the drug release.
Release kinetics:
Table 16: Mathematical Model Fitting for obtained drug release
|
Formulations |
Zero order R2 |
First order R2 |
Higuchi R2 |
Hixon Crowell R2 |
Korsmeyer Peppas |
|
|
R2 |
N |
|||||
|
F1 |
0.9952 |
0.9754 |
0.9674 |
0.9568 |
0.51 |
1.55 |
|
F2 |
0.9783 |
0.9495 |
0.9296 |
0.7385 |
0.3835 |
1.53 |
|
F3 |
0.9898 |
0.9969 |
0.9894 |
0.9564 |
0.427 |
1.52 |
|
F4 |
0.9976 |
0.9881 |
0.9851 |
0.9071 |
0.4039 |
1.40 |
|
F5 |
0.9791 |
0.9917 |
0.9972 |
0.8066 |
0.392 |
1.40 |
|
F6 |
0.9874 |
0.9596 |
0.9527 |
0.928 |
0.412 |
1.35 |
|
F7 |
0.9941 |
0.9985 |
0.9931 |
0.8002 |
0.393 |
1.35 |
|
F8 |
0.966 |
0.9396 |
0.9299 |
0.848 |
0.401 |
1.30 |
|
F9 |
0.9853 |
0.9893 |
0.9881 |
0.8255 |
0.3979 |
1.30 |
Table 17: Significance of n Value
|
‘n’ |
Mechanism |
|
0.5 |
Fickian Diffusion |
|
0.5 |
Non- fickian diffusion |
|
1 |
Case II transport |
|
>1 |
Super case II transport |
Release Kinetics
The selection of the best batch depends on % swelling index, % cumulative drug release and floating lag time from the formulation. The best f ormulation was det ermined to be F 5 . It acquired optimum swelling, FLT and % drug release as compared to other formulations. F5 show % swelling 339.53%, ?R 61% and FLT 9.35 seconds at the end of 8th hour, which may give complete release in 12 to 14 hrs. So the F5 was selected as best formulation.
The goal of stability testing is to produce evidence on how the quality of a drug substance or drug product changes over time as a result environmental factors like temperature, humidity and light, and enables recommended storage condition, re- test periods and shelf lives to be established. In the present study, the stability studies were carried out for formulation F5.
Table 18: Stability studies of floating tablets of Alfuzosin at 40 °C/ 75% RH of selected Formulation (F5).
|
SL. No |
Tests |
Specification |
Formulation (F5) |
||
|
1 Month |
2 month |
3 Month |
|||
|
1. |
Hardness (kg/cm2) |
4.0 - 6.0 kg/cm2 |
5.8 |
5.5 |
4.9 |
|
2. |
FLT |
8 – 10 seconds |
9 |
8.5 |
8.3 |
|
3. |
?R |
1 |
30.1 |
28.6 |
29.4 |
|
|
|
2 |
36.3 |
35.5 |
36.3 |
|
|
|
4 |
47.9 |
45.6 |
46.4 |
|
|
|
8 |
60.3 |
58.7 |
57.9 |
|
4. |
% swelling index |
1 |
203.52 |
201.99 |
200.52 |
|
|
|
2 |
250.47 |
247.02 |
245.43 |
|
|
|
4 |
300.41 |
298.87 |
299.01 |
|
|
|
8 |
338.20 |
335.66 |
336.78 |
Stability studies were carried out for the optimised formulation as shown in table 18. F5, for a period of 3 months for hardness % drug release, swelling index and floating lag time. The results revealed that they were in the limits throughout the study, therefore it was concluded that the formulation is stable.
CONCLUSIONS
Alfuzosin hydrochloride, a compound belonging to the quinazoline class, serves as a peripheral vasodilator in the treatment of Benign Prostatic Hyperplasia (BPH). It acts by selectively binding to and antagonizing alpha-1-adrenergic receptors in the smooth muscle of the bladder neck and prostate, which leads to the relaxation of these muscles and alleviates the obstruction and urethral resistance commonly experienced in BPH and prostate cancer. The drug exhibits an oral bioavailability of 49% and a half-life of approximately 10 hours, making it a suitable candidate for the development and evaluation of floating drug delivery systems for BPH management. This study is centered on the formulation of Alfuzosin Hydrochloride, utilizing various concentrations of hydrophilic polymers. Floating tablets of Alfuzosin were produced through the direct compression method. The findings indicate that the release and floating characteristics of the developed formulations can be effectively regulated by adjusting the polymer concentration ratios within the formulation. Preformulation investigations for the active pharmaceutical ingredient (API) encompassed characterization of its organoleptic properties, solubility, and melting points, all of which were found to be within the acceptable limits. The drug was analyzed at its analytical wavelength, and a calibration curve was established. Excipients were carefully selected, and compatibility studies were conducted using Fourier Transform Infrared Spectroscopy (FTIR). The results of these compatibility studies revealed no significant interactions between the drug and the excipients, confirming their compatibility. The powdered blend of various formulations, each with differing concentrations of excipients, was analyzed to assess their flow properties. All formulations demonstrated satisfactory flow characteristics. The floating tablets underwent evaluation based on several parameters, including hardness, friability, thickness, swelling index, in vitro studies, and floating lag time. Considering all physical parameters, the F5 formulation exhibited controlled release properties in comparison to the other formulations. The optimized formulation, F5, was subjected to stability studies under various conditions in accordance with ICH guidelines for duration of three months. It was assessed for hardness, swelling index, in vitro buoyancy studies, and in vitro drug release. The results indicated that the formulation remained stable, showing no physical or chemical changes throughout the three-month stability study. Based on these findings, it can be concluded that the Alfuzosin hydrochloride floating tablets, formulated with hydrophilic polymers and other excipients, effectively demonstrated controlled release properties and prolonged residence time. Therefore, the Alfuzosin hydrochloride floating tablet presents a viable alternative to existing tablet formulations, offering the added benefit of reduced frequency of administration, thereby improving patient compliance.
REFERENCES


Nafeesa Roza*1, Dr. Kaushal Kishore, Chandrul2, M.D. Zulphakar Ali, Formulation And Evaluation of Gastroretentive Floating Tablet of Alfuzosin Hydrochloride, Int. J. of Pharm. Sci., 2024, Vol 2, Issue 12, 3029-3048. https://doi.org/10.5281/zenodo.14550902
 10.5281/zenodo.14550902
