Mount Zion College of Pharmaceutical Sciences and Research, Adoor
Aspirin (acetylsalicylic acid) is a widely used drug with poor water solubility, which limits its analysis using conventional methods that rely on toxic organic solvents. This study aimed to develop a simple, accurate, and eco-friendly UV spectrophotometric method for estimating aspirin using hydrotropic solubilization with safe agents such as sodium benzoate and urea. Forced degradation studies were performed under thermal, pH, and concentration stress conditions to assess stability, and method optimization was carried out using a Quality by Design (QbD) approach with Box-Behnken design. The developed method demonstrated good linearity, precision, accuracy, and robustness, effectively monitoring aspirin stability while eliminating the need for harmful solvents. Hydrotropic solubilization combined with UV spectroscopy offers a cost-effective, environmentally friendly, and reliable approach for routine pharmaceutical analysis of poorly soluble drugs.
Currently, a drag encountered by everyone in the development of a product is the poor solubility of drug1. The main reason for the failure of new drug development is the poor biopharmaceutics properties like water insolubility. Solubility is the most important physicochemical properties of dug development2. More than a third of the drugs mentioned in USP currently fall into groups of poor aqueous soluble drugs. About 41% of failures in the production of new drugs are water insoluble.1
In order to increase the solubility of poorly water-soluble drugs, organic solvents such as methanol, chloroform, dimethyl formamide and acetonitrile are used. The disadvantage of these organic solvents includes high cost, volatility, pollution potential, and toxicity, which may lead to issues such as nephrotoxicity or teratogenicity. They can be harmful if ingested, inhaled, or absorbed through skin3. Hydrotropic solubilization concepts may be a proper choice to preclude the use of organic solvents4.
Analytical method development is the process of selecting and optimizing analytical methods to measure a specific attribute of a drug substance or drug product. Analytical methods are critical tools for ensuring the quality, safety and efficacy of pharmaceutical products in the drug development process5.
UV spectroscopy is an analytical technique that measures the number of discrete wavelengths of UV or visible light absorbed by or transmitted through a sample compared to a reference or a blank sample. The sample composition influences this property, potentially providing information on what is in the sample and at what concentration6.
Hydrotropic Solubilization Technique is used for enhancing solubility of poorly soluble drugs. Hydrotropy can be defined as a phenomenon which involves the solubilization where incorporation of a large amount of another solvent termed as co-solvent with aqueous phase contributes in an increase in aqueous solubility of that solute7.
The term hydrotropy was coined by Neuberg in 1916 to describe the enhancement of solubility of a solute by adding a high concentration of alkali metals also several organic acids, eg: sodium benzoate, sodium citrate, urea, niacin/nicotinamide, PEG etc8. The Mechanism involves that each hydrotrope has a distinct affinity for a particular component of the mixture, which facilitates easy restoration of the hydrotrope arrangement via controlled water weakening. The emergence of organized collection of hydrotrope particle could be the reason for natural agents to enhance the solvency of solute in water4.Hydrotropes are widely used in drug solubilization, detergent formulation, health care and household applications as well as for being an extraction agent for fragrances9.
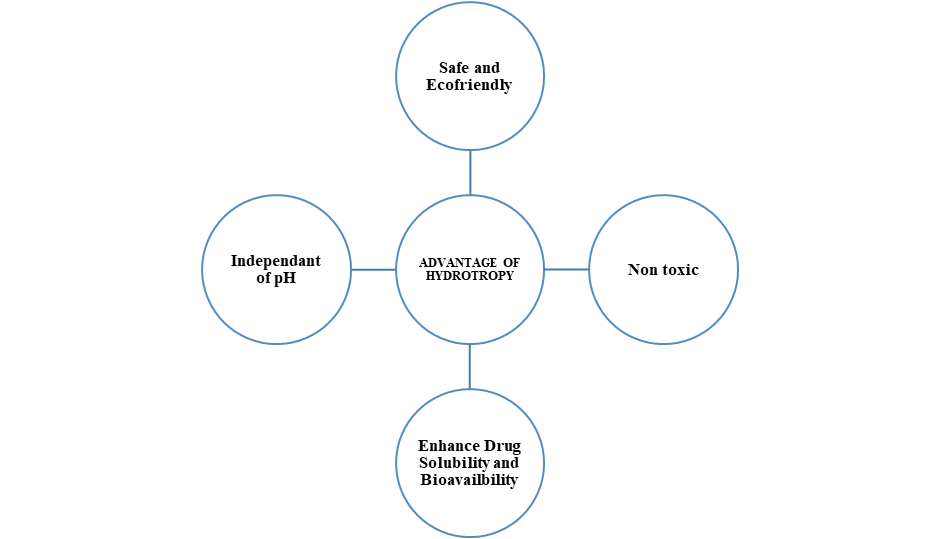
Figure 1: Advantages of hydrotropy10
Aspirin (ASP) is also known as acetyl salicylic acid is a well-established drug is used worldwide as an analgesic, antipyretic and anti-inflammatory drug11. Aspirin is the prototypical analgesic used in the treatment of mild to moderate pain and it act as an inhibitor of cyclo-oxygenase which result in the inhibition of biosynthesis of prostaglandins12.
ASP also inhibits platelet aggregation and is used in the prevention of arterial and venous thrombosis13. For ASP stability monitoring in tablets, ultra violet (UV) has been found to be fit for the purpose as it is suitable for accurately measure in the microgram order14.
Quality by Design (QbD) is a systematic approach to product development through an understanding of the effects of various input variables on the final product (active pharmaceutical agent or drug products). Thus, QbD approach define appropriate ranges of the input parameters with in which the quality of the final product is assured. In a similar manner for analytical methods, QbD approach involves a full understanding of how the analytical technique attributes and operating conditions effect the analytical performance15.
DRUG PROFILE

Figure 2: Chemical structure of aspirin
Aspirin (acetylsalicylic acid) is one of the most frequently used and cheapest drugs in medicine. It belongs to the non-inflammatory drugs with a wide range of pharmacological activities, including analgesic, antipyretic and antiplatelet properties16.
Mechanism of Action: Aspirin is a cyclooxygenase-1(COX-1) inhibitor. It is a modifier of activity of cyclooxygenase-2(COX-2)17. unlike other NSAIDS (ibuprofen\naproxen), which bind reversibly to this enzyme, aspirin binding is irreversible. It also blocks thromboxane A2 on platelets in an irreversible fashion preventing platelet aggregation.
Dosage18: It is available in different doses, the lowest being 81mg, also called a baby aspirin.
Pharmacokinetics19:
Absorption: Rapidly absorbed after oral administration
Distribution: Widely distributed, crosses blood-placental barrier
Metabolism: By glucuronic acid conjugation
Excretion: Primarily excreted through kidney
Adverse effects: Hypersensitivity, bleeding, GI upset, Reye syndrome, intracerebral hemorrhage, tinnitus20.
Contraindications: Aspirin increases the risk of GI bleeding in patients who already suffer from peptic ulcer disease or gastritis. Acquired diathesis, as in the setting of dengue or yellow hemorrhagic fever, should avoid the use of aspirin21.
Monitoring: Aspirin levels do not need to monitored in most cases. For certain diseases, serum creatinine at baseline, along the serum drug levels, if patients have adult or juvenile rheumatoid arthritis, Kawasaki disease, or arthritis/pleurisy22.
Pharmacodynamic profile: Almost 90% of COX inhibition can be achieved with the administration of 160-325mg of aspirin. These effects last for about 7-10 days which usually corresponds with the life span of the platelet. Prostacyclin inhibition can be achieved with use of higher doses. This inhibition occurs in the endothelial cells of blood vessels23.
MATERIALS AND METHODS
Instrumentation
The Cary 5000 UV - VIS- NIR spectrophotometer is a high-performance UV- VIS and NIR spectrophotometer with photometric performance in the 173-3300nm range. All weighing is done on Digital Precision Balance (SMART, Model ITA-J).
Chemicals and Reagents
Aspirin was obtained from Isochem Laboratories Angamaly, Kochi.
Choice of solvent
Aspirin was found to be insoluble in water. So hydrotropic solvents are taken as a suitable solvent for sample preparation.
|
Sr. No |
Solvent |
Absorbance |
|
1. |
Sodium citrate |
277nm |
|
2. |
Sodium benzoate |
294nm |
|
3. |
Urea |
276nm |
Thus, sodium benzoate was determined to exhibit the highest stability among the selected samples.
Preparation of calibration curve of aspirin
100mg of aspirin standard drug was accurately weighed and transferred to a 100ml volumetric flask. To this 10ml 10% sodium benzoate was added and flask was shaken to solubilize the drug. The volume was made up to the mark with distilled water. The stock solution was further diluted with distilled water to obtain various dilutions containing 5, 10 and 15 µg/ml of drug respectively24.
Forced degradation studies
Forced degradation under heat, pH, concentration25.
a. Thermal degradation: Measure the absorbance at 294nm in the temperature range of 37ºC, 58.5ºC and 80ºC after pipetting out 10ml of the sample solution.
b. pH: Determine the absorbance at 294nm after pipetting off 10ml of the sample solution and adding HCl, water and NaOH to bring the pH levels down to 4, 6.5 and 9, respectively.
c. Concentration: Analyze the absorbance at 294nm in the concentration range of 5%, 10%, 15% after pipetting out 10ml of the sample solution.
QbD approach to analysis
Applying QbD in UV method development commences with establishing analytical objectives based on sound science to ensure consistent method performance characteristics26. Thus the objective of this work was to perform experimental design by using Design Expert Software leading to the development of a simple, rapid and sensitive method by QbD approach and validated as per ICH guidelines (Q2R1) for aspirin27.
For conducting the study, we assume that the compound is stable at different condition and it is checked by measuring its percentage recovery28. Here we consider concentration, temperature and pH as independent variables and percentage recovery as dependent variables29. Several trial runs using all three possible combinations of these factors were performed30. The contour plot was created using data representing the relationship between the three parameters31. Box-Behnken design was constructed using the data obtained, and the significance of the method was checked using p-value and f-value obtained from the ANOVA table32.
RESULT AND DISCUSSION
The UV response of the drug was determined by scanning at wavelengths ranging from 200 to 400nm in hydrotropic solvent (sodium benzoate) with a UV visible spectrophotometer. Aspirin was used for the spectroscopic studies since it had a maximum absorbance at 294nm.
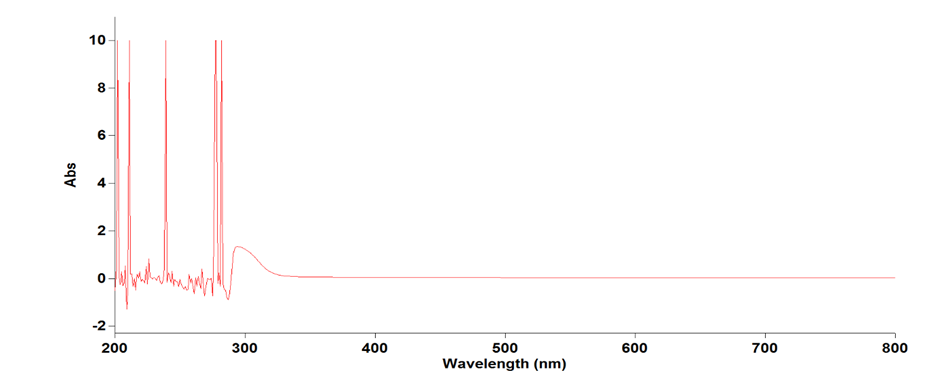
Figure 3: Selection of wavelength
Forced degradation studies
Forced-degradation studies of aspirin commonly assess its stability under thermal, pH-induced, and concentration-dependent stress, with UV–Visible spectroscopy serving as a key analytical tool to monitor chemical changes33. Elevated temperatures accelerate the hydrolysis of aspirin into salicylic acid and acetic acid, producing a reduction in aspirin’s characteristic absorbance near ~275 nm and a corresponding increase in the salicylic acid peak around ~300 nm34. pH has a strong catalytic effect on degradation: alkaline conditions cause rapid ester cleavage, while highly acidic environments also promote hydrolysis but at a slower rate35.These changes generate distinct spectral profiles that can be quantitatively tracked using UV–Visible analysis36. Concentration influences both the degradation of kinetics and the accuracy of spectroscopic measurements, as higher concentrations may enhance detectable absorbance changes but can deviate from Beer–Lambert linearity37. Overall, UV–Visible spectroscopy provides a straightforward, sensitive method for characterizing aspirin degradation under controlled stress conditions38.
The robustness is studied by using digital expert software39. The various experimental factors such as temperature, pH, concentration that can affect stability will be identified40. Once the factors are identified, they can be systematically adjusted within their respective ranges to find the optimal combination that gives the desired stability41. The range of these factors is given in Table 1. Various trial runs were performed using different combinations of these three parameters, and the results are given in Table 2. The sequential analysis was done by a fit summary, and an effective method was found. We selected the Quadratic model for conducting the study. The fit summary is given in Table 3. The Model F-value of 4.73 implies that the model is significant. There is only a 2.63% chance that an F-value at this large could occur due to noise. By using the values, we can plot 2D and 3D contour plots which are Fig 4 and Fig 5 respectively. A contour plot is used to graphically assess how the percentage recovery changes under different circumstances. In this case, the plot depicts values closer to an average range indicating its stability. A Box-Behnken design is used to examine the relationship between several independent variables and dependent responses. It assists in determining the ideal circumstance for a maximum or minimum response42. P-values less than 0.0500 indicate that model terms are significant. In this case, B, A2, C2 are significant model terms. Values greater than 0.001 indicate that the model terms are not significant. Based on the quadratic model, factor A (concentration) and C (pH) can be considered stable since they do not exhibit significant linear effects. Factor B (temperature) shows slight variation, reflecting its significant influence on the response. The values are given in Table 4.
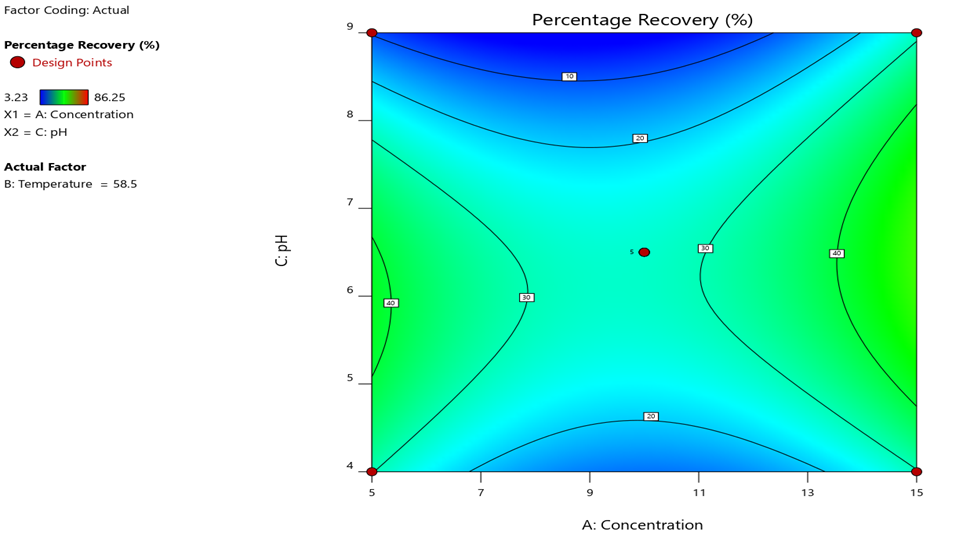
Figure 4: 2D Contour Plot
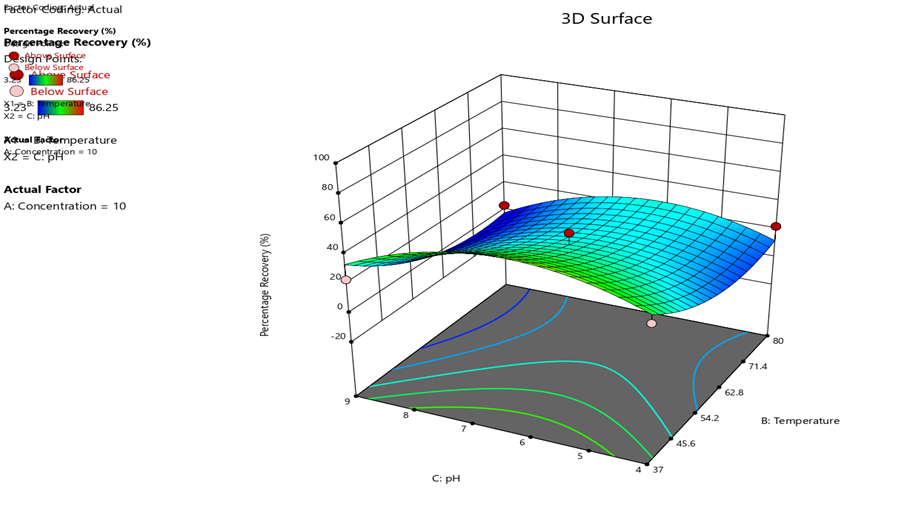
Figure 5: 3D Response Surface Plot
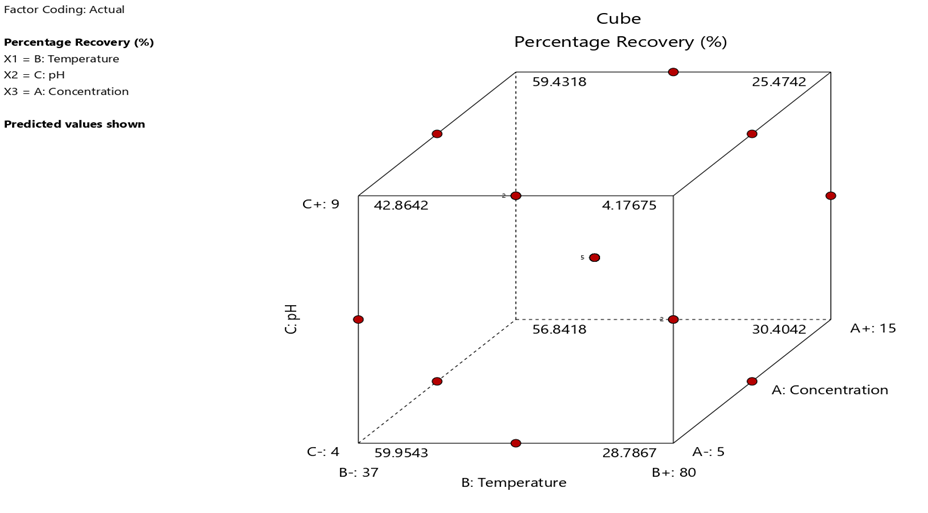
Figure 6: Box Behnken Design
TABLES AND ANNEXURES
Table no: 1. Coded Values for Independent Variables
|
Name |
Units |
Low |
High |
|
Concentration |
|
5 |
15 |
|
Temperature |
degree Celsius |
37 |
80 |
|
pH |
|
4 |
9 |
Table no: 2. Optimization Parameter for Analysis of Aspirin
|
|
Factor 1 |
Factor 2 |
Factor 3 |
Response 1 |
|
Run |
A: Concentration |
B: Temperature |
C: pH |
Percentage recovery |
|
1 |
5 |
80 |
6.5 |
35.3 |
|
2 |
10 |
58.5 |
6.5 |
36.04 |
|
3 |
10 |
80 |
4 |
22.63 |
|
4 |
5 |
58.5 |
9 |
5.9 |
|
5 |
15 |
37 |
6.5 |
81.27 |
|
6 |
15 |
80 |
6.5 |
35.05 |
|
7 |
10 |
37 |
4 |
35.41 |
|
8 |
10 |
58.5 |
6.5 |
22.63 |
|
9 |
10 |
58.5 |
6.5 |
22.63 |
|
10 |
10 |
58.5 |
6.5 |
22.63 |
|
11 |
5 |
37 |
6.5 |
86.25 |
|
12 |
15 |
58.5 |
9 |
36.54 |
|
13 |
15 |
58.5 |
4 |
33.08 |
|
14 |
5 |
58.5 |
4 |
22.12 |
|
15 |
10 |
37 |
9 |
23.53 |
|
16 |
10 |
80 |
9 |
3.23 |
|
17 |
10 |
58.5 |
6.5 |
36.54 |
Table no:3. Fit Summary
|
Source |
Sequential p-value |
Lack of p-value |
Adjusted R2 |
Predicted R2 |
|
|
Linear |
0.1350 |
0.0228 |
0.1856 |
-0.3408 |
|
|
2FI |
0.9692 |
0.0121 |
-0.0338 |
-2.1352 |
|
|
Quadratic |
0.0103 |
0.0784 |
0.06775 |
-0.8246 |
Suggested |
|
Cubic |
0.0784 |
|
0.8801 |
|
Aliased |
Table no: 4. ANOVA for Quadratic Model
|
Source |
Sum of squares |
Mean square |
F-value |
P-value |
|
Model |
6419.54 |
713.28 |
4.73 |
0.0263 |
|
A-Concentration |
165.35 |
165.35 |
1.10 |
0.3296 |
|
B-Temperature |
2120.63 |
2120.63 |
14.08 |
0.0071 |
|
C-pH |
242.44 |
242.22 |
1.61 |
0.2451 |
|
AB |
5.59 |
5.59 |
0.0371 |
0.8527 |
|
AC |
96.83 |
96.83 |
0.6428 |
0.4491 |
|
BC |
14.14 |
14.14 |
0.0938 |
0.7682 |
|
A2 |
1258.97 |
1258.97 |
8.36 |
0.0233 |
|
B2 |
834.93 |
834.93 |
5.54 |
0.0508 |
|
C2 |
1852.56 |
1852.56 |
12.30 |
0.0099 |
CONCLUSION
Hydrotropic solubilization offers a safe and environmentally sustainable means of improving the aqueous solubility of poorly water-soluble drugs such as aspirin. The proposed UV spectrophotometric method is straightforward, accurate, precise, and robust, and avoids the use of hazardous organic solvents. Application of Quality by Design (QbD) principles combined with a Box–Behnken design enabled systematic optimization of critical analytical parameters, resulting in consistent performance and dependable stability assessment under stress conditions.
For drugs with limited water solubility, hydrotropic solubilization–based green analytical methods represent a practical alternative to conventional solvent-intensive techniques. Although challenges remain, including matrix interference, sensitivity to experimental variability, and limited regulatory acceptance, the method demonstrates strong potential for routine pharmaceutical analysis and quality control. Future investigations should prioritize the development of biodegradable hydrotropes, strengthening method reliability through chemometric and QbD approaches, and broadening applicability to biological samples and stability-indicating studies.
REFERENCES


Nada Naur S, Sanoj Varkey, Archana Sunilkumar, Fathima Nejeev, Ag Lavanya, Renjitha Jr, Analytical Method Development of Aspirin by Hydrotropic Solubilization Technique: QbD, Int. J. of Pharm. Sci., 2026, Vol 4, Issue 2, 467-476. https://doi.org/10.5281/zenodo.18479557
 10.5281/zenodo.18479557
