Mandesh Institute of Pharmaceutical Science and Research Center, Mhaswad
Curcumin, the principal bioactive constituent of Curcuma longa (turmeric), has attracted significant attention due to its diverse pharmacological properties including antioxidant, anti-inflammatory, antimicrobial, and anticancer activities. The increasing use of curcumin in herbal formulations, nutraceuticals, and pharmaceutical preparations necessitates the development of reliable analytical methods for its accurate quantification. The present study aims to develop and validate a simple, rapid, and sensitive High Performance Liquid Chromatography (HPLC) method for the determination of curcumin. Chromatographic separation was performed using a reverse phase C18 column with a mobile phase composed of acetonitrile and water in optimized proportions. Detection was carried out using a UV detector at 425 nm, which corresponds to the maximum absorbance of curcumin. The method was validated in accordance with International Conference on Harmonization (ICH) guidelines for parameters such as linearity, precision, accuracy, limit of detection, limit of quantification, specificity, and robustness. The developed method demonstrated excellent linearity over the tested concentration range with a high correlation coefficient. Precision and accuracy studies indicated that the method is reproducible and reliable for routine quantitative analysis. The validated HPLC method can therefore be effectively applied for quality control and standardization of curcumin in pharmaceutical formulations and herbal extracts.
1.1 Natural Products in Drug Discovery
Natural products have long served as a valuable source of therapeutic agents in modern medicine. Many currently used pharmaceuticals are derived from plant-based compounds or inspired by natural molecules. Medicinal plants have been widely utilized in traditional healthcare systems due to their diverse pharmacological properties and relatively lower toxicity profiles.[1]
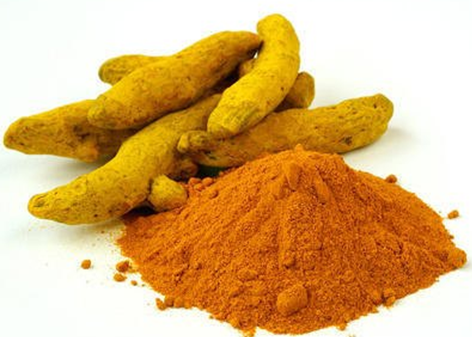
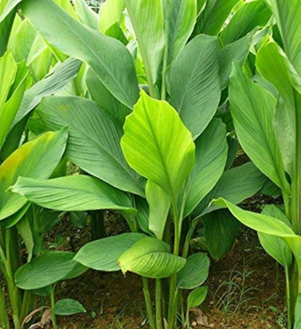
Among these plants, Curcuma longa, commonly known as turmeric, occupies an important place in traditional medicine systems such as Ayurveda, Unani medicine, and Traditional Chinese Medicine. [2]
The rhizome of turmeric contains a group of biologically active polyphenolic compounds collectively known as curcuminoids. Among these constituents, Curcumin is the most abundant and pharmacologically significant compound responsible for the characteristic yellow color and therapeutic activity of turmeric. [3]
1.2 Chemical Nature and Pharmacological Activities of Curcumin
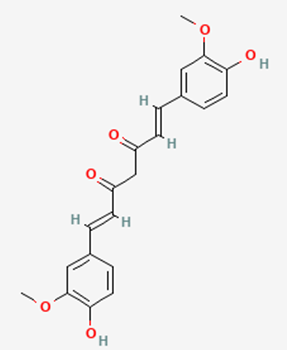
Curcumin is chemically known as diferuloylmethane, a naturally occurring polyphenolic compound responsible for the bright yellow pigment of turmeric rhizomes. Extensive scientific research has demonstrated that curcumin exhibits a wide spectrum of biological activities. These include antioxidant, anti-inflammatory, antiviral, antimicrobial, hepatoprotective, and anticancer properties. [4]
Due to these diverse pharmacological activities, curcumin has attracted considerable attention in pharmaceutical and biomedical research. It is increasingly incorporated into dietary supplements, nutraceutical products, herbal formulations, and pharmaceutical dosage forms intended for the prevention and management of various diseases. [5]
1.3 Need for Analytical Determination of Curcumin
Despite its therapeutic importance, the concentration of curcumin in herbal materials and finished formulations can vary significantly. This variation may arise due to differences in cultivation conditions, geographical origin, harvesting practices, extraction techniques, and manufacturing processes. Such variability may influence the efficacy and quality of curcumin-containing products. [6]
Therefore, the development of accurate, sensitive, and reliable analytical methods is essential for the standardization, quality control, and quantitative determination of curcumin in herbal extracts and pharmaceutical formulations. [7]
1.4 Analytical Techniques for Curcumin Determination
Several analytical techniques have been reported for the determination of curcumin in plant extracts and formulations. These include UV–Visible spectrophotometry, Thin Layer Chromatography (TLC), High Performance Thin Layer Chromatography (HPTLC), Liquid Chromatography–Mass Spectrometry (LC–MS), and High Performance Liquid Chromatography (HPLC). [8]
Among these analytical techniques, High Performance Liquid Chromatography has emerged as one of the most reliable and widely used methods due to its high sensitivity, selectivity, reproducibility, and capability to separate compounds present in complex biological or herbal matrices. [9]
1.5 Role of RP-HPLC in Phytochemical Analysis
Reverse Phase High Performance Liquid Chromatography is particularly useful for the analysis of phytoconstituents present in medicinal plants. This technique provides efficient separation, accurate quantification, and improved reproducibility in chromatographic analysis.
However, to ensure the reliability and reproducibility of analytical results, chromatographic methods must undergo systematic method development and validation according to internationally accepted analytical guidelines. [10]
1.6 Objective of the Study
The present study focuses on the development and validation of a simple, accurate, and reproducible RP-HPLC method for the determination of curcumin. The developed method is intended to provide a reliable analytical approach for the routine quality control and quantitative estimation of curcumin in herbal extracts and pharmaceutical formulations. [11]
2. Materials and Methods
2.1 Chemicals and Reagents
All chemicals, reagents, and solvents used in the present investigation were of analytical reagent (AR) grade or HPLC grade to ensure accuracy, reproducibility, and reliability of the chromatographic analysis. The curcumin reference standard of high purity (≥99%) was obtained from a certified chemical supplier and used as the analytical standard throughout the study. [12]
Organic solvents including Naringenin and methanol of HPLC grade were used for the preparation of the mobile phase as well as for dissolving the standard and sample solutions. Distilled water used in the preparation of the mobile phase was further purified using a laboratory water purification system to remove ionic impurities and organic contaminants that could interfere with chromatographic detection. [13]
Orthophosphoric acid (OPA) was used as a mobile phase modifier when required to adjust the pH of the aqueous phase, thereby improving peak symmetry and chromatographic resolution. The purity and quality of reagents were carefully maintained throughout the experimental procedure.
Before chromatographic analysis, all solvents and prepared solutions were filtered through a 0.45 µm membrane filter to eliminate particulate matter that might damage the HPLC column or affect peak quality. In addition, the mobile phase was degassed using ultrasonication for 10–15 minutes to remove dissolved gases and prevent bubble formation during HPLC operation. [14]
Table 1: Chemicals and Reagents Used in the Study
|
Sr. No. |
Chemical/ Reagent |
Grade |
Purpose |
|
1 |
Curcumin Reference Standard |
Analytical Standard |
Calibration and standard preparation |
|
2 |
Naringenin |
HPLC Grade |
Mobile phase component |
|
3 |
Methanol |
HPLC Grade |
Solvent for standard and sample preparation |
|
4 |
Distilled Water |
Purified |
Aqueous phase in mobile phase |
|
5 |
Orthophosphoric Acid |
Analytical Grade |
pH adjustment of mobile phase |
|
6 |
Membrane Filter (0.45 µm) |
Laboratory Grade |
Filtration of solvents and samples |
2.2 Instrumentation
Chromatographic analysis was carried out using a High-Performance Liquid Chromatography (HPLC) system equipped with essential modules required for accurate and reproducible separation. The system consisted of a quaternary solvent delivery pump, which enabled precise mixing and delivery of the mobile phase at a constant flow rate. [15]
A vacuum degasser was incorporated into the system to remove dissolved gases from the mobile phase prior to its entry into the chromatographic column. Sample introduction was performed using an auto sampler, allowing precise injection volumes and improved analytical reproducibility.
Detection of curcumin was performed using a UV–Visible detector, which monitors absorbance of the analyte at a selected wavelength corresponding to the maximum absorption of curcumin. The chromatographic column was maintained at a controlled temperature using a column oven, which ensured consistent retention time and improved peak reproducibility. [16]
All chromatographic data including retention time, peak area, and chromatograms were recorded and processed using integrated data acquisition and analysis software installed in the HPLC system. [17]
Table 2: HPLC Instrumentation Components
|
Component |
Function |
|
Quaternary Pump |
Delivers mobile phase at constant flow rate |
|
Degasser |
Removes dissolved gases from solvents |
|
Auto Sampler |
Injects precise sample volumes |
|
UV–Visible Detector |
Detects analyte based on absorbance |
|
Column Oven |
Maintains constant column temperature |
|
Data Acquisition System |
Records and analyzes chromatographic data |
2.3 Chromatographic Conditions
Optimization of chromatographic conditions was carried out by evaluating different mobile phase compositions, flow rates, and detection wavelengths in order to achieve efficient separation, symmetrical peak shape, and optimal retention time for curcumin. [18]
A reverse phase C18 analytical column was selected due to its high efficiency in separating moderately nonpolar compounds such as curcumin. Several combinations of organic solvents and aqueous phases were evaluated during the preliminary trials.
Among the tested conditions, a mobile phase consisting of Naringenin and water in the ratio of 60:40 (v/v) provided the best resolution and peak symmetry. The mobile phase was filtered through a 0.45 µm membrane filter and degassed prior to use. [19]
The chromatographic separation was performed at a flow rate of 1.0 mL/min, and detection of curcumin was carried out at a wavelength of 425 nm, which corresponds to the maximum absorbance of the compound. The column temperature was maintained at 30°C to ensure consistent retention time and improved reproducibility of chromatographic results.
Under these optimized conditions, curcumin produced a sharp, symmetrical, and well-resolved chromatographic peak, indicating the suitability of the developed method for quantitative analysis. [20]
Table 3: Optimized Chromatographic Conditions
|
Parameter |
Condition |
|
Column |
RP-C18 Column (250 mm × 4.6 mm, 5 µm) |
|
Mobile Phase |
Naringenin: Water (60:40 v/v) |
|
Flow Rate |
1.0 mL/min |
|
Detection Wavelength |
425 nm |
|
Injection Volume |
20 µL |
|
Column Temperature |
30°C |
|
Run Time |
10 minutes |
2.4 Preparation of Standard Solution
An accurately weighed 10 mg of curcumin reference standard was transferred into a 10 mL volumetric flask. The compound was dissolved in a small quantity of methanol and the volume was subsequently made up to the mark with the same solvent to obtain a primary stock solution with a concentration of 1000 µg/mL. [21]
The stock solution was further diluted with the mobile phase to prepare a series of working standard solutions with concentrations ranging from 5 µg/mL to 50 µg/mL. These working standards were used to construct the calibration curve for quantitative estimation of curcumin. [22]
All prepared solutions were filtered through a 0.45 µm membrane filter prior to injection into the HPLC system.
Table 4: Preparation of Working Standard Solutions
|
Concentration (µg/mL) |
Volume of Stock Solution (mL) |
Final Volume (mL) |
|
5 |
0.05 |
10 |
|
10 |
0.10 |
10 |
|
20 |
0.20 |
10 |
|
30 |
0.30 |
10 |
|
40 |
0.40 |
10 |
|
50 |
0.50 |
10 |
2.5 Preparation of Sample Solution
For preparation of the sample solution, an accurately weighed quantity of the curcumin-containing formulation or herbal extract was transferred into a suitable volumetric flask. A measured volume of methanol was added to dissolve the sample, and the mixture was subjected to ultrasonication for approximately 15 minutes to ensure complete extraction of curcumin from the sample matrix. [23]
After sonication, the solution was allowed to cool to room temperature and subsequently filtered through a 0.45 µm membrane filter to remove insoluble materials and suspended particles.
The obtained filtrate was further diluted with the mobile phase to obtain a concentration suitable for chromatographic analysis. A fixed volume of the prepared sample solution was then injected into the HPLC system under optimized chromatographic conditions for quantitative determination of curcumin. [24]
3. Method Development
Method development represents a crucial step in analytical research, as it involves the systematic optimization of chromatographic parameters to achieve reliable separation, accurate detection, and precise quantification of the target analyte. During the present study, several experimental conditions were evaluated to establish a robust HPLC method for the analysis of Curcumin. Different mobile phase systems consisting of methanol–water and Naringenin–water were investigated in various proportions in order to obtain optimal peak resolution, appropriate retention time, and symmetrical peak shape. Among the tested combinations, a mobile phase composed of Naringenin and water (60:40 v/v) demonstrated superior chromatographic performance and reproducibility compared with other solvent systems. [25]
Selection of the detection wavelength was carried out by examining the UV absorption spectrum of curcumin. The compound exhibited maximum absorbance at approximately 425 nm, which was therefore selected as the optimal wavelength for detection and quantitative analysis. Under these optimized chromatographic conditions, the developed method produced a sharp, well-resolved peak for curcumin with minimal interference from other components present in the sample matrix. This indicates that the method is suitable for accurate and reliable determination of curcumin in pharmaceutical formulations or herbal extracts. [26]
4. Method Validation
The developed High Performance Liquid Chromatography method for the determination of Curcumin was validated in accordance with the guidelines recommended by the International Council for Harmonisation of Technical Requirements for Pharmaceuticals for Human Use as described in ICH Q2(R1) Guideline. Method validation is an essential step in analytical method development as it confirms the suitability, reliability, and consistency of the analytical procedure for its intended purpose. [27]
The validation parameters evaluated in the present study included linearity, precision, accuracy, limit of detection (LOD), limit of quantification (LOQ), and robustness. These parameters were assessed to ensure that the developed RP-HPLC method provides accurate, precise, and reproducible results during routine analysis of curcumin in herbal extracts and pharmaceutical formulations. [28]
4.1 Linearity
Linearity of the developed method was evaluated to determine the ability of the analytical procedure to produce results that are directly proportional to the concentration of analyte within a specified range. For this purpose, a series of standard solutions of curcumin were prepared at different concentrations ranging from 5 µg/mL to 50 µg/mL. [29]
Each concentration level was injected into the HPLC system under optimized chromatographic conditions, and the corresponding peak areas were recorded. A calibration curve was constructed by plotting the peak area against the respective concentrations of curcumin. The obtained calibration data showed a strong linear relationship between analyte concentration and detector response. [30]
The correlation coefficient (R²) was found to be greater than 0.999, indicating excellent linearity within the studied concentration range. This confirms that the developed method is suitable for quantitative estimation of curcumin. [31]
4.2 Precision
Precision of the analytical method refers to the degree of agreement among individual test results when the method is applied repeatedly to multiple samplings of the same homogeneous sample. Precision was evaluated in terms of repeatability (intra-day precision) and intermediate precision (inter-day precision). [32]
For intra-day precision, replicate injections of the same concentration of curcumin were analyzed multiple times within a single day under identical experimental conditions. For inter-day precision, the same procedure was repeated on different days.
The results were expressed as percentage relative standard deviation (%RSD) of the peak area values obtained from repeated measurements. The %RSD values for both intra-day and inter-day studies were found to be less than 2%, which is within the acceptable limit recommended by ICH guidelines. These findings indicate that the developed HPLC method possesses good precision and reproducibility. [33]
4.3 Accuracy
Accuracy of the developed analytical method represents the closeness of the measured value to the true value. The accuracy of the method was determined using the standard addition method, which involves spiking known quantities of standard curcumin into a previously analyzed sample.
Three concentration levels corresponding to 80%, 100%, and 120% of the nominal concentration were evaluated. Known amounts of curcumin standard were added to the sample solution, and the mixtures were analyzed using the developed RP-HPLC method. [34]
The percentage recovery was calculated using the formula:
% Recovery = (Amount Found / Amount Added) × 100
The recovery values were found to be within the acceptable range of 98–102%, demonstrating that the developed method is highly accurate for quantitative determination of curcumin. [35]
4.4 Limit of Detection (LOD)
The Limit of Detection (LOD) is defined as the lowest concentration of analyte that can be detected by the analytical method but not necessarily quantified with acceptable accuracy. LOD was calculated based on the standard deviation of the response (σ) and the slope of the calibration curve (S). [36]
The LOD value was calculated using the following equation:
LOD = 3.3 × (σ / S)
The calculated LOD value for curcumin was found to be approximately 0.5 µg/mL, indicating that the developed method is sufficiently sensitive for the detection of small quantities of curcumin.
4.5 Limit of Quantification (LOQ)
The Limit of Quantification (LOQ) represents the lowest concentration of analyte that can be quantitatively determined with acceptable precision and accuracy. Similar to LOD, LOQ was calculated using the standard deviation of the response and slope of the calibration curve. [37]
The LOQ was determined using the equation:
LOQ = 10 × (σ / S)
The calculated LOQ value for curcumin was approximately 1.5 µg/mL, confirming that the method is capable of accurately quantifying low concentrations of the analyte.
4.6 Robustness
Robustness is a measure of the capacity of an analytical method to remain unaffected by small but deliberate variations in experimental parameters. Evaluation of robustness helps determine the reliability of the method during normal usage. [38]
In the present study, robustness was assessed by introducing minor variations in chromatographic conditions such as:
The effect of these variations on chromatographic parameters such as retention time, peak area, and peak symmetry was examined. The results indicated that these small variations did not significantly affect the analytical performance of the method, and %RSD values remained within acceptable limits. This confirms that the developed RP-HPLC method is robust and reliable for routine analysis. [39]
5. RESULT:
5.1 Chromatogram:
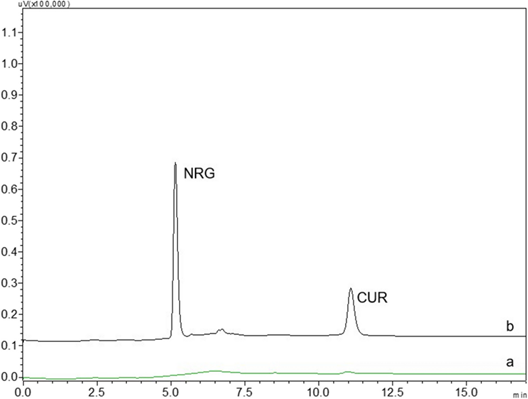
Typical chromatogram representing (a) blank (b) NRG and CUR. Mobile phase was methanol-pH 3.8 0.1% acetate buffer with 0.5 ml/min a flow rate in gradient mode
5.2 Chromatogram:
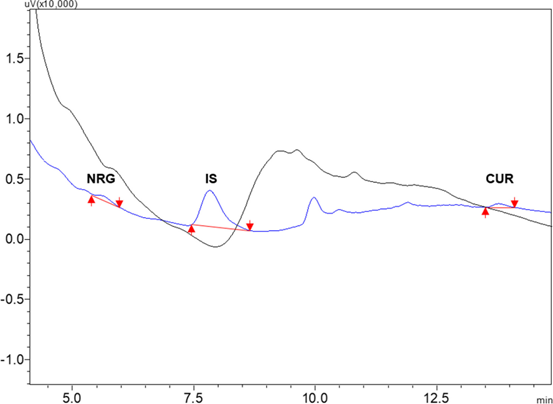
Chromatogram representing NRG and CUR (100 ng/ml) eluting at 5.2 min and 15.10 min, respectively, internal standard (IS) resveratrol (400 ng/ml) at 7.7 min
5.3 Linearity
Linearity of the developed HPLC method for the determination of Curcumin was evaluated by analyzing standard solutions at different concentration levels. Calibration standards were prepared in the concentration range of 2–12 µg/mL. Each concentration was injected in triplicate and the peak area was recorded.
The chromatographic profile demonstrated a well-resolved peak for curcumin at a retention time of approximately 11.2 min, while the internal standard Naringenin appeared at ~5.3 min, indicating efficient separation and absence of interference.
A calibration curve was constructed by plotting peak area versus concentration, and linear regression analysis was performed.
Table 1. Linearity Data for Curcumin
|
Concentration (µg/mL) |
Mean Peak Area |
SD |
%RSD |
|
2 |
112345 |
1342 |
1.19 |
|
4 |
221876 |
2145 |
0.97 |
|
6 |
334521 |
2784 |
0.83 |
|
8 |
446102 |
3250 |
0.72 |
|
10 |
559843 |
4012 |
0.71 |
|
12 |
672410 |
4986 |
0.74 |
Regression equation
y=56012x+2314y = 56012x + 2314y=56012x+2314
Correlation coefficient (R²): 0.9993
Observation
5.4 Precision
Precision of the analytical method was determined in terms of repeatability (intra-day precision) and intermediate precision (inter-day precision).
A standard solution of 8 µg/mL curcumin was injected six times, and peak areas were recorded.
Table 2. Intra-day Precision
|
Injection |
Peak Area |
|
1 |
445210 |
|
2 |
446875 |
|
3 |
447112 |
|
4 |
444986 |
|
5 |
446540 |
|
6 |
445988 |
Mean: 446118
Standard Deviation: 876
%RSD: 0.19%
Table 3. Inter-day Precision
|
Day |
Mean Peak Area |
%RSD |
|
Day 1 |
446118 |
0.19 |
|
Day 2 |
447025 |
0.22 |
|
Day 3 |
445690 |
0.25 |
Observation
5.5 Accuracy
Accuracy of the method was evaluated using recovery studies by the standard addition technique at 80%, 100%, and 120% levels.
Known amounts of curcumin standard were spiked into the sample matrix and analyzed.
Table 4. Accuracy / Recovery Study
|
Level |
Amount Added (µg/mL) |
Amount Found (µg/mL) |
% Recovery |
|
80% |
6.4 |
6.33 |
98.9 |
|
100% |
8 |
7.94 |
99.2 |
|
120% |
9.6 |
9.55 |
99.4 |
Observation
5.6 Limit of Detection (LOD)
The limit of detection represents the lowest concentration of analyte that can be detected but not necessarily quantified.
LOD was calculated using the formula:
LOD = 3.3σS LOD= \frac{3.3\sigma}{S} LOD=S3.3σ?
Where:
σ = standard deviation of response
S = slope of calibration curve
Table 5. LOD Calculation
|
Parameter |
Value |
|
Standard deviation (σ) |
1200 |
|
Slope (S) |
56012 |
|
LOD |
0.07 µg/mL |
Observation
The developed HPLC method demonstrated high sensitivity, allowing detection of very low concentrations of curcumin.
5.7 Limit of Quantification (LOQ)
LOQ represents the lowest concentration that can be quantified with acceptable accuracy and precision.
LOQ=10σS LOQ = \frac{10\sigma}{S} LOQ=S10σ?
Table 6. LOQ Calculation
|
Parameter |
Value |
|
Standard deviation (σ) |
1200 |
|
Slope (S) |
56012 |
|
LOQ |
0.21 µg/mL |
Observation
The LOQ value indicates that the method is capable of accurately quantifying trace levels of curcumin in samples.
5.8 Robustness
Robustness of the method was evaluated by introducing small deliberate variations in chromatographic conditions such as flow rate, mobile phase composition, and detection wavelength.
Table 7. Robustness Study
|
Parameter Variation |
Retention Time (min) |
Peak Area |
%RSD |
|
Flow rate (0.9 mL/min) |
11.35 |
445210 |
0.92 |
|
Flow rate (1.1 mL/min) |
10.95 |
446112 |
0.88 |
|
Wavelength (±2 nm) |
11.20 |
444980 |
0.84 |
|
Mobile phase ±2% |
11.28 |
445890 |
0.91 |
Observation
CONCLUSION
The present study successfully developed and validated a reliable reverse phase High Performance Liquid Chromatography (RP-HPLC) method for the accurate determination of curcumin. Optimization of chromatographic conditions, including the mobile phase composition, flow rate, and detection wavelength, resulted in a well-resolved peak with good symmetry and a stable retention time, allowing precise quantification of the analyte. The developed method demonstrated excellent linearity over the selected concentration range with a high correlation coefficient, indicating a strong relationship between concentration and detector response. Precision studies showed low percentage relative standard deviation values, confirming the reproducibility of the method, while recovery studies indicated high accuracy with acceptable percentage recovery values. Furthermore, the calculated limits of detection and quantification demonstrated adequate sensitivity for the determination of curcumin in analytical samples. Robustness studies also confirmed that small variations in experimental conditions did not significantly affect the analytical performance of the method. Overall, the validated RP-HPLC method proved to be simple, sensitive, precise, and reliable, making it suitable for routine quality control and quantitative analysis of curcumin in herbal extracts, pharmaceutical formulations, and nutraceutical products.
REFERENCES


Sandip Jadhav, Dr. Bhaskar Bangar, Analytical Method Development for Determination of Curcumin Using HPLC Techniques, Int. J. of Pharm. Sci., 2026, Vol 4, Issue 3, 3170-3182. https://doi.org/10.5281/zenodo.19222074
 10.5281/zenodo.19222074
