View Article

Abstract

Ultraviolet (UV) spectroscopy is a vital analytical technique used across chemistry, pharmaceuticals, and biological sciences for qualitative and quantitative analysis. It is based on the absorption of ultraviolet light (200–400 nm) by molecules, leading to electronic transitions from lower to higher energy states. The technique follows Beer-Lambert’s law, which establishes a linear relationship between absorbance and concentration, making it suitable for precise quantitative measurements. A typical UV-Vis spectrophotometer consists of a radiation source, monochromator, sample cell, detector, and recording system. Common light sources include deuterium and tungsten lamps, while prisms or diffraction gratings serve as monochromators to isolate specific wavelengths. Detectors such as phototubes and photomultiplier tubes convert transmitted light into measurable signals. UV spectroscopy finds wide applications in quantitative chemical analysis, pharmaceutical quality control, biochemical research, and environmental monitoring. Its simplicity, accuracy, and cost-effectiveness make it indispensable for determining molecular structure, concentration, and purity, supporting research and industrial processes with high analytical precision and reproducibility.

Keywords

UV spectroscopy, Electronic transition, Beer-Lambert’s Law

Introduction

Spectroscopy is  the technique which measures the Electromagnetic radiations (EMR) which is emitted or absorbed by molecules or atoms or ions of a sample when it moves from one energy state to another energy state and Electromagnetic radiation is a type of energy such as UV rays, Infrared rays, Micro-waves, Radio-waves, X-rays, Gamma rays and visible light etc. 

Ultraviolet (UV) spectroscopy is one of the most widely employed analytical techniques in modern chemistry and pharmaceutical sciences. It is a type of absorption spectroscopy which  involves the interaction of ultraviolet light, typically in the wavelength range of 200–400 nm, with a substance to study its electronic structure.  When UV light passes through a sample,  some of it is absorbed, causing the electrons in the molecules to move from a lower energy level (ground state) to a higher energy level (excited state), producing a distinct absorption spectrum. This spectrum serves as a molecular fingerprint that helps in the identification, purity assessment, and quantitative determination of chemical compounds.

Principle

The principle of UV-Vis spectroscopy is Based on the principle of absorption of UV light by chemical compounds, which result in production of different Spectra and the spectra arise from the transition of an electron within a molecule from ground state to excited state. When the molecules absorb UV radiation frequency the electron in that molecule undergoes transition from ground level to higher energy level cause electronics transition. 

Electronic Transitions

When a molecule absorbs UV light, electronic transitions occur — electrons jump to higher energy orbitals. Molecules that have π-electrons (in double bonds) or non-bonding electrons (lone pairs) can easily absorb UV radiation. This absorption results in different types of transitions depending on the kind of electrons involved:

  1. Σ → σ* (sigma to sigma star)
  2. N → σ* (non-bonding to sigma star)
  3. Π → π* (pi to pi star)
  4. N → π* (non-bonding to pi star)

These transitions differ in energy, arranged as:

Σ–σ > n–σ > π–π* > n–π***

(from highest to lowest energy required).

Beer-Lambert’s Law

This absorption process is mathematically represented by the Beer–Lambert Law, which defines a direct proportionality between absorbance (A) and the concentration (C) of the absorbing species in the solution, 

Beer – Lambert’s law states that;

When a beam of monochromatic radiation is passes through the absorbing medium, then the decrease in the intensity of the radiation is directly proportional to the thickness/pathlength as well as concentration of the solution. 

The Beer -Lambert’s law can be expressed as :

A a c × l

A= ε ×c×l

Where, 

A=Absorbance ε=Molar absorptivity c= concentration l= pathlength  According to this law, absorbance increases linearly with concentration within a specific range, which makes UV spectroscopy a reliable quantitative method for solution analysis.

Instrumentation

The essential parts of a spectrophotometer are :

  1. Radiation Source
  2. Monochromator
  3. Sample cell
  4. Detector
  5. Recordings system

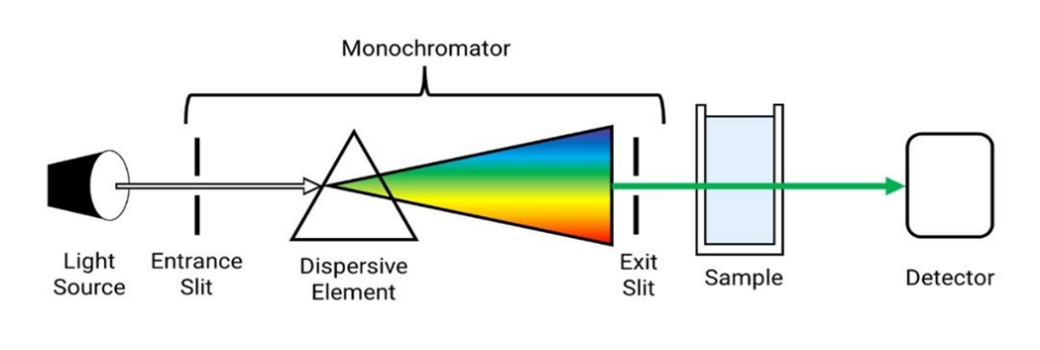
Fig.1. A basic block diagram of the elements in a spectrometer.
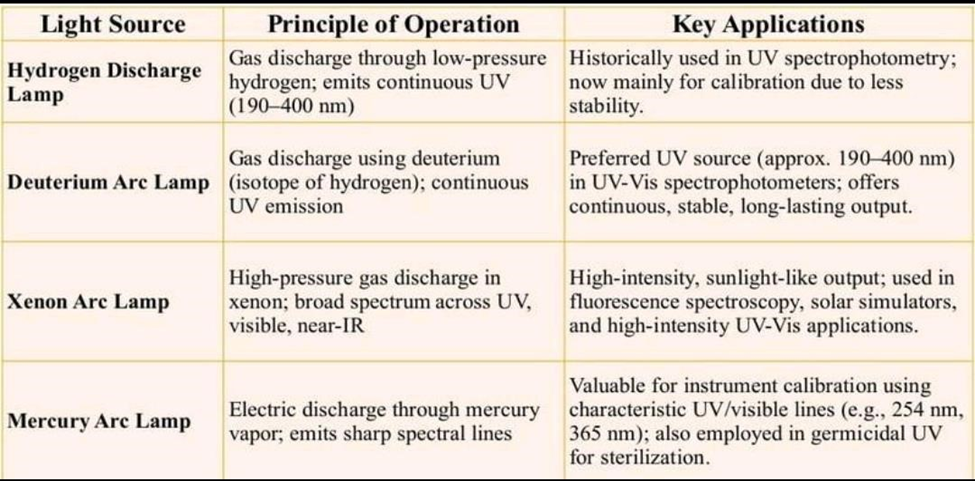
Radiation Source

In UV-Vis spectroscopy, the selection of a light source is crucial for accurate and reliable measurements. 

The light source used in UV-Visible spectroscopy should give a steady and uniform intensity of light for all wavelengths. However, maintaining this uniformity is challenging. Therefore, to cover the full range of wavelengths—from ultraviolet to visible and sometimes even near-infrared regions—spectrophotometers usually use a combination of two different light sources.

Common light sources used in UV-Vis Spectrophotometers

Monochromator

Monochromator is also known as Wavelength selectors. Used to isolate the desired wavelength of radiation from wavelength of continuous spectra.

Components of Monochromator

  • Entrance Slit: It narrows the incoming light beam to prevent overlapping of different wavelengths, ensuring a clean input for analysis.
  • Collimating Mirror (Concave): It straightens the diverging light rays from the entrance slit into parallel beams, which is essential for accurate wavelength separation. 
  • Prism or Grating: This component disperses the parallel light into its individual wavelengths by bending (prism) or diffracting (grating) the light, separating colors like a rainbow.
  • Focusing Mirror or Lens: It refocuses the dispersed light onto the exit slit, directing the selected wavelength precisely.
  • Exit Slit: It allows only the desired narrow band of wavelengths to pass through, blocking the rest, to deliver pure monochromatic light.

TYPES OF MONOCHROMATOR

  • Prism Monochromator: Prism works by refraction. Different wavelengths of Light are bent at It is a transparent container that holds the sample being measured They are typically constructed from materials like quartz, glass, or plastic different angles as they pass through the prism material. (e.g., quartz for UV, glass for visible)
  • Diffraction Grating Monochromator: Diffraction Grating works by diffraction and interference. A grating has thousands of finely ruled parallel lines. Light striking these lines is diffracted, and different wavelengths interfere constructively at different angles, spreading the light into a spectrum.

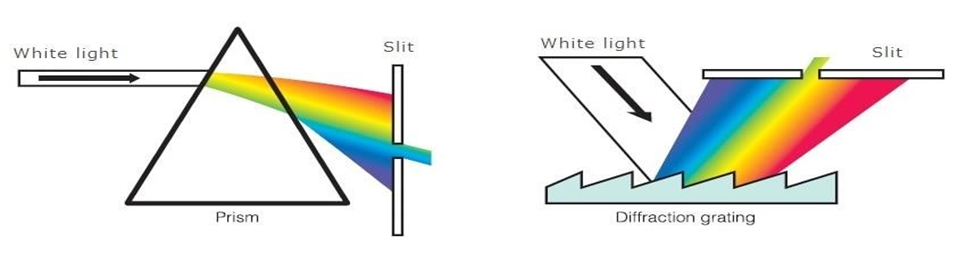
Fig. 2 Working of Monochromators

Sample cell

In UV-Vis spectrophotometry, a sample cell, also known as a cuvette, it is a transparent container that holds the sample being measured They are typically constructed from materials like quartz, glass, or plastic.

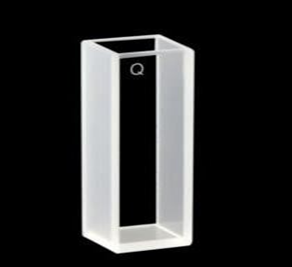
Fig. 3 Sample holder (Cuvette)

Detectors

A UV-Vis spectrophotometer, the detector is the component responsible For converting the light that has passed through the sample into a measurable electrical signal. This signal is then processed to determine the amount of light absorbed or transmitted by the samples. 

Here are the common types of detectors used:

  1. Photovoltaic Cell (Photocell)
  2. Phototube (Photocell)
  3. Photomultiplier Tube (PMT)

Photovoltaic cell (photocell)

Working Principle: Based on the photovoltaic effect light falling on a semiconductor generates electron–hole pairs, producing an electric current. 

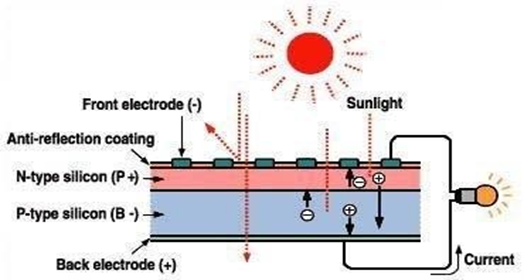
Fig. 4 Photovoltaic cell detector

Photomultiplier  tube (PMT)

Working Principle: Also based on the photoelectric effect but with electron Multiplication. The photoelectrons emitted from the cathode strike a series of Dynodes, each releasing multiple secondary electrons, resulting in a large Amplified current.

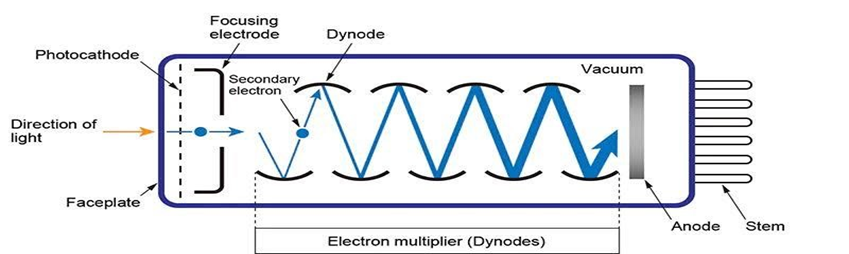
Fig. 5 Photomultiplier tube detector

Phototube (Photoemissive Cell) 

 Working Principle: Works on the photoelectric effect – light photons strike a Photosensitive cathode, releasing electrons, which are collected at an anode

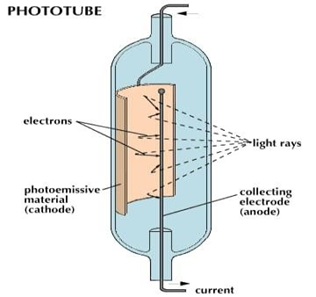
Fig. 6 Phototube detector

Working

Working principle of a spectrophotometer is based on the following steps: 

Blank (measure of the intensity of light transmitted through the solvent):

  1. The solvent (e.g. water or alcohol) is added into a suitable, transparent and not absorbing container – a cuvette.
  2. A light beam emitted by the light source passes through the cuvette with the solvent.
  3. The intensity of the transmitted light at different wavelengths is then measured by a detector and recorded. 

Sample determination:

  1. A sample is dissolved in the solvent and added into the cuvette.
  2. A light beam emitted by the light source passes through the cuvette with the sample. 
  3. When passing through the cuvette, the light is partially absorbed by the sample molecules in the solution.
  4. The transmitted light is then measured by the detector. 
  5. The light intensity change at different wavelengths is calculated by dividing the transmitted intensity      of the sample solution by the corresponding values of the blank. 

Applications

  1. Quantitative Chemical Analysis:

In chemistry labs, UV spectrophotometry is used to measure how much of a substance (solute) is present in a solution. The Beer-Lambert Law explains that the amount of light absorbed by a solution is directly related to the concentration of the absorbing substance. This allows scientists to accurately determine concentrations.

  1. Biochemical and Biomedical Research:

In biology and medicine, UV spectrophotometers are used to study important molecules like proteins and nucleic acids (DNA and RNA). They help identify, measure, and monitor any structural changes in these biomolecules.

  1. Pharmaceutical Analysis:

In the pharmaceutical industry, UV spectrophotometry is used to check the concentration of active pharmaceutical ingredients (APIs) in drug formulations. This ensures that medicines contain the correct amount of each ingredient.   

REFERENCE

  1. Agilent Technologies. (2016). The basics of UV-Vis spectrophotometry (Agilent Publication No. 5980-1397EN). Agilent Technologies. https://www.agilent.com/cs/library/primers/public/primer-uv-vis-basics-5980-1397enagilent.pdf
  2. Kumar, M., & Prasad, B. (2018). A review of the UV-Visible spectroscopy’s method development and validation. International Journal of Pharmaceutical Sciences, 10(2), 325– 330. https://www.ijpsjournal.com/article/A-Review-Of-The-UVVisible-SpectroscopysMethod-Development-And-Validation
  3. Pavia, D. L., Lampman, G. M., Kriz, G. S., & Vyvyan, J. R. (2015). Introduction to spectroscopy (5th ed.). Cengage Learning.
  4. Rai, P. K., & Dubey, S. K. (2022). Applications of online UV-Vis spectrophotometer for drinking water and wastewater monitoring: A review. Water, Air, & Soil Pollution, 233, 162. https://pmc.ncbi.nlm.nih.gov/articles/PMC9024714/
  5. Rathore, M., & Singh, R. (2017). UV-Vis spectrophotometry – Fundamentals and applications. International Journal of Advanced Research in Chemical Science, 4(6), 25– 30. https://www.researchgate.net/publication/321017142_UVVis_Spectrophotometry__Fundamentals_and_Applications
  6. Sarkar, P., & Ghosh, S. (2023). How chemometrics revives the UV-Vis spectroscopy applications. Chemosensors, 11(1), 8. https://doi.org/10.3390/chemosensors11010008
  7. Sharma, S., & Pandey, R. (2020). Advances in quantitative UV-visible spectroscopy for clinical and biomedical applications. Frontiers in Chemistry, 8, 584. https://pmc.ncbi.nlm.nih.gov/articles/PMC2742920/
  8. Silva, P. A., & Campos, A. (2024). UV-Vis spectroscopy in the characterization and applications of microgels and hybrid microgels: A review. Polymers, 16(5), 912. https://pmc.ncbi.nlm.nih.gov/articles/PMC11606387/

Reference

  1. Agilent Technologies. (2016). The basics of UV-Vis spectrophotometry (Agilent Publication No. 5980-1397EN). Agilent Technologies. https://www.agilent.com/cs/library/primers/public/primer-uv-vis-basics-5980-1397enagilent.pdf
  2. Kumar, M., & Prasad, B. (2018). A review of the UV-Visible spectroscopy’s method development and validation. International Journal of Pharmaceutical Sciences, 10(2), 325– 330. https://www.ijpsjournal.com/article/A-Review-Of-The-UVVisible-SpectroscopysMethod-Development-And-Validation
  3. Pavia, D. L., Lampman, G. M., Kriz, G. S., & Vyvyan, J. R. (2015). Introduction to spectroscopy (5th ed.). Cengage Learning.
  4. Rai, P. K., & Dubey, S. K. (2022). Applications of online UV-Vis spectrophotometer for drinking water and wastewater monitoring: A review. Water, Air, & Soil Pollution, 233, 162. https://pmc.ncbi.nlm.nih.gov/articles/PMC9024714/
  5. Rathore, M., & Singh, R. (2017). UV-Vis spectrophotometry – Fundamentals and applications. International Journal of Advanced Research in Chemical Science, 4(6), 25– 30. https://www.researchgate.net/publication/321017142_UVVis_Spectrophotometry__Fundamentals_and_Applications
  6. Sarkar, P., & Ghosh, S. (2023). How chemometrics revives the UV-Vis spectroscopy applications. Chemosensors, 11(1), 8. https://doi.org/10.3390/chemosensors11010008
  7. Sharma, S., & Pandey, R. (2020). Advances in quantitative UV-visible spectroscopy for clinical and biomedical applications. Frontiers in Chemistry, 8, 584. https://pmc.ncbi.nlm.nih.gov/articles/PMC2742920/
  8. Silva, P. A., & Campos, A. (2024). UV-Vis spectroscopy in the characterization and applications of microgels and hybrid microgels: A review. Polymers, 16(5), 912. https://pmc.ncbi.nlm.nih.gov/articles/PMC11606387/

Photo
Lishika Ingole
Corresponding author

P. R. Patil Institute of Pharmacy, Talegaon, Ashti, Wardha, 442202, Maharashtra, India.

Photo
Lokesh Aglawe
Co-author

P. R. Patil Institute of Pharmacy, Talegaon, Ashti, Wardha, 442202, Maharashtra, India.

Photo
Mohit Rithe
Co-author

P. R. Patil Institute of Pharmacy, Talegaon, Ashti, Wardha, 442202, Maharashtra, India.

Photo
Mrunali Niwal
Co-author

P. R. Patil Institute of Pharmacy, Talegaon, Ashti, Wardha, 442202, Maharashtra, India.

Photo
Mahesh Gadge
Co-author

P. R. Patil Institute of Pharmacy, Talegaon, Ashti, Wardha, 442202, Maharashtra, India.

Lishika Ingole, Lokesh Aglawe, Mohit Rithe, Mrunali Niwal, Mahesh Gadge, An Overview on UV Spectroscopy with Applications, Int. J. of Pharm. Sci., 2025, Vol 3, Issue 11, 2925-2930. https://doi.org/10.5281/zenodo.17649969

More related articles
Higher Dimensional NMR Spectroscopy (2D And 3D)...
Thorbole Bhagyashri, Makar Pratibha, ...
Overview Of Hepatoprotective Activity of Polyherb...
Shinde Karan, Shinde Samruddhi , Vikhe Atharva , Dr. Sanjay Bhawa...
Overview of Bioactive Phytochemicals in Withania s...
Praveen Raja S, Sri Dharshan K, Kalaivani D, Keerthana M, ...
An Overview HPLC Method Development and Validation...
Gayatri Jadhav, Monali Khatke, Aarti Nanhe, ...
An Overview on Mucosal Drug Delivery System...
Sneha Bhalerao, Diya Gawade, G. K. Brahma, Aamena Simeem, Payal Shelkhe, ...
Polymeric Nanoparticles: An Overview...
Prabhu K. Halakatti, Santosh Shikarmath, Jayadev N. Hiremath, Anita R. Desai, Avinash S. G., B. Srik...
Related Articles
A Review on Study and Overview of Cosmeceutical Products...
Dnyaneshwar Ghuge, Datta Korde , Pawan Hanute , Rushi Throat, ...
A Review by Paediatric Epilepsy: A Comprehensive Overview of Diagnosis, Treatmen...
Sangram Nagargoje, Pratiksha Pawar, Vaishnavi Rodge, ...
An Overview of Synergistic Effect of Anti-Inflammatory Activity Shown by Moringa...
Rupali Joshi, Shruti Dhere, Abhijeet Dhage, Sarthak Dhumal, Komal Dhakane, ...
An Overview of Liposome...
Snehal Salve, Suyog Ghatol, Tanuja Agole, Vaishnavi Kadu, Yogita Talmale, Vaishnavi Bahe, ...
Higher Dimensional NMR Spectroscopy (2D And 3D)...
Thorbole Bhagyashri, Makar Pratibha, ...
More related articles
Higher Dimensional NMR Spectroscopy (2D And 3D)...
Thorbole Bhagyashri, Makar Pratibha, ...
Overview Of Hepatoprotective Activity of Polyherb...
Shinde Karan, Shinde Samruddhi , Vikhe Atharva , Dr. Sanjay Bhawar, ...
Overview of Bioactive Phytochemicals in Withania somnifera Relieving Stress and ...
Praveen Raja S, Sri Dharshan K, Kalaivani D, Keerthana M, ...