1Department of Pharmacognosy, Smt. Sharadchandrika Suresh Patil College of Pharmacy, Chopda
2Department of Pharmaceutics, Shri Prakashchand Jain College of Pharmacy & Research, Palaskheda (bk)
3Department of Pharmaceutics, K V P S Institute of Pharmaceutical Education Boradi
4Department of Pharmaceutics, Dr. Uttamrao Mahajan College of Pharmacy Chalisgaon
This research focuses on the formulation and evaluation of a matrix drug delivery system for Aceclofenac using natural gum obtained from the Satpuda region. Aceclofenac, a non-steroidal anti-inflammatory drug (NSAID), is widely used to treat pain and inflammation but often causes gastrointestinal side effects when administered conventionally. To overcome this, a sustained-release drug delivery system was developed, aiming to release the drug over an extended period, thus improving patient compliance and minimizing adverse effects. The natural gum, chosen for its biodegradable and non-toxic properties, was used as the matrix-forming agent. Matrix tablets were prepared using different concentrations of the gum and other excipients via direct compression. The formulated tablets were subjected to evaluation for their physical properties, including hardness, friability, and drug content uniformity. In vitro drug release studies were conducted using dissolution tests over 12 to 24 hours, with the aim of achieving sustained drug release. The findings revealed that the natural gum effectively controlled the release of Aceclofenac, with drug release following a controlled pattern over time. The release mechanism was observed to be diffusion-controlled, supported by the swelling properties of the gum matrix. The formulation also demonstrated stability and compatibility between the drug and the gum, as confirmed by FTIR and DSC studies. In conclusion, the natural gum sourced from the Satpuda region proved to be an efficient and sustainable material for developing a matrix-based sustained-release drug delivery system for Aceclofenac. This approach offers the potential to enhance therapeutic outcomes while reducing dosing frequency and side effects, contributing to a more patient-friendly treatment for chronic pain and inflammation.
The quest for effective drug delivery systems has become increasingly important in the pharmaceutical field, particularly in improving the bioavailability and therapeutic efficacy of various medications. Aceclofenac, a non-steroidal anti-inflammatory drug (NSAID), is widely used for its analgesic and anti-inflammatory properties, especially in the management of osteoarthritis and rheumatoid arthritis. However, its therapeutic effectiveness is often limited by factors such as poor solubility, rapid metabolism, and short half-life. Matrix drug delivery systems have emerged as a promising approach to address these challenges. By controlling the release of the drug over an extended period, these systems can enhance bioavailability, minimize side effects, and improve patient compliance. Natural gums, derived from plant sources, offer several advantages in drug formulation, including biocompatibility, biodegradability, and the ability to form hydrophilic matrices that can modulate drug release profiles. The Satpuda region is known for its rich biodiversity, including various plants that produce natural gums with potential pharmaceutical applications. This study focuses on the formulation and evaluation of an aceclofenac matrix drug delivery system utilizing these natural gums. By leveraging the unique properties of these gums, the aim is to develop a sustained release formulation that enhances the therapeutic effects of aceclofenac while minimizing its side effects.
The present work will investigate the formulation parameters, physicochemical properties, in vitro release characteristics, and stability of the developed drug delivery system. Ultimately, this research seeks to contribute to the development of more effective and patient-friendly dosage forms for aceclofenac, utilizing locally sourced natural resources.
KHANDESH REGION
Khandesh is a significant geographic region in Central India, specifically situated in the northwestern part of Maharashtra state. This region encompasses the districts of Dhule, Jalgaon, and Nandurbar, and is bounded by the Baroda district of Gujarat to the north, Nimar district of Madhya Pradesh to the east, Jalgaon district to the south, and Nashik district to the west.
The Khandesh region is characterized by its diverse ecological landscape. To the east lies the Satpuda range, known for its rich vegetation and humid, semi-evergreen species. This biodiversity supports a variety of plant life, including those that produce natural gums with potential pharmaceutical applications. In contrast, the middle region of Khandesh features many deciduous species, contributing to the region's ecological variety. The western part of the region, however, primarily consists of dry scrub vegetation, reflecting the differences in climate and topography. The natural resources of Khandesh, particularly its flora, present opportunities for innovative research in pharmaceuticals. The unique properties of the natural gums found in this region can be harnessed for developing effective drug delivery systems, making Khandesh an important area for exploration in the field of pharmaceutical sciences.
DRY DECIDUOUS FOREST IN THE SATPUDA REGION
The dry deciduous forests of the Satpuda hills, located on the northern side of the Tapi River, play a vital role in the ecology of the Khandesh region. This area encompasses the Chopda, Yawal, and Raver ranges, characterized by a rainfall ranging from 70 to 101 cm annually. The dominant tree species in these forests include Tectona grandis (teak), Acacia catechu, Anogeissus latifolia, Terminalia tomentosa, Boswellia serrata, Terminalia arjuna, and Butea monosperma. These species contribute to the region's rich biodiversity and support various ecological functions.
In contrast, the scrub forests located on the southern side of the Tapi River exhibit a different ecological profile. With average rainfall varying from 38 to 63 cm and summer temperatures soaring up to 48°C, the vegetation here is less dense and more sparse. Prominent species in this area include Acacia catechu, Anogeissus latifolia, Boswellia serrata, Hardwickia binata, and Ziziphus jujuba. This region’s harsh climatic conditions limit the growth and diversity of plant life.
Khandesh, positioned in the northwestern corner of the Deccan Plateau, lies within the valley of the Tapi River. It is bounded by the Satpura Range to the north, the Berar (Vidarbha) region to the east, the Ajanta hills to the south, and the northern ranges of the Western Ghats to the west. The principal river, the Tapi, flows westward—a unique characteristic compared to most rivers in the Deccan, which typically flow eastward to the Bay of Bengal. The Tapi is fed by thirteen major tributaries, although none are navigable, and its deep riverbed historically hindered irrigation efforts.
Most of Khandesh is situated south of the Tapi River, drained by its tributaries such as the Girna, Bori, and Panjhra. The alluvial plain north of the river features some of the richest agricultural land in the region, while the landscape gradually ascends towards the Satpuda hills. Central and eastern Khandesh are predominantly flat, except for a few low ranges of barren hills. To the north and west, the terrain transitions into rugged hills, which are thickly forested and home to the tribal Bhil communities. This ecological diversity and the presence of unique flora provide significant opportunities for research and development in natural products and drug delivery systems.
KHANDESH REGION OVERVIEW
The Khandesh region, historically known as a former administrative division of British India, encompasses the modern-day districts of Jalgaon, Dhule, Nandurbar, and parts of Nashik in Maharashtra. This region is characterized by a rich tapestry of towns and villages, each contributing to its cultural and economic landscape.
KEY DISTRICTS AND TOWNS
HISTORICAL SIGNIFICANCE
Khandesh has historical significance, with Burhanpur (in Madhya Pradesh) serving as the capital of the old Khandesh province. Asirgarh, also in Madhya Pradesh, is part of this historical legacy.
GEOGRAPHY
Nandurbar District extends between 21°00’ to 22°30’ North latitude and 73°47’ to 74°47’ East longitude, and its northern boundary is defined by the Narmada River. The geography of Khandesh is diverse, featuring plains, hills, and river valleys, making it rich in natural resources and biodiversity.
This multifaceted region, with its blend of cultural heritage and ecological diversity, offers substantial potential for research and development, particularly in the areas of agriculture, natural products, and sustainable practices.
TRIBAL LIFE OF NANDURBAR DISTRICT
The tribal population of Nandurbar District primarily inhabits the valleys of the Satpura range, extending along the northern side of the Tapi River. This hilly region consists of six ranges: Taloda, Akkalkuwa (East and West), Kathi, Molgi, and Manibeli. These areas, known as tribal pockets, feature villages referred to as "Padav."
Major Tribes
SOCIAL STRUCTURE AND PRACTICES
The social structure of these tribes often reflects patriarchal dominance, evidenced by practices such as polygamy, where families commonly consist of 2-3 wives and 10-12 children. Superstitious beliefs are prevalent, with witchcraft, locally referred to as "Dakin," being a common practice among these communities.
As part of modern interventions, government policies have facilitated the education of tribal children through Ashram schools, aiming to integrate them into the broader educational framework.
CULTURAL SIGNIFICANCE AND CONSERVATION
A notable aspect of tribal life is the reverence for sacred groves, such as the "Wagdeo gaga," which serve as critical elements of forest conservation. These sacred spaces reflect the tribes' deep-rooted connection to their environment and their role in maintaining ecological balance.
INDIGENOUS KNOWLEDGE AND MEDICINAL PRACTICES
The tribes possess a wealth of indigenous knowledge about the vegetation surrounding them, passed down through generations. This knowledge has led to the discovery of various plant-based remedies for ailments, showcasing the tribes' resourcefulness and understanding of their natural environment.
RESEARCH AND DOCUMENTATION
Given the rich tapestry of culture, tradition, and ecological knowledge within these tribes, the present investigation aims to document their indigenous practices and the native uses of different plants. This research not only honors their heritage but also contributes to the broader understanding of traditional medicine and conservation practices, providing valuable insights for both scientific study and cultural preservation.
NATURAL GUM FOUND IN THE KHANDESH REGION
The Khandesh region, with its diverse flora, is home to various natural gums that are integral to the local economy and the livelihoods of forest-dwelling communities. Gums are produced from woody plants through natural processes, such as exudation from bark cracks or damage caused by insects and animals. Additionally, gum production can be artificially induced through incisions in the bark, allowing for the collection of viscous nodules that are easily harvested.
CHARACTERISTICS OF GUMS
Gums are complex carbohydrate derivatives, primarily polysaccharides, and can either be soluble in water or form mucilages when absorbing large amounts of water. They exhibit hydrophilic properties and are generally composed of monosaccharide units linked by glucosidic bonds. These natural gums are typically insoluble in oils or organic solvents, making them valuable for various applications.
USES OF GUMS
PRODUCTION AND ECONOMIC IMPACT
India produces around 5,000 tons of plant-based gums annually, with major production states including Maharashtra, Madhya Pradesh, Chhattisgarh, and others. In 2006-07, India exported 1,730.24 tons of plant-based gums valued at approximately ?22.18 crore, while imports reached 19,464.08 tons valued at around ?58.79 crore.
COMMERCIALLY IMPORTANT GUMS
Some of the most significant gums produced in India include:
Gum tragacanth, derived from Astragalus species in Asia Minor, is particularly valuable as a natural emulsifier in food products like mayonnaise, though its high cost has led to a shift towards synthetic alternatives. Other gums of commercial interest come from plants such as carob (Ceratonia siliqua), gum mesquite (Prosopis latifolia), and Indian squill (Urginea indica).
GUMS FOUND IN THE KHANDESH REGION
The Khandesh region, particularly in the Nandurbar and Dhule districts, is rich in various natural gums sourced from diverse plant species. Below is a list of notable gum-producing plants, along with their local names:
IMPORTANCE OF GUMS
These gum-producing species not only contribute to the local economy but also play significant roles in traditional medicine, food, and various industrial applications. The collection and sale of these gums provide a vital source of income for many forest-dwelling communities in the Khandesh region.
ADVANTAGES OF NATURAL GUM
Natural gums offer a wide range of benefits across various industries, making them valuable resources. Here are some key advantages:
Thickening Agents: Enhancing the texture of food products.
Gelling Agents: Providing structure to jellies, jams, and desserts.
Emulsifying Agents: Stabilizing mixtures of oil and water in dressings and sauces.
Stabilizers: Preventing separation in products like dairy and beverages.
DISADVANTAGES OF NATURAL GUMS
While natural gums offer numerous advantages, they also have some drawbacks that can affect their use across various applications. Here are key disadvantages:
CLASSIFICATION OF GUMS
Gums can be classified based on several criteria, including charge, source, shape, and chemical structure. Here’s a detailed overview:
1. According to Charge
2. According to Source
3. According to Shape
4. According to Monomeric Units in Chemical Structure
APPLICATION IN SUSTAINED RELEASE DRUG DELIVERY SYSTEMS
Natural gums are particularly valuable in the formulation of sustained-release (SR) drug delivery systems. They offer several advantages:
MATRIX SYSTEM CHARACTERISTICS
The matrix system is a widely utilized method for controlling drug release in pharmaceutical formulations. This system is essential for achieving a delayed and sustained release of drugs, where the active ingredient is either dissolved or dispersed within a matrix that resists disintegration. Here are the key characteristics that define matrix systems and differentiate them from other controlled release dosage forms:
1. Physical State of Drug
2. Chemical Nature of Support
3. Route of Administration
4. Matrix Shape and Alteration in Volume Over Time
5. Release Kinetic Model
ADVANTAGES OF MATRIX SYSTEM
DISADVANTAGES OF MATRIX DRUG DELIVERY SYSTEMS
CLASSIFICATION OF MATRIX TABLET
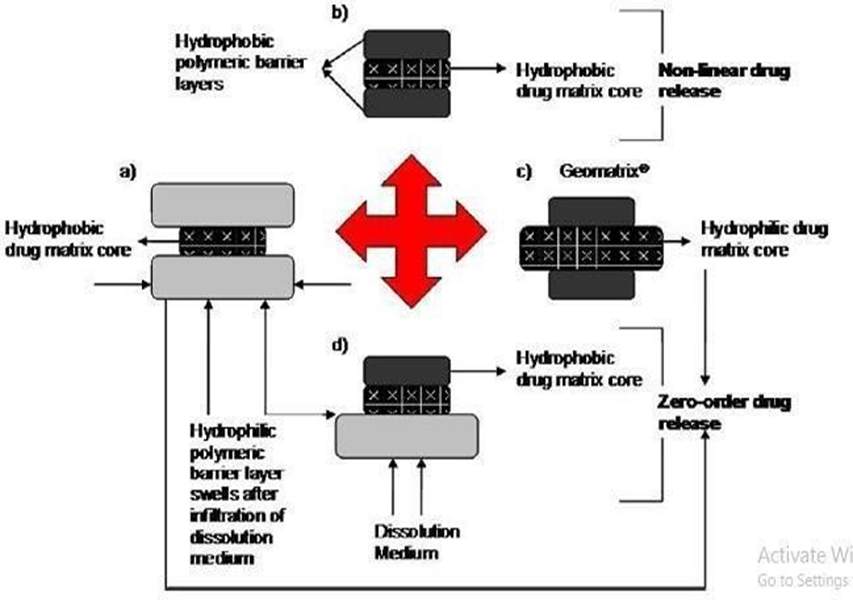
Fig. 1: Possible drug release mechanism from various matrix systems
A) LIPID MATRIX SYSTEM
Overview:
Lipid matrix systems are drug delivery formulations where the active pharmaceutical ingredient (API) is embedded within a hydrophobic lipid or waxy matrix. These systems are designed to provide controlled and sustained release of the drug.
Mechanism of Release:
ADVANTAGES OF LIPID MATRIX SYSTEMS
DISADVANTAGES OF LIPID MATRIX SYSTEMS
B) INSOLUBLE POLYMER MATRIX SYSTEMS
Overview:
Insoluble polymer matrix systems are drug delivery formulations where the active pharmaceutical ingredient (API) is embedded within an inert, insoluble polymer matrix. This type of system is designed to provide controlled and sustained release of the drug over an extended period.
Mechanism of Release:
ADVANTAGES OF INSOLUBLE POLYMER MATRIX SYSTEMS
DISADVANTAGES OF INSOLUBLE POLYMER MATRIX SYSTEMS
C) HYDROPHILIC MATRICES
Overview:
Hydrophilic matrices, also known as swellable-soluble matrices, are a type of controlled drug delivery system that utilizes hydrophilic colloids to facilitate the sustained release of active pharmaceutical ingredients (APIs). These matrices are designed to swell upon contact with aqueous media, forming a gel-like structure that modulates drug release.
MECHANISM OF RELEASE:
Nature of Colloid: Different hydrophilic polymers will have varying swelling capacities and erosion rates, which directly impact the drug release profile.
Viscosity and Molecular Weight: Higher viscosity or molecular weight polymers may result in slower drug release due to increased resistance to diffusion.
ADVANTAGES OF HYDROPHILIC MATRICES
DISADVANTAGES OF HYDROPHILIC MATRICES
D) BIODEGRADABLE MATRICES
Overview:
Biodegradable matrices are designed to release drugs in a controlled manner while gradually degrading within the body. These matrices are made from polymers that can be broken down by biological processes, making them suitable for various pharmaceutical applications.
MECHANISM OF RELEASE:
ADVANTAGES OF BIODEGRADABLE MATRICES
Since these matrices are designed to break down naturally, they do not require surgical intervention for removal after drug release, minimizing patient discomfort and risk.
The degradation rate can be tailored by selecting specific polymers and adjusting their chemical composition, allowing for precise control over the drug release kinetics.
Biodegradable matrices are often made from biocompatible materials, reducing the likelihood of adverse reactions and improving patient tolerance.
These systems can be used for targeted delivery of drugs to specific tissues or organs, enhancing therapeutic efficacy while minimizing systemic side effects.
DISADVANTAGES OF BIODEGRADABLE MATRICES
Developing biodegradable matrices with consistent and predictable release profiles can be challenging, requiring extensive characterization and optimization.
Variability in polymer production can lead to differences in degradation rates and drug release characteristics, impacting overall efficacy.
Biodegradable materials may have limited shelf-life, especially if they are sensitive to moisture, temperature, or light.
In some cases, the matrix may not fully degrade, leading to concerns about residual materials causing inflammatory responses or other complications.
E) MINERAL MATRICES
Overview:
Mineral matrices are derived from natural polymers, primarily obtained from various species of seaweeds. These matrices utilize biopolymers like alginic acid, which is renowned for its unique properties that make it suitable for controlled drug delivery systems.
Key Features:
MECHANISM OF RELEASE:
ADVANTAGES OF MINERAL MATRICES:
DISADVANTAGES OF MINERAL MATRICES:
COMPONENTS OF MATRIX TABLETS
Matrix tablets are designed for controlled release of active pharmaceutical ingredients (APIs) over an extended period. The formulation of matrix tablets involves various components, each playing a specific role in the drug delivery system. Here’s an overview of the key components:
Channeling Agents: These substances create pores or channels within the matrix, enhancing the rate of drug release. Examples include mannitol and certain surfactants.
Wicking Agents: These agents help draw water into the matrix, facilitating the drug’s dissolution and release. They can improve the hydration and swelling properties of the matrix.
RATIONALE FOR DEVELOPING SUSTAINED RELEASE MATRIX DEVICES
The development of sustained release matrix devices is driven by several key objectives that enhance therapeutic efficacy and patient adherence. Here’s a closer look at the rationale:
Sustained release formulations are designed to release the drug over an extended period, maintaining therapeutic levels in the bloodstream for longer durations. This is particularly beneficial for drugs with short half-lives.
By providing a slow and controlled release of the drug, these devices can decrease the number of doses a patient needs to take throughout the day. This is especially advantageous for chronic conditions, improving patient compliance.
Sustained release formulations help achieve more consistent drug absorption and action among different individuals (inter-subject variability) and within the same individual over time (intra-subject variability). This results in more predictable therapeutic outcomes.
These devices aim to maintain steady plasma drug concentrations, reducing peaks and troughs associated with conventional dosing regimens. This can lead to improved safety and efficacy, especially for narrow therapeutic index drugs.
POLYMERS USED IN MATRIX TABLETS
There are number of polymers which may be used to formulate matrix tablets depending on the physicochemical properties of the drug substance to be incorporated into matrix system and drug release profile required. Polymers used for matrix tablets may be classified as:
POLYMERS USED IN MATRIX TABLETS
The choice of polymer in matrix tablet formulation is critical as it influences the drug release profile, stability, and overall performance of the dosage form. Here’s a classification of commonly used polymers:
1. Hydrogels
2. Soluble Polymers
3. Biodegradable Polymers
4. Non-Biodegradable Polymers
5. Mucoadhesive Polymers
6. Natural Gums
1) MUCOADHESIVE POLYMERS
2) NATURAL GUMS
TYPES OF MATRIX SYSTEMS
The matrix system can be categorized based on the types of retarding agents or polymeric materials used:
CLINICAL CONTEXT: INFLAMMATION AND DRUG DELIVERY
Inflammation is a key feature in various conditions, including autoimmune diseases and is characterized by redness, heat, pain, swelling, and loss of function. Effective treatment requires maintaining consistent drug concentrations in the body. Sustained-release dosage forms are designed to deliver drugs at a slow release rate over an extended period, which is particularly beneficial in managing chronic inflammatory conditions.
Example: Aceclofenac
Aceclofenac is a non-steroidal anti-inflammatory drug (NSAID) used to treat rheumatoid arthritis, osteoarthritis, and ankylosing spondylitis. It has a short biological half-life of about 4 hours, necessitating frequent dosing. Formulating aceclofenac into sustained-release dosage forms can reduce the frequency of administration and improve patient compliance.
Example: Guggul
Guggul is the oleogum resin from Commiphora mukul, known for its hypolipidemic properties and various therapeutic uses, including treatment of nervous disorders, skin conditions, and hypertension. Guggul resin is utilized in pharmaceuticals as a binding agent and rate-retarding polymer, making it suitable for sustained-release formulations.

Fig: 2 - (a) Guggul tree (b) Guggul gum
Isolation of Guggul Gum
MATERIALS:
PROCEDURE:
NEED AND OBJECTIVE
Need for Study
Pain and inflammation pose significant challenges in modern medicine, particularly in the context of autoimmune diseases. Inflammation is a critical response of the immune system to various stimuli, including injury, infection, environmental agents, malignancy, and cellular alterations. This physiological process is characterized by redness, heat, pain, swelling, and loss of function, making effective management essential.
The success of anti-inflammatory treatments relies heavily on maintaining appropriate drug concentrations within the body. Sustained release dosage forms, which gradually release the drug over an extended period, are instrumental in achieving this goal. Among various routes of administration, the oral route has garnered the most attention due to its complexity, convenience, and safety profile. Matrix tablets, consisting of a drug combined with release-retarding materials, represent a straightforward approach to designing sustained release systems.
This study aims to develop and evaluate a safe and effective anti-inflammatory matrix tablet incorporating Aceclofenac with Boswellia serrata, utilizing a blend of hydrophobic and hydrophilic polymers. Aceclofenac, a non-steroidal anti-inflammatory drug (NSAID), is widely used for treating conditions such as rheumatoid arthritis, osteoarthritis, and ankylosing spondylitis. As a newer derivative of diclofenac, Aceclofenac has fewer gastrointestinal complications and a relatively short biological half-life of approximately 4 hours, necessitating multiple doses throughout the day. This characteristic makes it an ideal candidate for modified release formulations, aiming to enhance patient compliance by reducing dosing frequency.
Additionally, Guggul (from Commiphora mukul) is notable for its hypolipidemic properties, contributing further therapeutic potential when combined with Aceclofenac. The inclusion of Boswellia serrata, known for its anti-inflammatory effects, complements the formulation, enhancing its overall efficacy. Through this research, we seek to establish a sustained release matrix tablet that optimally delivers Aceclofenac, ultimately improving treatment outcomes for patients experiencing chronic pain and inflammation.n In the formulation of sustained release matrix tablets, inactive pharmaceutical ingredients play a crucial role as binding agents and rate-retarding polymers. These excipients not only enhance the mechanical properties of the tablets but also modulate the release profile of the active ingredient, ensuring a consistent therapeutic effect over time.
Guggul, derived from Commiphora mukul, serves as an effective binding agent and is rich in active compounds known for various therapeutic benefits. Its applications extend beyond its role in drug formulations; it is traditionally used to treat a range of conditions, including nervous diseases, leprosy, muscle spasms, skin disorders, ulcerative pharyngitis, hypertension, ischemia, and urinary disorders. The incorporation of guggul can potentially enhance the bioavailability and efficacy of the active drug.
Aceclofenac, classified as a Class II drug in the Biopharmaceutical Classification System (BCS), presents challenges related to solubility and gastrointestinal tolerance. Oral administration can lead to significant gastric irritation and side effects such as nausea and vomiting. To address these issues, a matrix tablet formulation was developed. By integrating Aceclofenac with natural polymers, the solubility and stability of the drug can be improved, leading to a more favorable release profile and enhanced patient compliance.
The combination of guggul and hydrophilic polymers in the matrix tablet aims to create an optimal environment for sustained drug release, mitigating the side effects associated with Aceclofenac while maximizing its therapeutic potential. This formulation strategy not only seeks to improve the patient experience but also contributes to more effective management of chronic pain and inflammation.
OBJECTIVES
The primary objective of this study is to develop and evaluate sustained release matrix tablets of Aceclofenac. The specific objectives are as follows:
To determine the preformulation factors of Aceclofenac, including melting point and the establishment of a standard calibration curve in pH 7.4 phosphate buffer.
To conduct compatibility studies between Aceclofenac and various excipients to ensure stability and efficacy in the formulation.
To assess the pre-compression parameters of the powder blend, ensuring optimal flowability and compressibility for tablet formulation.
To formulate sustained release matrix tablets of Aceclofenac using both natural (Guggul gum) and synthetic polymers (HPMC K 200M).
To evaluate the prepared sustained release matrix tablets by conducting various post-compression tests, including hardness, friability, and drug release studies.
To study and investigate the effects of different concentrations of natural polymers on the sustained release profile of Aceclofenac and their impact on drug release kinetics.
PLAN OF WORK

DRUG AND EXCIPEINT PROFILE
DRUG, POLYMER AND EXCIPIENT PROFILE
ACECLOFENAC
Description:
Aceclofenac is a non-steroidal anti-inflammatory drug (NSAID) that exhibits site-specific action at the inflammation site, leading to enhanced efficacy in treating inflammatory conditions. It is generally well tolerated throughout the body.
Appearance: White or almost white crystalline powder.
Dosage: The maximum recommended dose is 200 mg, typically administered as two separate doses of 100 mg one tablet in the morning and one in the evening.
Solubility:
CAS Registry Number: 89796-99-6
Molecular Weight: 354.19 g/ mol
Molecular Formula: C??H??Cl?NO?
BCS Classification: Class II (indicating low solubility and high permeability).
STRUCTURAL FORMULA OF ACECLOFENAC

Fig: 3 Structure of Aceclofenac
IUPAC Name: - 2-[(2, 6-Dichlorophenyl) amino] phenyl] acetyl] oxy] acetic acid.
Half life - 4 - 4.3 hrs
MECHANISM OF ACTION OF ACECLOFENAC
Aceclofenac is a novel NSAID with a multifactorial mechanism of action, allowing it to effectively manage inflammation and pain. The key mechanisms include:
ABSORPTION OF ACECLOFENAC
DISTRIBUTION OF ACECLOFENAC
METABOLISM OF ACECLOFENAC
ELIMINATION OF ACECLOFENAC
CHARACTERISTICS IN PATIENTS
CONTRAINDICATIONS OF ACECLOFENAC
Aceclofenac is contraindicated in the following situations:
INTERACTIONS WITH OTHER MEDICINAL PRODUCTS
Aceclofenac has potential interactions with various medications, and the following combinations should be avoided or monitored closely:
COMBINATIONS REQUIRING DOSE ADJUSTMENTS AND PRECAUTIONS
OTHER POSSIBLE INTERACTIONS
There have been isolated reports indicating that Aceclofenac may exhibit hypoglycemic effects. Therefore, when administering Aceclofenac, it is important to consider the following:
USE DURING PREGNANCY AND LACTATION
EFFECTS ON ABILITY TO DRIVE AND USE MACHINES
Patients taking Aceclofenac or other NSAIDs who experience dizziness or any central nervous system disturbances should refrain from driving or operating machinery. Such symptoms can impair coordination and reaction times, posing a safety risk.
Indications of Aceclofenac
Gonalgia (Knee Pain): Aceclofenac is indicated for the management of knee pain, known as gonalgia.
Clinical Study
A controlled double-blind study was conducted comparing Aceclofenac with Diclofenac in 40 patients suffering from acute or chronic gonalgia. The results showed that Aceclofenac demonstrated slightly superior activity compared to Diclofenac; however, the difference was not statistically significant.
ACECLOFENAC IN OSTEOARTHRITIS
Aceclofenac is indicated for the management of osteoarthritis, particularly in the knee.
Efficacy
In patients with knee osteoarthritis, Aceclofenac has been shown to:
The effectiveness of Aceclofenac in these areas is comparable to that of other NSAIDs such as Diclofenac, Piroxicam, and Naproxen.
MECHANISM OF ACTION OF ACECLOFENAC
Aceclofenac is a novel non-steroidal anti-inflammatory drug (NSAID) that exhibits a multifaceted mechanism of action:
ABSORPTION OF ACECLOFENAC
Aceclofenac is rapidly absorbed following oral administration, with nearly 100% bioavailability. The peak plasma concentration is typically reached between 1.25 to 3 hours after ingestion.
DISTRIBUTION OF ACECLOFENAC
Aceclofenac is characterized by its high protein binding, with over 99.7% of the drug bound to plasma proteins. This extensive binding influences its pharmacokinetics and therapeutic effects.
METABOLISM OF ACECLOFENAC
Aceclofenac is primarily metabolized in the liver through the cytochrome P450 enzyme CYP2C9. The main metabolite produced is 4-OH Aceclofenac, which possesses anti-inflammatory properties.
ELIMINATION OF ACECLOFENAC
CHARACTERISTICS IN PATIENTS
CONTRAINDICATIONS OF ACECLOFENAC
Aceclofenac is contraindicated in the following situations:
INTERACTIONS WITH OTHER MEDICINAL PRODUCTS
Aceclofenac may interact with several medications, and the following combinations should be avoided or used with caution:
INTERACTIONS REQUIRING DOSE ADJUSTMENTS AND PRECAUTIONS
Certain combinations of aceclofenac with other medications may necessitate careful monitoring, dose adjustments, or additional precautions:
OTHER POSSIBLE INTERACTIONS
There have been isolated reports indicating that aceclofenac may produce hypoglycemic effects. Consequently, when aceclofenac is administered alongside hypoglycemic agents (such as insulin or oral antidiabetic medications), it may be necessary to consider adjustments to their dosages to prevent excessive lowering of blood glucose levels.
Monitoring blood glucose levels in patients taking aceclofenac, especially those with diabetes or on antidiabetic therapy, is advisable to ensure safe and effective management.
USE DURING PREGNANCY AND LACTATION
Effects on Ability to Drive and Use Machines
Patients who experience dizziness or other central nervous system disturbances while taking NSAIDs, including aceclofenac, should refrain from driving or operating machinery. It is important to ensure that they are fully aware of how the medication affects them before engaging in such activities.
INDICATIONS OF ACECLOFENAC
Polymer Profile: Guggul Gum
Source and Description Guggul is the gum resin obtained from two plants: Commiphora mukul and Boswellia serrata.
Isolation of Guggul Gum
Properties
Uses
Modern therapeutic applications of guggul include:
HYDROXYPROPYL METHYLCELLULOSE (HPMC)
Non-Proprietary Names:
Synonyms:
Overview
Hydroxypropyl methylcellulose (HPMC) is a semi-synthetic polymer derived from cellulose. It is widely used in pharmaceutical formulations, food products, and various industrial applications due to its unique properties.
KEY PROPERTIES
Applications
STRUCTURAL FORMULA:

Fig :4 Hydroxy Propyl Methyl Cellulose
HYDROXYPROPYL METHYLCELLULOSE (HPMC)
Chemical Information:
Functional Category:
APPLICATIONS IN PHARMACEUTICAL FORMULATION OR TECHNOLOGY
1. Oral Formulations:
COMMERCIAL EXAMPLES OF FILM-COATING MATERIALS:
2. Ophthalmic Formulations:
3. Topical Formulations:
4. Additional Uses:
Description
HPMC is an odourless and tasteless, white or creamy-white fibrous or granular powder.
Browns at 190–200°C; chars at 225–230°C. Glass transition temperature is 170 – 180°C.
Soluble in cold water, forming a viscous colloidal solution; practically insoluble in chloroform, ethanol (95%) and ether, but soluble in mixtures of ethanol and
dichloromethane, mixtures of methanol and dichloromethane, and mixtures of water and alcohol
A wide range of viscosity types are commercially available. Aqueous solutions are most commonly prepared; Dichloromethane and ethanol mixtures may also be used to prepare viscous Hypromellose solutions. Solutions prepared using organic solvents tend to be more viscous; increasing concentration also produces more viscous solutions.
Hypromellose powder is a stable no. material, although it is hygroscopic after drying. Solutions are stable no. at pH 3–11. Hypromellose powder should be stored in a well- closed container, in a cool, dry place.
Hypromellose is incompatible with some oxidizing agents. Since it is non-ionic, Hypromellose will not complex with metallic salts or ionic organics to form insoluble precipitates.
EXCIPIENT PROFILE MAGNESIUM STEARATE
Synonym: Magnesium octadecanoate, octadecanoic acid, magnesium salt; stearic acid, magnesium salt.
Chemical name: Octadecanoic acid magnesium salt.
Structural Formula: [CH3 (CH2)16COO] 2Mg

Fig :5 Magnesium Stearate
Empirical formula and molecular weight: C36H70MgO4; 591.34
Magnesium Stearate
Description:
Magnesium stearate is a very fine, light white powder that is precipitated or milled, characterized by a low bulk density. It has a faint odor of stearic acid, a greasy texture, and readily adheres to the skin.
Functional Category:
Application in Pharmaceutical Formulation: Magnesium stearate is widely used in cosmetics, food products, and pharmaceutical formulations. It serves primarily as a lubricant in the manufacture of capsules and tablets, typically at concentrations between 0.25% and 5.0% w/w. It is also utilized in barrier creams.
Typical Properties:
Stability and Storage Conditions: Magnesium stearate is stable and should be stored in a well-closed container in a cool, dry place.
Talc
Description:
Talc is a mineral composed of hydrated magnesium silicate. It is characterized by its light to dark green, brown, or white color and exhibits a foliated to fibrous crystal habit.
Synonyms:
Functional Category:
Application of Talc:
Talc is used across various industries, including:
A coarse, greyish-green high-talc rock known as soapstone or steatite has applications in stoves, sinks, electrical switchboards, crayons, and soaps, owing to its resistance to heat, electricity, and acids.
APPLICATIONS IN PHARMACEUTICAL FORMULATION OR TECHNOLOGY:
Talc was traditionally used in oral solid dosage formulations as a lubricant and diluent, though its usage has decreased over time. It is still widely employed as a dissolution retardant in the development of controlled-release products.
Table no 1: Uses of Talc
|
USE |
CONCENTRATION (%) |
|
Dusting powder |
90.0–99.0 |
|
Glidant and tablet lubricant |
1.0–10.0 |
|
Tablet and capsule diluents |
5.0–30.0 |
TALC
Description:
Talc is a very fine, white to grayish-white, odorless, impalpable, unctuous, crystalline powder. It adheres readily to the skin, is soft to the touch, and is free from grittiness.
Functional Uses:
Typical Properties:
Stability and Storage Conditions:
POLYVINYL PYRROLIDONE
Synonyms: Kollidon, Plasdone, Povidone
Chemical Name: 1-Ethyl, 2-pyrrolidone homopolymer
Molecular Weight: 2500 – 30, 00,000

Fig: 6: Polyvinyl Pyrrolidone
Functional Category Disintegrant, dissolution aid, suspending agent, tablet binder.
Description: It is a fine white to creamy white coloured, odourless, hygroscopic powder.
Solubility: Freely soluble in acids, chloroform, ethanol, ketones, methanol and water, practically insoluble in ether, hydrocarbons and mineral oil.
Viscosity: 1.3 -700 mPa s
Incompatibility: It is compatible with wide range of organic salts, natural andsynthetic resins.
LACTOSE
Non-Proprietary Names:
Synonyms:
Chemical Name and CAS Registry Number: O-?-D-Galactopyranosyl-(1?4)-?-D-glucopyranose
CAS Number: 63-42-3
Empirical Formula and Molecular Weight:
Description:
Anhydrous lactose appears as white to off-white crystalline particles or powder. It typically contains 70–80% anhydrous ?-lactose and 20–30% anhydrous ?-lactose.
Functional Category:
Applications in Pharmaceutical Formulation or Technology: Anhydrous lactose is extensively used in:
METHODOLOGY
EQUIPMENTS:
Table 3: List of Equipments and their Manufacturer
|
Sr. No. |
Instruments |
Manufacturer |
|
1. |
Tablet compression machine |
Rimek Model: DL 09 Station Tablet Compression machine, Karnavati Engineering Ltd. |
|
2. |
Digital Balance |
Shimadzu Corporation, Japan |
|
3. |
Venire calliper |
Stainless Calliper |
|
4. |
Hardness tester |
Monsanto |
|
5. |
Friability test apparatus |
Electrolab – EF2(USP) |
|
6. |
Tablet Dissolution Apparatus |
Electro lab – TDT – 08L (USP) |
|
7 |
UV Spectrophotometer |
SHIMADZU- UV 1800 |
|
10 |
Stability Chamber |
Lab techno Mumbai. |
METHODS FOR PREFORMULATION STUDY OF ACECLOFENAC
CHARACTERIZATION OF ACECLOFENAC
1. Identification of Pure Drug
Identification of Aceclofenac was performed using several analytical techniques:
2. Determination of Melting Point
The melting point of Aceclofenac was determined using the capillary method, following these steps:
FT-IR Analysis of Aceclofenac and Different Polymers
Objective:
To characterize pure Aceclofenac and various polymers through Fourier Transform Infrared Spectroscopy (FT-IR).
Materials and Equipment:
Methodology:
The Nujol-sample mixture was placed between two KBr plates.
Differential Scanning Calorimetry (DSC) Analysis
Objective:
To assess the physical interactions between Aceclofenac and various polymers used in the formulation of different dosage forms through thermal analysis.
Materials and Equipment:
• Shimadzu DSC 60 (Japan)
• Aluminium crucibles
• Nitrogen gas supply
Methodology:
1. Sample Preparation:
Weighing: Exactly 5 to 6 mg of each sample (Aceclofenac and the polymers) was accurately weighed.
Sealing: The samples were hermetically sealed in aluminium crucibles to prevent moisture absorption and contamination during the analysis.
2. DSC Analysis Setup:
The sealed crucibles were placed in the DSC instrument.
The temperature was increased at a constant rate of 10°C/min over a defined range of 40°C to 300°C.
3. Inert Atmosphere:
An inert atmosphere was maintained throughout the analysis by purging nitrogen gas at a flow rate of 50 ml/min. This step is crucial to eliminate oxidative degradation and ensure accurate thermal measurements.
4. Data Collection:
The DSC curves were recorded, showing the heat low versus temperature, allowing for the dentification of melting points, glass transitions, and any thermal interactions between the drug and polymers.
Stability and Storage Condition: Stable under normal condition, unstable to heat at 150º C. It should be stored in an air tight container in a cool, dry place.
Safety: It regarded as non-toxic since it not absorbed by GIT. It is non-irritant.
Standardization of Polymers
Polymers utilized in the research were characterized and standardized through FT-IR spectroscopy and Differential Scanning Calorimetry (DSC). These techniques provide essential data regarding the chemical structure and thermal properties of the polymers, ensuring their suitability for use in formulations.
FLOW PROPERTIES OF DRUG, EXCIPIENTS, POLYMERS, AND BLEND
A) DENSITY MEASUREMENT
A.1. BULK DENSITY
Objective:
To determine the bulk density of the drug and excipients, which is a critical parameter affecting flow properties and processing of powders.
Materials:
Methodology:
Bulk density = Weight of powder / Bulk volume
Where:
Weight of Powder (g) is the mass of the drug/excipient used (5 g).
Bulk Volume (ml) is the volume obtained from the graduated cylinder after leveling.
A.2. SIGNIFICANCE OF BULK DENSITY
Bulk density is an important factor influencing the flowability, compressibility, and handling characteristics of powders. A higher bulk density indicates better packing of particles, which can enhance flow properties during the formulation process.
TAPPED BULK DENSITY AND CARR’S INDEX
B.1. TAPPED BULK DENSITY
Objective:
To determine the tapped bulk density of the drug or excipient, which is essential for understanding the compressibility and flow characteristics of the powder.
Materials:
Methodology:
Place the cylinder in the mechanical tapped density tester.
Raise the cylinder and allow it to drop under its own weight. The tester should provide a fixed drop of 14 ± 2 mm at a nominal rate of 300 drops per minute.
Tap the cylinder 500 times initially, then measure the tapped volume (V?) to the nearest graduated unit.
Calculate the tapped bulk density (g/ml) using the formula:
Tapped Density = Weight of Powder (g)
Tapped Volume (ml)
B. 2. Carr’s Index
Objective:
To evaluate the compressibility of the powder blend, which is crucial for understanding how the material behaves during processing.
Methodology:
TD = Tapped Density
BD = Bulk Density
B.3. Significance of Tapped Density and Carr’s Index
Carr’s Index: A higher Carr’s Index indicates poor flow properties and higher compressibility, while a lower index suggests good flowability and less compressibility. This information is crucial for optimizing formulation processes.
Table 4: Effect of Carr’s Index and Hausner’s Ratio on flow property
|
Carr’s Index (%) |
Flow |
Hausner’s Ratio |
|
1-10 |
Excellent |
1.00-1.11 |
|
11-15 |
Good |
1.12-1.18 |
|
16-20 |
Fair to passable* |
1.19-1.25 |
|
21-25 |
Poor* |
1.26-1.34 |
|
26-31 |
Very poor |
1.35-1.45 |
|
32-37(>38) |
Extremely poor |
1.46-1.59 (>1.60) |
Hausner’s Ratio = TD / BD
The angle of repose of Aceclofenac Hcl powder was determined by the funnel method. The accurately weight powder blend were taken in the funnel. The height of the funnel was adjusted in such a way the tip of the funnel just touched the apex of the powder blend. The powder blend was allowed to flow through the funnel freely on to the surface. The diameter of the powder cone was measured and angle of repose was calculated using the following equation.
Tan ? = h/r
Where, h and r are the height and radius of the powder cone respectively.
Table 5: Effect of Angle of repose on Flow property
|
Angle of repose (?) |
Flow |
|
<25> |
Excellent |
|
25-30 |
Good |
|
30-40 |
Passable |
|
>40 |
Very poor |
C) Preparation of Standard Calibration Curve of Aceclofenac in Phosphate Buffer pH 7.4
a) Preparation of Phosphate Buffer pH 7.4
Materials Needed:
Procedure:
b) Standard Calibration Curve of Aceclofenac
Materials Needed:
Procedure:
Plotting the Curve:
Preparation of Aceclofenac Matrix Tablets
Methodology
Wet Granulation Method:
Gather all necessary materials: Aceclofenac, HPMC K200 (retardant), Guggul gum, lactose (diluent), PVPK30 (binder), magnesium stearate, and talc.
Mixing:
Granulation:
Sieving:
Final Mixing:
Compression:
Table 6: Composition of Trial Batches
|
Ingredients (mg) |
Formulation Code |
|
|
T1 |
T2 |
|
|
Aceclofenac |
100 |
100 |
|
Guggul gum |
30 |
60 |
|
HPMCK200 |
25 |
50 |
|
Talc |
5 |
5 |
|
Mg. stearate |
7 |
7 |
|
PVPK30 |
20 |
20 |
|
Lactose |
113 |
58 |
|
Total |
300 |
300 |
Optimization by using full factorial designs
In the present study, a 3 full factorial design was employed to study the effect of independent variables, i.e. amount of … Guggul Gum …(X1) and… HPMC K 200 M … (X2) on dependent variables.
A statistical model (see equation) Incorporating interactive and polynomial terms was utilized to evaluate the responses.
Y = b0 + b1X1+b2X2 + b12X1X2 + b11X12 + b22X22 …..
Where, Y is the dependent variables, b0 is the arithmetic mean response of the nine runs, and b1 is the estimated coefficient for the factor X1. The main effects (X1 and X2) represent the average result of changing one factor at a time from its low to high value. The interaction terms (X1X2) show how the response changes when two factors are simultaneously changed. The polynomial terms (X1 and X2) are included to investigate non-linearity. The results indicate that all the dependent variables are strongly dependent on the selected independent variables as they show a wide variation among the nine batches (F1 to F9). The polynomial equation can be used to draw conclusions after considering the magnitude of coefficient and the mathematical sign it carries, i.e. positive or negative. The high values of correlation coefficient for the dependent variables indicate a good fit. The equation may be used to obtain estimate of the response because small error of variance was noticed in the replicates. 32 full factorial design was applied to study the effect of independent variables, i.e. concentration of HPMC K 200 M & Guggul gum. On dependent variables like % drug release.
Table 7: Layout of full factorial design batches of matrix Tablets F1-F9
|
Batch No. |
X1 |
X2 |
|
F1 |
-1 |
-1 |
|
F2 |
-1 |
0 |
|
F3 |
-1 |
1 |
|
F4 |
0 |
-1 |
|
F5 |
0 |
0 |
|
F6 |
0 |
1 |
|
F7 |
1 |
-1 |
|
F8 |
1 |
0 |
|
F9 |
1 |
1 |
Table 8: Translation of coded value in an actual unit
|
Coded value |
Guggul Gum (X1)) |
HPMC K 200 (X2) |
|
-1 |
30 |
15 |
|
0 |
50 |
30 |
|
1 |
70 |
45 |
Table 9: Composition of Optimization batches F1-F9
|
Ingredients (mg) |
Formulation Bach code (mg) |
||||||||
|
F1 |
F1 |
F1 |
F1 |
F1 |
F1 |
F1 |
F1 |
F9 |
|
|
Aceclofenac |
100 |
100 |
100 |
100 |
100 |
100 |
100 |
100 |
100 |
|
Guggul Gum |
30 |
30 |
30 |
50 |
50 |
50 |
70 |
70 |
70 |
|
HPMC K 200 M |
15 |
30 |
45 |
15 |
30 |
45 |
15 |
30 |
45 |
|
PVP K 30 |
20 |
20 |
20 |
20 |
20 |
20 |
20 |
20 |
20 |
|
Talc |
5 |
5 |
5 |
5 |
5 |
5 |
5 |
5 |
5 |
|
Mg.stearate |
7 |
7 |
7 |
7 |
7 |
7 |
7 |
7 |
7 |
|
Lactose. |
123 |
108 |
93 |
103 |
88 |
73 |
83 |
68 |
53 |
|
Total wt. |
300 |
300 |
300 |
300 |
300 |
300 |
300 |
300 |
300 |
EVALUATION OF PREPARED BATCHES OF ACECLOFENAC MATRIX TABLET:
Twenty tablets from the representative sample were randomly taken and individual tablet thickness was measured by using digital vernier caliper. Average thickness and standard deviation values were calculated.
. Tablet hardness was measured by using Monsanto hardness tester. From each batch six tablets were measured for the hardness and average of six values was noted along with standard deviations
From each batch, ten tablets were accurately weighed and placed in the friability test apparatus (Roche friabilator). Apparatus was operated at 25 rpm for 4 minutes and tablets were observed while rotating. The tablets were then taken after 100 rotations, dedusted and reweighed. The friability was calculated as the percentage weight loss.
% friability was calculated as follows.
% Friability = (W1 – W2) x 100/W1
Where,
W1 = Initial weight of the 20 tablets.
W2 = Final weight of the 20 tablets after testing. Friability values below 0.8% are generally acceptable.
To study weight variation individual weights (WI) of 20 tablets from each formulation were noted using electronic balance. Their average weight (WA) was calculated. Percent weight variation was calculated as follows. Average weights of the tablets along with standard deviation values were calculated.
% weight variation = (WA–WI) x 100/ WA
As the total tablet weight was 300 mg, according to IP 1996, out of twenty tablets
±5 % variation can be allowed for not more than two tablets. According to USP 2004, ± 7.5% weight variation can be allowed for not more than two tablets out of twenty tablets.
The drug content of the matrix tablets was determined according to in-house standards and it meets the requirements if the amount of the active ingredient in each of the 10 tested tablets lies within the range of 90% to 110% of the standard amount. Ten tablets were weighed and taken into a mortar and crushed into fine powder. An accurately weighed portion of the powder equivalent to about 100 mg of Aceclofenac was transferred to a 100 ml volumetric flask containing 70 ml of phosphate buffer pH 7.4. It was shaken by mechanical means for 1h. Then it was filtered through a What man filter paper (No. 1) and diluted to 100 ml with phosphate buffer pH 7.4. From this 1 ml was taken, diluted to 50 ml with phosphate buffer pH 7.4 and absorbance was measured against blank at 275nm.
The drug content of the matrix tablets was determined according to in-house standards and it meets the requirements if the amount of the active ingredient in each of the 10 tested tablets lies within the range of 90% to 110% of the standard amount. Ten tablets were weighed and taken into a mortar and crushed into fine powder. An accurately weighed portion of the powder equivalent to about 100 mg of Aceclofenac was transferred to a 100 ml volumetric flask containing 70 ml of phosphate buffer pH 7.4. It was shaken by mechanical means for 1h. Then it was filtered through a What man filter paper (No. 1) and diluted to 100 ml with phosphate buffer pH 7.4. From this 1 ml was taken, diluted to 50 ml with phosphate buffer pH 7.4 and absorbance was measured against blank at 275nm.
Details of dissolution test:
Dissolution test apparatus : USP II
Speed : 100±0.1 rpm
Stirrer : paddle type
Volume of medium : 900 ml
Time interval : 1, 2, 3, 4, 5, 6, 7 and 8 hours
Medium used : phosphate buffer pH 7.4 from 0 to 8 hours
Temperature : 37 ± 0.50C
C) Stability studies of the optimized formulation:
Stability of a pharmaceutical preparation can be defined as “the capability of a particular formulation in a specific container/closure system to remain within its physical, chemical, microbiological, therapeutic and toxicological specifications throughout its shelf life.”
The purpose of stability testing is to provide evidence on how the quality of a drug substance or drug product varies with time under influence of a variety of environmental factors such as temperature, humidity and light, and enables recommended storage conditions, re-test periods and shelf-lives to be established.
RESULT
Pre-formulation study of Aceclofenac
Characterization of Aceclofenac
a. Physical characters of Aceclofenac
Table10: Physical characters of drug
|
Sr. no |
Characters |
Inference |
|
1 |
Color & Nature |
White crystalline in nature |
|
2 |
Odor |
Odorless |
|
3 |
Taste |
Slightly bitter in taste |
The melting point of Aceclofenac was found to be in the range 149o C -153o C.
So drug used in formulation was found to be pure according to I.P. Specification.
c. Solubility determination
Table 11: Solubility Profile of Aceclofenac
|
Sr. no |
solvent |
solubility |
|
1 |
water |
insoluble |
|
2 |
phosphate buffer pH 7.4 |
soluble |
|
3 |
Alcohol and methanol |
soluble |
The solubility of pure drug in 10mg/ml of solvent was carried out and it reveals that it is soluble in phosphate buffer Ph 7.4
d. FTIR Spectra of Aceclofenac
The IR spectra of pure drug was found to be similar to the reference standard IR spectrum of Aceclofenac given in British pharmacopoeia graph given in figure 7 and peak are tabulated.

Figure: 7 FTIR spectrum of Aceclofenac (Pure drug)
Table-12: interpretation of IR spectra of Aceclofenac
|
Functional group |
Charecteristics Peaks cm-1 |
|
N-H Streching |
3319.50 |
|
C-H Streching |
2937.59 |
|
O-H Streching |
3282.84 |
|
Aromatic Out Plane Bending C-H |
750.31 |
|
C=O Streching |
1714.72 |
e. DSC analysis of Aceclofenac (Pure drug)

Drug excipients compatibility study:
Compatibility study of Aceclofenac with polymer and excipients was carried out. All that characteristic study of Aceclofenac were present in spectra which are indicating that compatibility between drug and excipients no change in the peaks Aceclofenac in mixture of polymer .so there is no interaction between pure drug and polymer .it means that all the polymers are compatible with drug.

Figure 9: FTIR spectrum of Aceclofenac (Pure drug)
b) IR spectra of polymer

Figure 10: FTIR analysis of Guggul Gum

Figure 11: FTIR analysis of HPMC K 200 M
B) DSC Studies:

Figure 12: FTIR spectrum of blend

Figure 13: DSC analysis of Aceclofenac (Pure drug)

Figure 14: DSC analysis of blend (Aceclofenac+HPMC K 200M + Guggul Gum +Excipients in mixture)
Standard Calibration Curve of Aceclofenac:
The standard Calibration Curve of Aceclofenac was taken in pH 7.4 phosphate buffer at wavelength of 275 nm. The details of values are given in table and graph plotted in figure & the equation of the regression line was Y= MX+C
Table 13: Standard Calibration curve of Aceclofenac in phosphate buffer pH 7.4
|
Concentration (mcg/ml) |
Absorbance (mean±SD) |
|
0 |
0 |
|
2 |
0.147 |
|
4 |
0.245 |
|
6 |
0.432 |
|
8 |
0.534 |
|
10 |
0.631 |

Figure: 15 Standard Calibration curve of Aceclofenac in phosphate buffer pH 7.4
VALUATION OF TRIAL BATCHES MATRIX TABLETS:
Pre Compression Parameter of Aceclofenac powdered drug
Table 14: Pre Compression Parameter of Aceclofenac powdered drug
|
Drug |
Angle of repose (?) |
Bulk density (gm/cm3) |
Tapped density (gm/cm3) |
Carr’s index (%) |
Hausner’s ratio |
|
Aceclofenac |
36.87 |
0.375 |
0.462 |
18.83 |
1.23 |
Pre Compression Parameter of trail batches
Table 15: Pre Compression Parameter of trail batches
|
Batch No. |
Bulk Density (gm./ml) |
Tapped Density (gm./ml) |
Hausner's Ratio |
Carr's Index (%) |
Angle 0f Repose (?) |
|
T1 |
0.456±0.016 |
0.566±0.014 |
19.43±0.018 |
1.24±0.014 |
32±3 |
|
T2 |
0.489±0.016 |
0.543±0.024 |
13.62±0.018 |
1.12±0.017 |
33±3 |
7.4. Post-Compression Parameters of trail batches
Table 16: Post-Compression Parameters of trail batches
|
Formulations |
Thickness (mm) |
Hardness (kg/cm2) |
Friability (%) |
Weight Variation (mg) |
|
T1 |
4.67±0.2 |
08 |
0.64±0.03 |
303 |
|
T2 |
4.72±0.2 |
07 |
0.42±0.03 |
302 |
EVALUATION OF OPTIMIZED OF MATRIX TABLETS:
Pre compression parameter of batches for optimization
Table 17: Pre-compression parameter of factorial designed batches blend
|
Parameter Batches |
Bulk Density (gm/cm3) (mean ± SD) |
Tapped Density (gm/cm3) (mean ± SD) |
Compressibility Index (%) |
Hausner’s Ratio |
Angle of Repose(o) |
|
F1 |
0.524±0.01 |
0.576±0.02 |
9.02±0.01 |
1.09±0.01 |
34±2 |
|
F2 |
0.524±0.01 |
0.611±0.01 |
14.23±0.02 |
1.16±0.01 |
35±3 |
|
F3 |
0.439±0.02 |
0.582±0.02 |
24.57±0.01 |
1.32±0.01 |
28±2 |
|
F4 |
0.489±0.01 |
0.543±0.02 |
13.62±0.01 |
1.12±0.01 |
33±2 |
|
F5 |
0.456±0.01 |
0.566±0.01 |
19.43±0.01 |
1.24±0.01 |
32±3 |
|
F6 |
0.518±0.01 |
0.564±0.01 |
8.15±0.02 |
1.08±0.02 |
31±2 |
|
F7 |
0.528±0.01 |
0.597±0.01 |
11.55±0.02 |
1.13±0.01 |
34±2 |
|
F8 |
0.519±0.02 |
0.604±0.02 |
7.19±0.012 |
1.16±0.012 |
28±3 |
|
F9 |
0.542±0.01 |
0.584±0.02 |
14.06±0.014 |
1.07±0.022 |
27±3 |
POST-COMPRESSION PARAMETER OF MATRIX TABLE
Table 18: Post-compression parameter of factorial designed batches
|
Formulation |
Thickness (n=3) (mm)(SD) |
Hardness (kg/cm2) (n=3)(SD) |
Friability (%) (n=3) |
Weight Variation (n=20) (mg) (SD) |
Drug Content (%) |
|
F1 |
4.72±0.2 |
08 |
0.67±0.02 |
300±2.67 |
99.74 |
|
F2 |
4.68±0.3 |
07 |
0.54±0.02 |
300±3.08 |
100.65 |
|
F3 |
4.98±0.0 |
09 |
0.65±0.03 |
300±2.24 |
96.54 |
|
F4 |
4.67±0.2 |
06 |
0.47±0.05 |
300±3.16 |
97.11 |
|
F5 |
4.43±0.0 |
05 |
0.42±0.04 |
300±1.46 |
96.68 |
|
F6 |
4.62±0.3 |
06 |
0.56±0.04 |
300±2.14 |
101.765 |
|
F7 |
4.65±0.2 |
08 |
0.43±0.03 |
300±3.08 |
100.66 |
|
F8 |
4.58±0.1 |
05 |
0.64±0.03 |
300±±1.97 |
101.83 |
|
F9 |
4.62±0.3 |
08 |
0.63±0.02 |
300±1.62 |
99.24 |
IN-VITRO DRUG RELEASE STUDY OF OPTIMIZED BATCHES
Table no 19: In-Vitro Drug Release Study Of Optimizedbatches
|
Time (hrs) |
Cumulative % Drug Release |
||||||||
|
F1 |
F2 |
F3 |
F4 |
F5 |
F6 |
F7 |
F8 |
F9 |
|
|
0 |
0.0 |
0.0 |
0.0 |
0.0 |
0.0 |
0.0 |
0.0 |
0.0 |
0.0 |
|
1 |
2.95 |
3.23 |
4.28 |
4.57 |
5.27 |
4.42 |
3.86 |
4.14 |
4.35 |
|
2 |
6.18 |
6.82 |
8.99 |
9.98 |
10.68 |
10.61 |
9.28 |
8.85 |
9.77 |
|
3 |
10.54 |
12.30 |
14.83 |
16.38 |
17.57 |
17.50 |
16.17 |
15.39 |
16.31 |
|
4 |
20.03 |
22.57 |
25.52 |
27.49 |
29.17 |
29.95 |
26.64 |
25.10 |
26.43 |
|
5 |
32.20 |
35.50 |
39.09 |
42.25 |
45.63 |
46.12 |
39.09 |
37.82 |
40.35 |
|
6 |
49.50 |
53.78 |
58.57 |
60.75 |
63.49 |
64.12 |
53.08 |
54.46 |
54.63 |
|
7 |
70.31 |
74.95 |
79.73 |
81.00 |
82.26 |
83.60 |
73.19 |
67.64 |
71.50 |
|
8 |
91.89 |
100.0 |
100.89 |
101.8 |
101.7 |
103.92 |
101.8 |
95.62 |
99.42 |

Figure 16: % Drug release of Optimized batches F1-F9
The dissolution rate was studied using 900ml phosphate buffer pH 7.4 for 30 min. under sink conditions using USP dissolution apparatus. The theoretical drug release profile calculation is important to evaluate the formulation with respect to release rate. The results revealed that release profile of matrix tablet of Aceclofenac shows drug release as given in the table. Batch F1 to F9 showed drug release as 91.890, 100.050, 100.890, 101.880, 101.74, 103.920, 101.88, 95.620 and 99.420 respectively. The drug release of all formulations was companied and evaluated. The results show that the formulations F3 gives more drug release was considered as optimized formulations
7.6.5 Stability study
Stability study is carried out on formulation batch (F3) according to ICH guidelines. The tablet did not show any physical changes during the study period and the drug content was found to be 98.43 % for Aceclofenac at the end of 1 month on stability condition which has shown in table 20.
Table 20: Stability study of Optimized batch (F3 )
|
Temperature |
Time in months |
Hardness (kg/cm2) |
Friability (%) |
Drug content (%) |
% Drug Release |
|
40?C± 2?C 75% RH |
0 |
8 |
0.65±0.03 |
96.54 |
99.21 |
|
40?C± 2?C 75% RH |
1 |
7 |
0.47±0.05 |
97.11 |
98.43 |

Figure 17: Dissolution profile of optimized batch F3 after 0 Month stability

Figure 18: Dissolution profile of optimized batch F3 after 1 Month stability
DISCUSSION
Preformulation Study Identification of Drug
FTIR & DSC study of Aceclofenac
The IR spectrum of pure drug was found to be similar to the reference standard IR Spectrum of Aceclofenac given in Indian pharmacopoeia. The IR Spectrum of Aceclofenac shown in Figure 7
The DSC thermo gram of Aceclofenac Fig.8 exhibited a single sharp endothermic peak at 151.97 0C and, related to its melting point.
Melting point of Aceclofenac was found to be in the range of149o C -153o C with de composition as reported in pharmacopoeia, thus indicating purity of the drug sample.
Determination of Spectral maxima by UV
The UV spectra were scanned from 200 to 400 nm at medium scanning speed, with the solution in 1 cm quartz cell. Solution concentration of 10?g/ml was used, and data were obtained. In phosphate buffer pH 7.4 solutions Aceclofenac 275 nm spectral maxima was observed by using UV.
Drug - Excipient Compatibility Studies
FTIR Study
Compatibility studies of pure drug Aceclofenac with polymers were carried out prior to the preparation of tablets. IR spectra of pure drug Aceclofenac and that of with polymers were obtained, which are shown in figure 7,9,10 and figure 11, 12. All the characteristic peaks of Aceclofenac were present in spectra thus indicating compatibility between drug & excipients. It shows that there was no significant change in the chemical integrity of the drug.
DSC Study
The DSC thermo gram of Aceclofenac and combination with polymers are shown in Fig.14 exhibited a single sharp endothermic peak at 151.970C.
The drug, drug-excipients physical mixture studies reveal that there were no significant change in position of peak in thermo gram of drug, drug-excipients was recorded. From figure 14 of drug excipients compatibility study, it was concluded that the given drug was compatible with all the excipients and it was confirmed by DSC study.
Standard Calibration Curve of Aceclofenac
Table 13 shows the absorbance reading of Aceclofenac standard solution containing 2-12 ?g/ml of drug phosphate buffer pH 7.4 solutions at the maximum wavelength of 275 nm. Figure 15 shows the linear standard calibration curve for Aceclofenac with slope 0.128, intercept 0.118 and regression co-efficient 0.991. The calculations of drug contents and in-vitro drug release study are based on this standard curve.
Flow Property determination
Flow property of pure drug was determined. Data obtain from this study of drug is Bulk density (0.375gm/cm3), Tapped density (0.462gm/cm3), Hausner’s ratio (1.23%), Carr’s index (18.83%) & Angle of repose (36.87o).
Evaluation of Trial Batches
Pre Compression Parameter
Blend of all trail batches tablet formulation were subjected for various evaluation such as Angle of repose, Bulk & Tapped density, Compressibility, Hausner’s ratio, Car’s index.
Result of all pre compression parameter performed on blend of various all batches of Tablet is shown in Table 14 The powder blend of various formulations shows good flow property. Results of trail batches revealed that the powder blend can be directly compressed into tablets.
Post-Compression Parameters
All trail batches tablet formulation was subjected for evaluation according to various official specifications and other parameters. Shape, thickness, hardness, friability, weight variation, of tablet is shown in Table 15
Shape and Appearance
Tablets prepared were randomly picked from each batch examined under lens for shape and in presence of light for color. Result shows that Tablets showed standard concave surfaces with circular shape. Tablets were white in color.
Uniformity of Thickness
Thickness of the tablets was measured using venire calipers by picking three tablets randomly from all the batches. The thickness of all the trail batches tablets was found within the range of mm.
The results of thickness for tablets are shown in Table 16
Weight Variation Test
All the tablets passed the weight variation test, i.e., average percentage weight variation was found within the pharmacopoeia limits of ±10%. The results of weight variation for tablets are shown in Table 16
Hardness Test
Hardness of the tablets found within the range of 8.0±0.25 5Kg/cm2 to7.0±0.15 for batch T1 and T2. The result of hardness tabulated in Table 16
Friability Test
The obtained results were found to be well within the approved range (<1>
Evaluation of Optimized of Full Factorial Batches
Pre Compression Parameter of Optimized Batches
Blend of all formulation F1 to F9 were subjected for various evaluation such as Angle of repose, Bulk & Tapped density, Hausner’s ratio, Car’s index. Result of all pre compression parameter was found to be in limit. The result is shown in Table 17 The powder blend of various formulations shows good flow property. Results of trail batches revealed that the powder blend can be directly compressed into tablets.
Post Compression Parameters of Optimized Batches
All the formulations were subjected for evaluation according to various official specifications and other parameters. Shape, thickness, hardness, friability, weight variations, drug content and in vitro drug release study. Result of all the post compression parameters is found in range specified in the official books. The result is shown in Table 18
Shape and Appearance
All Formulations were prepared well and select randomly and picked from each batch examined under lens for shape and in presence of light for color. Tablets showed standard concave surfaces with circular shape. Tablets were white in color.
Uniformity of Thickness
Thickness of the tablets was measured using vernire calipers by picking three tablets randomly from all the batches. The thickness of all the factorial designed batches tablets was found within the range of mm.
The results of thickness for tablets are shown in Table 18
Weight Variation Test
The weight variation of the all formulations is shown in Table 18 All the tablets passed the weight variation test, i.e., average percentage weight variation was found within the pharmacopoeia limits of ±10%.
Hardness Test
Hardness of the tablets found within the range of 5.0 ± 0.11Kg/cm2 to 8.0± 0.1for batch F1 to F9. The result of hardness tabulated in Table 18
Friability Test
Friability values of Tablet for optimized batch F1, F2, F3, F4, F5, F6, F7, F8, F9 were found 0.67±0.02,0.54±0.02 %, 0.65±0.03%, 0.47±0.05%, 0.42±0.04%, 0.56±0.03%,
0.43 ±0.03%, 0.46±0.03% and 0.63±0.02% respectively. The obtained results were found to be well within the approved range (<1>
Drug Content
The drug content uniformity was examined as per I.P specification. All the batches of tablets were found to comply with uniformity of content test and results are mentioned in Table 18.
In Vitro Drug Release of Full Factorial Batches
The In-vitro drug release studies of factorial batches were carried out using USP Type II dissolution assembly. The percentage of Aceclofenac released as a function of time for all the formulations are shown in Figure No.16 On the basis of the preliminary trials in the present investigation a full factorial design was applied to study the effect of independent variables, i.e. concentration of HPMC K 200 M & Guggul gum on dependent variable like % drug release. The results are shown in figure 16 & Table.19. Formulation batch F3 showed maximum drug release of 100.89 in 8 hr. Hence F3 is the optimized batch and used for stability study.
Stability Study
The purpose of stability testing is to provide evidence on how the quality of a drug substance or drug product varies with time under influence of a variety of environmental factors such as temperature, humidity and light, and enables recommended storage conditions, re-test periods and shelf-lives to be established. Outcome of this study is shown in Table 20 & in figure17, 18. Finally stability study concludes that there are no significant changes found in all parameters studied like Hardness, friability, Drug content & % Drug release after stability study.
SUMMARY AND CONCLUSION
Aim of project is formulation optimization and evaluation of Matrix tablet of Aceclofenac. Aceclofenac matrix tablets could be formulated using the Drug, Guggul gum and HPMC K 200, with their proportions. It can be seen that by increasing the concentration of Guggul gum and decreased concentration of HPMC K 200M in the formulation, the drug release rate from the tablets was found to be Increased. In formulation F3, using this ratio of drug and polymer, gives optimum release. i.e. Drug: Guggul Gum,HPMC,K200,PVPK30,Talc,Mg..Stearate.lactose(1:0.3:0.15:0.2:0.5:0.7, 1.23). F3 Showed satisfactory results. But when the concentration of HPMC K200 increased and Guggul gum decreased the drug release rate was found to be decreased. From the formulations F1, F2, F3, F4, F5, F6, F7, F8 and F9 the formulation F3 was selected as optimized formulation because it showed maximum release i.e.100.89% drug release in 8 h.. And the compatibility of Aceclofenac with polymers HPMC K100M and Guggul gum the studies of IR shows that all above characteristic peaks of Aceclofenac observed near about their respective values so it has been concluded that there is no incompatibility between polymers and pure drug. The preliminary examination of Aceclofenac like melting point obtained in ranges from 149°C to153°C by capillary tube method and their calibration curve was taken in phosphate buffer pH 7.4 at 275 nm by U.V Spectrophotometer. The pre-formulation or physical study of tablets like hardness, friability, thickness, weight variation, surface pH, drug content uniformity, invitro residence time, etc. have been performed. The hardness of all trail and factorial designed batches was performed by using Monsanto hardness tester and it was found in range of 5.0 to6.0 kg/cm2 and 7.0 to 8.0 kg/cm2 respectively. The hardness result shows that as increasing in polymer concentration will increase the hardness of tablets. The hardness of synthetic polymers batches is more than natural polymers because synthetic polymers have good binding characteristic than natural polymers. The friability of tablets affect with the hardness, as a results shows that increased hardness of tablets gives minimum friable of tablets and minimizes chances of infringement. The percentage friability was good in the range of 0.4 to 0.7% and the normal range of friability is below 1 %. The obtained result revealed that the tablets were having good mechanical strength and compactness. The thickness are ranged in 4.42 to 4.72 mm the thickness of natural polymers batches are good as compare to synthetic polymers because natural polymers have good compressible property to gives the desire thickness of the tablets, lowers the thickness are more comfortable to mouth cavity. The weight variation of all trial and factorial designed formulation batches were found in between 300±1.46 to 300±2.67 respectively. The obtained results indicate that all the tablets of different formulations were within the IP specifications. To evaluate the tablet’s potential for efficacy the amount of drug in the tablet need to be monitored from tablet to tablet and batch to batch. The average of drug content was found in between range of 97.11 to 101.65%. The in-vitro drug dissolution of all trial and factorial designed formulations was studied in phosphate buffer pH 7.4 The percentage drug release was found to be in the range of 91.89 to 95.62% and 99.42 to 100.89% respectively. The stability study was performed according to ICH guidelines. The tablet show very minute or little changes on physical appearance, like Hardness. The percentage drug release of tablets kept in two different stability conditions were found to be 99.21% and 98.43% respectively after the end of 1 month. All the results are found within Pharmacopoeial limit. It passes all tests.
REFERENCES


Utkarsh Mandage*, Ketaki Gangavane, Priyanka Dhande, Kiran Mapari, Pooja Gaikwad, Punam Badoge, Pallavi Borse, Research On the Formulation and Rigorous Evaluation of Aceclofenac-Loaded Matrix-Based Drug Delivery System Utilizing Naturally Derived Gum from The Satpuda Region, Int. J. of Pharm. Sci., 2024, Vol 2, Issue 12, 285-335. https://doi.org/10.5281/zenodo.14267328
 10.5281/zenodo.14267328
