Abstract
The purpose of present study is development and evaluation of sustained release tablets of Aceclofenac, which is anti-inflammatory, analgesic in nature and used in symptomatic treatment of rheumatoid arthritis and osteoarthritis. Aceclofenac is selected as an ideal candidate for sustained release drug delivery system because it has short biological half-life (3- 4 hours) and dosing frequency of more than one per day. SR tablets of Aceclofenac reduce its frequency of administration and improved patient compliance. First the pre-formulation studies of drug were conducted and partition coefficient, absorption maxima and standard curve, Angle of Repose, Bulk Density, Tapped Density, Carr’s Index and Hausner Ratio were calculated. The compatibility testing between drug and excipients of matrix tablets was carried out using Fourier Transform Infrared Spectroscopy. Matrix tablets were prepared by direct mixing of Aceclofenac and excipients like HPMC K 4M, HPMC E15 and Guar Gum as release retarding polymers in varying concentration of 40mg, 60mg and 80mg..Later the punched tablets were subjected to various evaluation tests. Further, obtained dissolution results were subjected to kinetic study i.e Zero order, First order, Higuchi plot and Korsemeyer- Peppas plot. Among all formulations, formulation F4 was selected as the best formulation as it was best fitted in Higuchi Model with highest regression coefficient, Korsemeyer-Peppas Model with highest regression coefficient and diffusion exponent.
Keywords
Sustained Release, polymers, Higuchi plot, dosing frequency, matrix tablets
Introduction
1. ORAL DRUG DELIVERY SYSTEM
Among the various routes of drug delivery, oral route is the most preferred route1 which is widely used for the systemic delivery of drugs of different dosage form. Traditional drug delivery system (DDS) has been characterized by immediate release and repeated dosing of the drug, which might lead to the risk of dose fluctuation2. So, Sustained Release (SR) dosage forms are designed to release a drug at a predetermined rate by maintaining a constant drug level for a specific period of time with minimum side effects3. SR dosage form is also able to target the drug to specific organ4 by using carriers or chemical derivatives to deliver drug to a particular target cell type5.
1.1 LIMITATIONS OF CONVENTIONAL ORAL DOSAGE FORM1
1. A drug with short biological half-life requires successive administration increasing the chances of missing the dosage form leading to poor patient compliance,
2. The drug level may fluctuate in see-saw way, leading to either below effective range or over the effective range,
3. Multiple drug therapy increasing the risk of toxicity as well as overall cost of treatment,
4. The drug levels may raise and fall, which can cause accumulation of adverse effects especially for drugs having less therapeutic index.
2. SUSTAINED RELEASE DRUG DELIVERY SYSTEM (SRDDS)
SR dosage forms are designed to achieve a prolonged therapeutic effect by continuously releasing medication over an extended period of time after administration of single dose. The main aim of SR formulations is to modify and improve the drug performance by increasing the duration of drug action, decreasing the frequency of dosing, decreasing the required dose employed and providing uniform drug delivery6. Sustained release formulation maintains a uniform blood level of drug with better patient compliance as well as increased efficacy of drug.
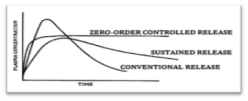
Figure 1: Plasma drug concentration profile for conventional release, a sustained release and zero order controlled release formulation2
2.1 RATIONAL FOR DEVELOPING OF SRDDS7
- To extend the duration of action of the drug,
- To sustain the release of drug which provides availability of a drug at action site throughout the treatment in order to improve clinical efficiency of a drug molecule,
- To minimize dosing frequency,
- To reduce cost of treatment by reducing number of dosage requirement
- To minimize toxicity due to overdose which is often in conventional dosage form,
- To enhance the activity duration of a drug possessing short half-life.
2.2 PRINCIPLE OF SRDDS8
The conventional dosage forms release their active ingredients into an absorption pool immediately. The absorption pool represents a solution of the drug at the site of absorption. Kr, Ka and Ke are first order rate-constant for drug release, absorption and overall elimination respectively. Immediate drug release from a conventional dosage form implies that Kr >>>> Ka. For non-immediate release dosage forms, Kr <<< K>a i.e. the release of drug from the dosage form is the rate limiting step.
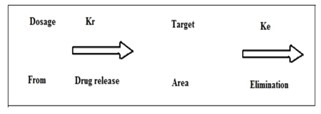
Figure 2: Release of drug from conventional dosage form8
The main aim of designing SRDDS is to deliver the drug at a rate necessary to achieve and maintain a constant drug blood level. This implies that rate of delivery should be independent of amount of drug remaining in the dosage form and constant over time, which indicates drug release from the dosage form follows the zero order kinetics, expressed by the equation :-
Kr ° = Rate In = Rate Out = Ke Cd Vd
Where,
Kr°: Zero-order rate constant for drug release-Amount/time,
Ke: First-order rate constant for overall drug elimination-time,
Cd: Desired drug level in the body – Amount/volume,
Vd: Volume space in which the drug is distributed in liter
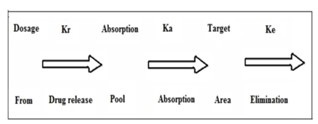
Figure 3: Release of drug from non-immediate release formulation8
2.3 Classification Of Modified-Release Dosage Forms
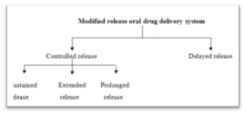
Figure 4: Classification of modified-release dosage forms4
1. Extended release dosage forms. (eg. sustained release dosage forms, controlled release dosage forms)
2. Delayed release dosage forms (eg. enteric coated tablets)
3. Targeted release dosage form
2.3.1 Modified Release Dosage Forms
As per USP, it is a dosage form which has drug release characteristics based on time, course or location. Also this dosage form is sufficiently controlled to provide periods of prolonged therapeutic action following each administration of a single dose.
2.3.2 Extended Release Dosage Form9
It is a dosage forms which releases the drug slowly so that plasma concentration is maintained at a therapeutic level for a period of time.
2.3.3 Delayed Release Dosage Form10
It is a dosage form which indicates that the drug is not being released immediately following administration but at a later time, eg. Enteric coated tablets.
2.3.4 Prolonged Release Dosage Form10
It is a dosage form which is designed to deliver a dose of a medication over an extended period.
2.3.5 Sustained Release Dosage Form
It is a dosage form which releases an initial amount of drug which is sufficient to provide a therapeutic effect and then a gradual release of drug over an extended period of time.
3. ADVANTAGES OF SUSTAINED RELEASE DRUG DELIVERY SYSTEM11
1. Helps in reduction of frequency of drug administration.
2. Reduces fluctuation in circulating drug levels due to multiple dosing.
3. Produces more uniform effect by reducing blood level variations due to multiple dosing.
4. Shows better drug absorption as the high blood level peaks observed after administration of high dose of drug are reduced.
5. Reduction in GI irritation and other side effects.
6. Reduces the total amount of drug administration, thus
- Maximizes the availability of drug at minimum dose,
- Eliminates the local side effects,
- Reduces systemic side effects,
- Reduces drug accumulation.
7. Increased and improved patient convenience and compliance.
8. Economical for patients as it reduces health care cost.
4. Disadvantages Of Sustained Release Dosage Forms
1. Decreased systemic availability which may be due to
- Incomplete release of drug,
- Increased first-pass metabolism, increased instability
- pH dependant solubility,
2. Poor in vitro-in vivo correlation,
3. Increased chances of dose dumping,
4. Retrieval of drug is difficult if toxicity, poisoning, or hypersensitivity reactions occurs,
5. Higher cost of formulation.
5. Characteristics Of Drug Suitable For Sr12
5.1 Biopharmaceutic Properties Of A Drug
The performance of a drug presented as controlled release systems depends upon its:
- Release from formulation
- Movement within body during its passage to the site of action
The former depends upon the fabrication of the formulation and physicochemical properties of
drug while the latter element is dependent upon pharmacokinetics of drug. The rate determining
step in the availability of a drug from controlled delivery system is the rate of release of drug
from the dosage form.

Figure 5: Scheme representing the rate limiting step in design of controlled release drug delivery system13
A) Molecular Weight Of The Drug
Lower is the molecular weight of the drug, faster and more complete is the absorption. Molecular size threshold is 150 Daltons for spherical compounds and 400 Daltons for linear compounds. However, more than 95% of drugs are absorbed by passive diffusion. Drugs with large molecular size are poor candidates for oral controlled release system.
B) Aqueous Solubility Of The Drug
A drug with pH independent good aqueous solubility is considered good candidate for controlled release dosage form. The lower limit of solubility of a drug to be formulated as controlled release drug delivery system is 0.1 mg/ml. Drugs with pH dependent aqueous solubility or drugs with solubility in non-aqueous solvents are considered suitable for parenteral controlled release dosage form.
C) Apparent Partition Coefficient Of The Drug
Greater the apparent partition coefficient of the drug, greater is its lipophilicity and thus, greater is its rate and extent of absorption.
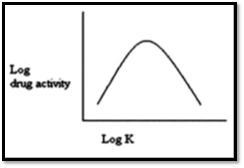
Figure 6: A relationship between drug action and partition coefficient14
D) Drug pKa And Ionization At Physiological pH
Drugs which exist largely in an ionized form are poor candidates because ionized form of drug is absorbed 3-4 times less than that of the unionized drug. The unionized form of drug is absorbed well.
E) Drug Permeability
The three major drug characteristics which determine permeability of drugs for passive transport across intestinal epithelium are:
- Lipophilicity,
- Polarity of drug measured by number of H-bond acceptors and number of H-bond donors on the drug molecule,
- Molecular size.
F) Drug Stability
Drugs which are unstable in GI environment are not administered as oral controlled release formulations due to bioavailability problems. So, different route of administration should be selected. On the other hand, drug unstable in intestine can be formulated as gastro-retentive dosage form.
G) Mechanism And Site Of Absorption
Drugs which are absorbed by carrier-mediated transport processes and those absorbed through a window are poor candidate for controlled release systems.
H) Biopharmaceutic Aspects Of Route Of Administration
Oral and parenteral (i.m) routes are the most popular followed by transdermal route. Routes of minor importance in controlled drug delivery are buccal/sublingual, rectal, nasal, ocular, pulmonary, vaginal and intrauterinal.
5.2 Pharmacokinetic Characteristics Of A Drug In Design Of Controlled Release Drug Delivery System
ADME i.e Absorption, Distribution, Metabolism and excretion characteristics of drug are essential in design of controlled release product. An optimum range of a given pharmacokinetic parameter of a drug is necessary beyond which controlled delivery is difficult or impossible.
- Absorption Rate
A drug with slow absorption is a poor candidate as continuous release will result in a pool of unabsorbed drug. Aqueous soluble but poorly absorbed potent drugs are also poor candidates. Drug to be administered as controlled release formulation, its absorption must be efficient as the rate-limiting step is rate of drug release.
b) Elimination Half-Life
An ideal controlled release drug delivery system is the one where rate of absorption is equal to the rate of elimination. Smaller is the t1/2, larger the amount of drug is required to be incorporated in the controlled release dosage form. Drugs with half-life in the range of 2 to 4 hours are the good candidates for such system.
c) Rate Of Metabolism
Drugs which are extensively metabolized are considered suitable for controlled release system as long as the rate of metabolism is not too rapid. Drugs which are capable of inducing or inhibiting metabolism are considered poor candidate.
d) Dosage Form Index (Di)
It is defined as the ratio of Css,max to Css,min. Since the goal of controlled release formulation is to improve therapy by reducing the dosage form index while maintaining the plasma drug levels within therapeutic window, ideally, its value should be as close to one as possible.
e) Absorption Window
The drugs which show absorption from the specific segment in GIT are a poor candidate for CRDDS. Drugs which absorbed throughout the GIT are good candidates for controlled release.

Figure.7: Absorption window15
5.3 Pharmacodynamic Characteristics Of A Drug In Design Of Controlled Release Drug Delivery System13
a) Drug Dose
In general, dose strength of 1.0 g is considered maximum for a controlled release drug delivery system.
b) Therapeutic Range
A candidate drug for controlled release drug delivery system have a therapeutic range wide enough such that variations in the release rate do not result in a concentration beyond this level.
c) Therapeutic Index (Ti)
The release rate of a drug with narrow therapeutic index should be such that the plasma concentration attained is within the therapeutically safe and effective range.
Therapeutic index = TD50 ? ED50
Where,
TD50 - Median toxic dose
ED50 - Median effective dose
d) Plasma Concentration Response (PK/PD) Relationship
Drugs whose pharmacological activity is independent of its concentration are poor candidates for controlled release systems.
Table1: Factors in the design of CRDDS
|
Sr. No.
|
Properties of Candidate drug
|
Desired Features
|
|
A
|
BIOPHARMACEUTIC PROPERTIES
|
|
1
|
Molecular size
|
Less than 600 Daltons
|
|
2
|
Aqueous solubility
|
More than 0.1 mg / ml
|
|
3
|
Partition Coefficient
|
1-2
|
|
4
|
Dissociation constant
|
Acidic drugs pKa > 2.5
Basic drugs pKa , 11.0
|
|
5
|
Ionisation at physiological pH
|
Not more than 95%
|
|
6
|
Stability at GI milieu
|
Stable at both gastric and intestinal Ph
|
|
7
|
Absorption mechanism
|
Passive
|
|
B
|
PHARMACOKINETIC PROPERTIES
|
|
1
|
Absorption rate constant Ka
|
High
|
|
2
|
Elimination half-life t1/2
|
2-4 hours
|
|
3
|
Metabolism rate
|
Not too high
|
|
4
|
Dosage form Index
|
One
|
|
C
|
PHARMACODYNAMIC PROPERTIES
|
|
1
|
Dose
|
Maximum 1.0 g (in CR formulation)
|
|
2
|
Therapeutic range
|
Wide
|
|
3
|
Therapeutic index
|
Wide
|
|
4
|
PK/PD relationship
|
Good
|
6. Drug Release From Polymers17
6.1 Drug Release From Hydrophilic Matrix
Hydrophilic matrix systems are polymer based drug delivery systems where two competing drug release mechanism are involved: Fickian diffusion release and relaxational release. The primary rate controlling materials are polymers on hydration swell rapidly in an aqueous medium and forming a gel layer on the surface. Diffusion across the gel layer is not the only drug release pathway, as erosion of the matrix following polymer relaxation also contributes to release of drug.
6.2. Drug Release From Hydrophobic Matrix
In this system, the drug is dispersed throughout a matrix. For a homogenous monolithic matrix system, the release behavior can be described by the Higuchi equation.
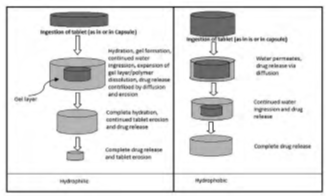
Figure 8: Release of drug from hydrophilic and hydrophobic matrix
7. Kinetics of drug release17
7.1 Zero Order Kinetics
Drug dissolution from pharmaceutical dosage form that does not disaggregate and drug release in slow manner represented by,
W0-Wt =Ko t
Where,
W0 =Initial amount of drug concentration in solution.
Wt = Amount of drug release dissolved in time t.
K0 t= Zero order rate constant.
When the graph is plotted as cumulative % drug release verses time, if the obtained plot is linear then data obeys zero order kinetics with slope equal to K0. This model represents an ideal release profile in order to achieve the prolonged pharmacological action.
7.2 First Order Kinetics
Release of drug expressing in this model:
Log Qt = (Log Qo+ K1t)/2.303
Qt=Amount of drug release in time t.
Q0=Initial amount of drug in solution.
K1t =First order release rate constant.
When data was plotted as log cumulative % drug remaining verses time yields a straight line indicating that the release follows first order kinetics. The constant K can be obtained multiplying slope values.
7.3 Korsmeyer Peppas Model
In 1983 Korsmeyer-peppas developed a simple, semi-empiric model, when diffusion is the main drug release mechanism, relating exponentially the drug release to the elapsed time (t).
At/A= ktn
Where,
k = Constant.
n =Release.
t = Time.
At and A?= Absolute cumulative amount of drug released at time (t)
7.4 Higuchi Model
Drug release from the matrix device by diffusion has been described by Higuchi’s
Diffusion equation:
ft = Q = ?D?/? (2C- ?Cs)Cst
Where,
Q = Amount of drug released in time t.
D = Diffusion coefficient of the drug in the matrix.
Cs = Solubility of the drug in the matrix.
?= Porosity of matrix.
?= Tortuosity.
t = Time (h).
The equation may be simplified then equation becomes;
ft = Q = KHXt1/2
Where,
KH = Higuchi dissolution constant.
t = Time (h).
When data was plotted according to this equation, i.e. cumulative drug released verses square root of time, yields a straight line, indicating that the drug was released by diffusion mechanism.
8. Mathematical Models For Controlled Release Systems
Drug release mechanism and kinetics are the two important characteristics of a delivery system for describing the dissolution profile. Various mathematical models have been developed to analyze drug release from different types of controlled release drug delivery system.
The Korsmeyer- Peppas Power law equation predicts that the fractional release of drug is exponentially related to the release time and this adequately describes the release of drug from slabs, cylinders or spheres.
Table 2: Mathematical Models used to describe drug release kinetics from various matrices
|
Kinetic Model
|
Mathematical Relation
|
Systems that follow the model
|
|
First order
|
ln Qt = Q0 + Kt (release proportional to amount of drug remaining)
|
Water soluble drugs in porous matrix
|
|
Zero order
|
ft = K0t (release independent of drug concentration)
|
Osmotic systems, Transdermal systems
|
|
Higuchi’s square root of time equation
|
ft=KH t1/2 (release proportional to square root of time)
|
Diffusion Matrix formulations
|
|
Weibull
|
m = 1-e(-(t- Ti)b/a)
|
Erodible matrix formulations
|
|
Hixson Crowell’s cube root equation
|
W01/3- Wt1/3 = Ks t
|
Erodible matrix formulations
|
|
Korsmeyer Peppas Power law Equation
|
Mt/M? = K tn
|
Swellable polymeric devices
|
|
Peppas Sahlin
|
Mt/M? = K tm + K t2m
|
Swellable polymeric devices
|
|
Baker Lonsdale
|
3/2 (1- (1- Mt/M?)2/3)-Mt/M? = Kt
|
Microcapsules or Microspheres
|
Where,
a = scale parameter,
b = surface parameter,
ft = fraction of dose released at time t
K, KH, K0, Ks = release rate constants characteristics to respective models,
m and n = release exponents,
Mt = amount released at time t,
M? = amount released at infinite time,
Qo = drug amounts remaining to be released at zero hour,
Qt = drug amounts remaining to be released at time t,
Ti = lag time before the onset of dissolution,
Wo = initial amount of drug present in the matrix,
Wt = amount of drug released at time t.
A plot of the log (drug released) vs log (time) yields slope n (diffusion exponent) having value-
- n = 0.5 indicating pure Fickian diffusion
- n = 0.5 -1 or n = 0.45-0.89 indicating anomalous non-fickian diffusion i.e the rates of solvent penetration and drug release are in the same range. This deviation is due to increased drug diffusivity from the matrix by solvent-induced relaxation of the polymers.
- n = 0.89 or n = 1 indicates zero-order release which can be achieved when drug diffusion is rapid compared to the constant rate of solvent-induced relaxation and swelling in the polymer.
Table 3: Diffusional Exponent n and mechanism of diffusional release from swellable controlled release systems of different geometrics13
|
Slab
|
Cylinder
|
Sphere
|
Drug release mechanism
|
|
0.5
|
0.45
|
0.43
|
Fickian diffusion
|
|
> 0.5 - < 1>
|
> 0.45 - < 0>
|
> 0.43 - < 0>
|
Non-fickian
|
|
1.0
|
0.89
|
0.85
|
Zero-order release
|
|
> 1.0
|
> 0.89
|
> 0.85
|
Case- II transport
|
|
> > 1.0
|
> 1.0
|
> 1.0
|
Super- case II transport
|
II. Material And Methodlogy
9. Preformulation studies
Pre-formulation studies were carried as per standard procedure mentioned in Indian Pharmacopoeia, 2010.
9.1 Characterization Of Aceclofenac
9.1.1. Organoleptic Properties
The colour, odour and taste of the drug were recorded using descriptive terminology18.
9.1.2 Loss On Drying (Lod)
Loss on drying is the loss of weight expressed as percentage w/w resulting from water and volatile matter of any kind that can be driven off under specified condition. The test can be carried out on the well mixed sample of the substance18.
Initial weight of substance – Final weight of substance
LOD = --------------------------------------------------------------------------- x 100
Initial weight of substance
9.1.3 Solubility Study
The solubility of drug was recorded by using various descriptive terminology specified in Indian Pharmacopoeia, 200718.
9.1.4 Melting Point
Melting point of drug sample was determined by using melting point apparatus. A few quantity of drug sample was taken and placed in a thin walled capillary tube; the tube was approximately 10-12 cm in length with 1mm in diameter and closed at one end. The capillary which contain sample was placed in melting point apparatus and heated and when drug sample was melted the melting point of sample powder was noted. 18
9.1.5 Partition Coefficient
10 mg drug was added in 50 ml of n-Octanol (pre saturated with water) and it was shaken and then 50 ml of distilled water (pre saturated with n- Octanol) was added and was shaken the mixture by mechanical shaker for 24 hours. After 24 hour both phases are separated. Absorbance was taken of both the phases and calculated the concentration in each phases18.
Po/w = C oil / C water
9.2 Physical Evaluation Of Powder
The powder was evaluated for angle of repose, bulk density, tapped density, compressibility index and Hausner ratio.
9.2.1 Bulk Density:
An accurately weighed quantity of the powder (W) was carefully poured into the graduated cylinder and the volume (Vo) was measured then the graduated cylinder was closed with lid, set into the bulk density determination apparatus. The density apparatus was set for 500 taps and after that, the volume (Vf) was measured and continued operation till the two consecutive readings were equal. The bulk density and tapped density were calculated using the following formula:
Bulk density = W/Vo
Tapped density = W/Vf
Where,
Vo = Initial Volume
Vf = Final Volume
9.2.2 Compressibility Index:
The compressibility index may be calculated using measured values for bulk density (? bulk) and tapped density (? tapped ) as follows :
Compressibility index = (? tapped - ? bulk )x 100 / ? tapped
Table 4: Compressibility index limits
|
Flow ability
|
% Compressibility
|
|
Excellent
|
< 10>
|
|
Good
|
11-15
|
|
Fair
|
16-20
|
|
Passable
|
21-25
|
|
Poor
|
26-31
|
|
Very Poor
|
32-37
|
|
Very very Poor
|
>38
|
9.2.3 HAUSNER’S RATIO:
It is the ratio of volume of tapped volume is tapped density to bulk density.
Hausner’s ratio = ? tapped / ? bulk
Table 5: Hausner’s Ratio index limits
|
Flowability
|
Hausner’s Ratio
|
|
Excellent
|
1.00-1.11
|
|
Good
|
1.12-1.18
|
|
Fair
|
1.19-1.25
|
|
Passable
|
1.26-1.34
|
|
Very Poor
|
1.35-1.45
|
|
Very very Poor
|
>1.60
|
9.2.4 Angle Of Repose
Angle of repose is defined as the maximum angle possible between the surface of a pile of the powder and the horizontal plane. The static angle of repose was measured using a funnel which was clamped with its tip 2cm above a graph paper, placed on a flat horizontal surface. The powder was carefully poured through the funnel until the apex of the cone thus formed just reached the tip of the funnel. The mean diameters of the base of the powder cones were determined and the tangent of the angle of repose calculated using the equation:
Tan ? = h / r
Where,
h = height of pile
r = radius of the base of the pile
? = angle of repose
Table 6: Angle of Repose Limits
|
Angle Of Repose
|
Flowability
|
|
< 25>
|
Excellent
|
|
25-30
|
Good
|
|
30-40
|
Passable
|
|
>40
|
Very poor
|
9.3 Analytical Method
I. By Using Hydrochloric Acid Buffer Ph 1.2
9.3.1 Determination Of Absorption Maxima
Weighed 10 mg of Aceclofenac and dissolved in 10 ml of Hydrochloric acid buffer pH 1.2 solution (1000?g/ml). From this solution 1ml was taken and diluted to 10ml with HCl buffer pH 1.2 to get a solution containing 100?g/ml. From this 1ml was diluted to 10ml to get working standard solutions of 10?g/ml. This solution was scanned between 200-400 nm and an absorption maxima was determined and compared with literature value.
- PREPARATION OF STANDARD CURVE OF ACECLOFENAC
100 mg equivalent weighed of Aceclofenac was dissolved in 100 ml of Hydrochloric acid buffer pH 1.2. The 10 ml of above solution was further diluted upto 100 ml with Hydrochloric acid buffer pH 1.2. The resulting solution was serially diluted with Hydrochloric acid buffer pH 1.2 to get drug concentration 5, 10, 15, 20, 25 ?g/ml. The absorbance of the solutions was measured against Hydrochloric acid buffer pH 1.2 as a blank using double beam UV visible spectrophotometer. The plot of absorbance v/s concentration (?g/ml) was plotted and data was subjected to obtain linear regression analysis.
II. BY USING PHOSPHATE BUFFER Ph 6.8
9.3.2 DETERMINATION OF ABSORPTION MAXIMA IN PHOSPHATE BUFFER 6.8
Weighed 10 mg of Aceclofenac and dissolved in 10 ml of pH 6.8 phosphate buffer solution (1000?g/ml). From this solution 1ml was taken and diluted to 10ml with PBS to get a solution containing 100?g/ml. From this 1ml was diluted to 10ml to get working standard solutions of 10?g/ml. This solution was scanned between 200-400 nm and an absorption maxima was determined and compared with literature value.
- PREPARATION OF STANDARD CURVE
100 mg equivalent weighed of Aceclofenac was dissolved in 100 ml of phosphate buffer pH 6.8. The 10 ml of above solution was further diluted upto 100 ml with phosphate buffer pH 6.8. The resulting solution was serially diluted with phosphate buffer pH 6.8 to get drug concentration 5, 10, 15, 20, 25?g/ml. The absorbance of the solutions was measured against phosphate buffer pH 6.8 as a blank using double beam UV visible spectrophotometer. The plot of absorbance v/s concentration (?g/ml) was plotted and data was subjected to obtain linear regression analysis.
9.4 Compatibility Testing Of Drug With Polymer:
The proper design and formulation of a dosage form requires consideration of the physical, chemical and biological characteristics of all drug substances and excipients to be used in the fabricating the product. Each polymer used in the formulations was blended with the drug levels that are realistic with respect to the final dosage form. Each polymer was thoroughly blended with drug to increase drug - polymer molecular contacts to accelerate the reactions if possible.
9.4.1 Fourier Transform Infra-Red (FTIR) Spectroscopy:
FTIR study was carried out to check compatibility of drug with polymers. Infrared spectrum of Aceclofenac was determined on Fourier transform Infrared Spectrophotometer using KBr dispersion method. The base line correction was done using dried potassium bromide. Then the spectrum of dried mixture of drug and potassium bromide was run followed by drug with various polymers by using FTIR spectrophotometer. The absorption maximums in spectrum obtained with the substance being examined correspond in position and relative intensity to those in the reference spectrum.
9.5 Formulation Of Aceclofenac Sustained Release Matrix Tablets
Table 7: Composition of Aceclofenac matrix tablets
|
Ingredient(mg/tablet)
|
F1
|
F2
|
F3
|
F4
|
F5
|
F6
|
F7
|
F8
|
F9
|
|
Aceclofenac
|
200
|
200
|
200
|
200
|
200
|
200
|
200
|
200
|
200
|
|
HPMC E15
|
40
|
60
|
80
|
--
|
--
|
--
|
--
|
--
|
--
|
|
HPMC K 4M
|
--
|
--
|
--
|
40
|
60
|
80
|
--
|
--
|
--
|
|
Guar Gum
|
--
|
--
|
--
|
--
|
--
|
--
|
40
|
60
|
80
|
|
MicroCrystalline Cellulose(MCC)
|
65
|
45
|
25
|
65
|
45
|
25
|
65
|
45
|
25
|
|
PVP K-30
|
30
|
30
|
30
|
30
|
30
|
30
|
30
|
30
|
30
|
|
Magnesium
stearate
|
10
|
10
|
10
|
10
|
10
|
10
|
10
|
10
|
10
|
|
Talc
|
5
|
5
|
5
|
5
|
5
|
5
|
5
|
5
|
5
|
|
Total Weight
|
350mg
|
350mg
|
350mg
|
350mg
|
350mg
|
350mg
|
350mg
|
350mg
|
350mg
|
9.5.1 Preparation of Tablets by Direct Compression method19
Preparation of Sustained Release Tablets of Aceclofenac
All SR tablets were prepared by direct compression method. Accurately weighed amounts of drug, polymer and diluent were mixed geometrically in a mortar. This mixture was then passed through Sieve No.40 and thoroughly mixed in a polybag for 15 minutes. The powder blend was then lubricated with magnesium stearate and talc for 2 minutes and compressed into tablets on a rotary tableting machine. The drug polymer ratio was developed to adjust drug release and to keep total weight of tablet constant for all the fabricated batches under experimental conditions of preparations. The total weight of the matrix tablets was 350mg with different drug polymer ratios. The various polymers used were HPMC E15, Guar Gum and HPMC K4M. Diluent like MCC was used for the preparation of matrix tablets.
9.6 Evaluation Of Sustained Release Matrix Tablet Of Aceclofenac
9.6.1. Appearance
The tablets were visually observed for capping, chipping, and lamination20.
9.6.2. Thickness
The thickness of tablets is important for uniformity of tablet size. The thickness of the tablets was determined using a vernier caliper. Ten tablets from each type of formulation were used and average values were calculated20.
9.6.3. Weight Variation Test
For weight variation, 20 tablets of each type of formulation were weighed individually on an electronic balance, average weight was calculated and individual tablet weight was then compared with the average value to find out the deviation in weight21.
Table 8: Specifications of %Weight variation allowed in tablets as per IP
|
Sr. No
|
Average Weight of tablet
|
?viation
|
|
1
|
80 mg or less
|
10
|
|
2
|
More than 80 but less than 250 mg
|
7.5
|
|
3
|
250 mg or more
|
5
|
9.6.4. Hardness
For each type of formulation, the hardness value of 10 tablets was determined using Monsanto hardness tester.
9.6.5. Percentage Friability
Friability is the measure of tablet strength. This test subjects a number of tablets to the combined effect of shock abrasion by utilizing a plastic chamber which revolves at a speed of 25 rpm, dropping the tablets to a distance of 6 inches in each revolution. A sample of pre-weighed tablets was placed in Roche friabilator which was then operated for 100 revolutions. The tablets were then de-dusted and reweighed. A loss of less than 1 % in weight is generally considered acceptable. Percent friability (% F) was calculated as follows20.
%F = [(Initial Weight - Final Weight) / Initial Weight] X 100
9.6.6 Content Uniformity:
Content uniformity was determined by accurately weighing 20 tablets and crushing them in mortar with the help of a pestle. Then an accurately weighed quantity of powder equivalent to 25 mg of drug was transferred to a 50 ml volumetric flask. Then added few ml of methanol and made volume upto 50ml with methanol. The solution was filtered through whatmann filter paper. 5 ml of the filtrate was diluted to 50 ml with Methanol. Then 3 ml of the resulting solution was again diluted to 10 ml with Methanol. The absorbance of the resulting 15 µg/ml solution was recorded at 274nm21.
9.6.7. In-Vitro Dissolution Studies:
The in-vitro dissolution studies were performed using USP type I dissolution apparatus at 100rpm. Dissolution test was carried out for a total period of 12 hours using Hydrochloric acid buffer (pH 1.2) solution (900 ml) as dissolution medium at 37° ± 0.5° for first 2 hours and Phosphate buffer (pH 6.8) solution (900 ml) for the rest of the period .An aliquot (5ml) was withdrawn at specific time intervals and absorbance was determined by U.V. spectrophotometer at 274 nm. The release studies were conducted in triplicate22.
9.6.8 Kinetic Study:
To describe the Aceclofenac release kinetics from individual tablet formulations, the corresponding dissolution data were fitted in various kinetic dissolution models: Zero order, first order, Higuchi and Korsmeyer–Peppas. The release of drugs from the matrix tablets can be analyzed by release kinetic theories22,23.
To study the kinetics of drug release from matrix system, the release data was fitted into
- Zero order as cumulative amount of drug release versus time ,
- first order as log cumulative percentage of drug remaining versus time,
- Higuchi model as cumulative percent drug release versus square root of time,
- To describe the release behavior from the polymeric systems, data were fitted according to well-known exponential Korsmeyer–Peppas equation as log cumulative percent drug release versus log of time equation.
- Zero Order Kinetics
Qt=K0t
Where,
Q = Amount of drug release in time t
K0 = Zero order rate constant expressed in unit of concentration/time
t = Release time
Here, the data was plotted as cumulative percent drug release versus time; if the plot obtained is linear then the data obeys zero-order release kinetics and slope equals K.
Log Q = Log Q0-kt/2.303
Where,
Q0 = is the initial concentration of drug
k = is the first order rate constant
t = release time
Q=kt1/2
Where,
k = release rate constant
t = release time, hence the release rate is proportional to the reciprocal of the square root of time. When the data was plotted as cumulative drug released versus square root of time, yielded a straight line, indicating that the drug was released by diffusion mechanism. The slope equals K.
This equation is used to determine the release behavior from controlled release polymer matrix system. The equation is also called as power law,
Mt/M? = Kt n
Where,
Mt = amount of drug released at time t
M? = amount of drug released after infinite time
Mt/M? = fraction solute release
t = release time
K = kinetic constant incorporating structural and geometric characteristics of the polymer system
n = diffusional exponent that characterizes the mechanism of the release of traces. The magnitude of the release exponent “n” indicates the release mechanism (i.e., Fickian diffusion, non-Fickian, supercase II release). For matrix tablets, values of n of near 0.5 indicate Fickian diffusion controlled drug release, and an n value of near 1.0 indicates erosion or relaxational control (case II relaxational release transport, non-Fickian, zero order release). Values of n between 0.5 and 1 regarded as an indicator of both diffusion and erosion as overall release mechanism commonly called as anomalous release mechanism. When the data was plotted as Log of drug released versus Log time, produced a straight line with a slope equal to n and the K was obtained from Y – intercept.
III.Result And Discussion
10. Preformulation Parameters
10.1 Characterization Of Aceclofenac
10.1.1 Organoleptic Properties
As per the I.P, Aceclofenac exists as crystalline, odourless powder which is white in colour and slightly bitter in taste. Organoleptic properties of drug sample were found similar to that of standard and are given in Table 9.
Table 9: Organoleptic properties of Aceclofenac
|
Organoleptic Properties
|
Result
|
|
Colour
|
White powder
|
|
Crystallinity
|
Crystalline in nature
|
|
Taste
|
Slightly bitter in taste
|
|
Odour
|
Odourless
|
10.1.2 Loss On Drying
The percentage loss on drying for Aceclofenac was found to be 0.28%, which comply with given literature value.
10.1.3 Solubility Studies
The available literature on solubility profile of Aceclofenac indicated that the drug is freely soluble in acetone, methanol and practically insoluble in water. The results of Aceclofenac solubility in various media are given in table 5.2. Aceclofenac showed pH dependent solubility. At lower pH, the solubility was less and as the pH was raised from acidic to 6.8 and 7.4 its solubility drastically improved24
Table 10: Solubility of Aceclofenac in different solvents
|
Sr.No.
|
Solvent
|
Inference
|
|
1
|
Distilled Water
|
Insoluble
|
|
2
|
Ethanol 95%
|
Soluble
|
|
3
|
Methanol
|
Soluble
|
|
4
|
Acetone
|
Soluble
|
|
5
|
HCl buffer 1.2
|
Very slightly soluble
|
|
6
|
Phosphate buffer 6.8
|
Slightly Soluble
|
|
7
|
Phosphate buffer pH 7.4
|
Slightly soluble
|
10.1.4 Melting Point Determination
The reported melting point of Aceclofenac is 158° C. The observed melting point values of Aceclofenac sample was found to be 156.7° C +0.36 (n=3), which is nearby to reported value. From the determination of melting point, the drug was identified as Aceclofenac.
Table 11: Melting point of Aceclofenac
|
Sr.No
|
Observed Melting Point
|
Reported Melting Point
|
|
1
|
156.3° C
|
158° C
|
|
2
|
156.8° C
|
158° C
|
|
3
|
`157° C
|
158° C
|
10.1.5 Partition Coefficient
The study showed that major portion of drug was partitioned towards organic phase which indicates lipophilicity of the compound and higher absorption of the compound occurs through lipoidal cell membrane. This also signifies that drug belongs to BCS class II (low solubility and high permeability).
10.2 Physical Evaluation Of Powder
Aceclofenac raw material showing passable flowability This reveals that all the formulation blend have good flow characteristics and flow rate. Degree of compression is characteristic of compression capability of the powder and the results obtained exhibit good compression property of the powder.
Table 12: Physical Evaluation of Aceclofenac powder
|
Sr.No.
|
Parameter
|
Inference
|
|
1
|
Bulk density
|
0.90 ± 0.51 gm/ml
|
|
2
|
Tapped density
|
1.0 ± 0.18 gm/ml
|
|
3
|
Compressibility index
|
10.61 ± 0.00 %
|
|
4
|
Hausner Ratio
|
1.21 ± 0.00
|
|
5
|
Angle of Repose
|
32.7 0 ± 0.00
|
N=3, Mean ± S.D
10.3 Analytical Method
10.3.1 ?max Determination:
The absorption maxima for Aceclofenac was found to be 272.5 nm.

Figure 9: ? max observed for Aceclofenac in HCl buffer pH 1.2
The absorption maxima for Aceclofenac was found to be 274 nm.

Figure 10: ?max observed for Aceclofenac in Phosphate buffer pH 6.8
10.3.2 Preparation Of Standard Curve Of Aceclofenac
UV absorption spectrum of Aceclofenac in HCl buffer pH 1.2 shows ?max at 272.5 nm. The data for standard curve of Aceclofenac in HCl buffer pH 1.2 is shown in table 5.4. The standard plot is as shown in figure 5.3. Beer Lambert Law was obeyed over the range of 0-25 ?g /ml and data was found to fit the equation
y = 0.012x+ 0.001
r2 = 0.999
Table 13: Data of concentration and absorbance for Aceclofenac in HCl buffer pH 1.2
|
Sr.No.
|
Concentration (µg/ml)
|
Absorbance
|
|
1
|
0
|
0
|
|
2
|
5
|
0.063
|
|
3
|
10
|
0.129
|
|
4
|
15
|
0.188
|
|
5
|
20
|
0.251
|
|
6
|
25
|
0.311
|
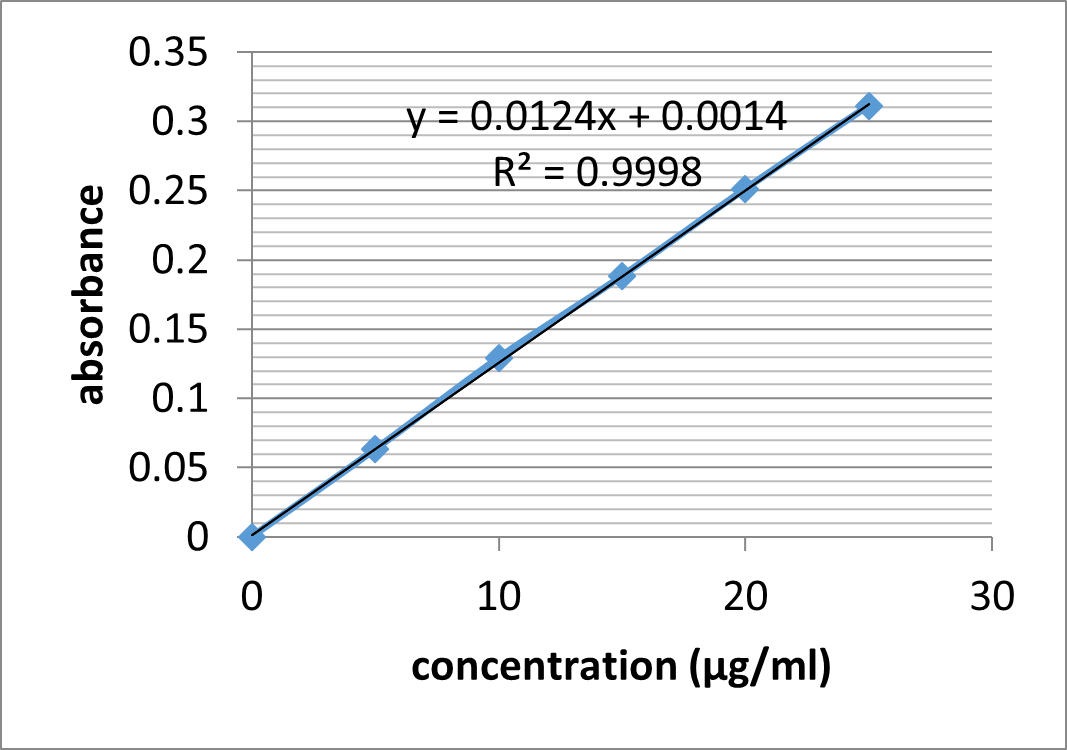
Figure 11: Calibration Curve of Aceclofenac in HCl buffer pH 1.2
- IN PHOSPHATE BUFFER pH 6.8
UV absorption spectrum of Aceclofenac in Phosphate buffer pH 6.8 shows ?max at 274 nm. The data for standard curve of Aceclofenac in buffer pH 6.8 is shown in table 5.5. The standard plot is as shown in figure 5.4. Beer Lambert Law was obeyed over the range of 0-25 ?g /ml and data was found to fit the equation
y = 0.028 + 0.002
r2 = 0.999
Table 14: Data of concentration and absorbance for Aceclofenac in Phosphate buffer pH 6.8
|
Sr.No
|
Concentration(µg/ml)
|
Absorbance
|
|
1
|
0
|
0
|
|
2
|
5
|
0.155
|
|
3
|
10
|
0.292
|
|
4
|
15
|
0.43
|
|
5
|
20
|
0.575
|
|
6
|
25
|
0.731
|
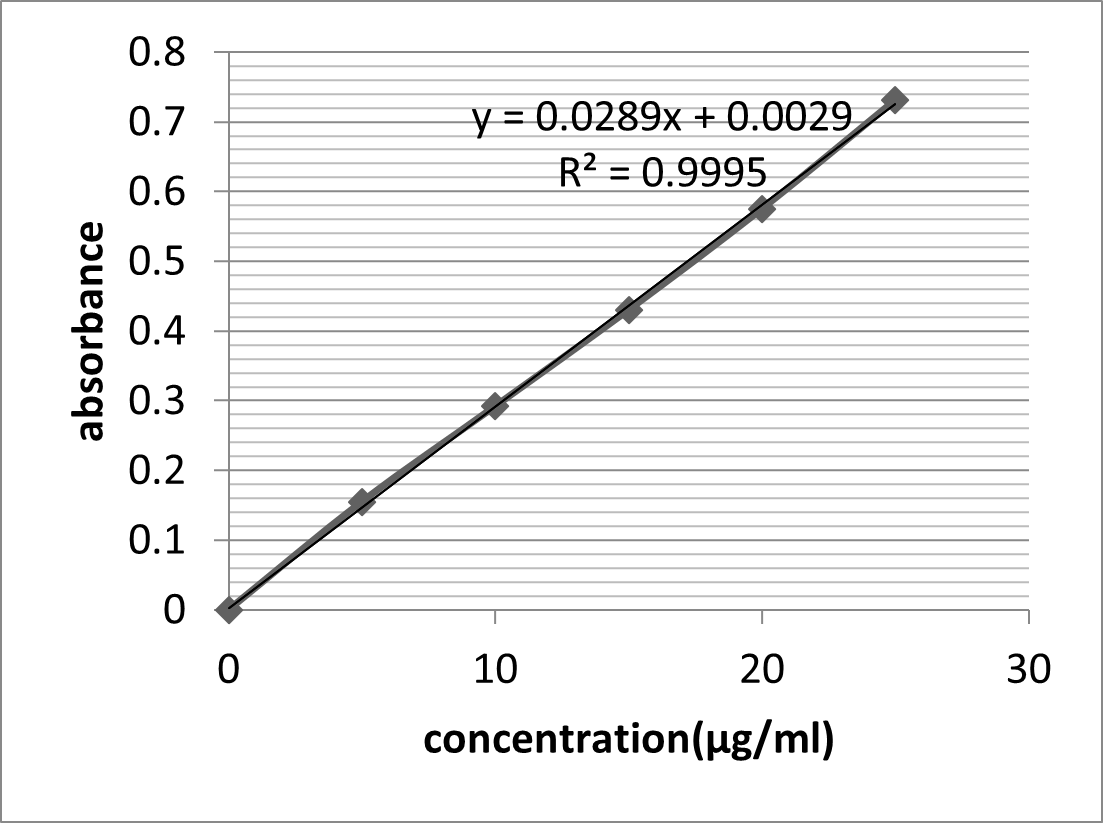
Figure 12: Calibration Curve of Aceclofenac in Phosphate Buffer pH 6.8
104. Compatibility Testing Of Drug With Polymer:
10.4.1. Fourier Transform Infra-Red (FTIR) Spectra’s
Table 15: Interpretation of Aceclofenac FTIR Spectra
|
Wavelength
|
Functional groups
|
|
3319.01 cm-1
|
–N-H Stretching
|
|
2936.8 cm-1
|
Aromatic -C-H Stretching
|
|
1771.5 cm-1
|
-COO- Stretching
|
|
1716.8 cm-1
|
-C=O Stretching
|
|
1589.5 cm-1
|
-C=C cis/vinyl strong; trans weak bonds
|
|
750.0 cm-1
|
Aromatic-Cl
|
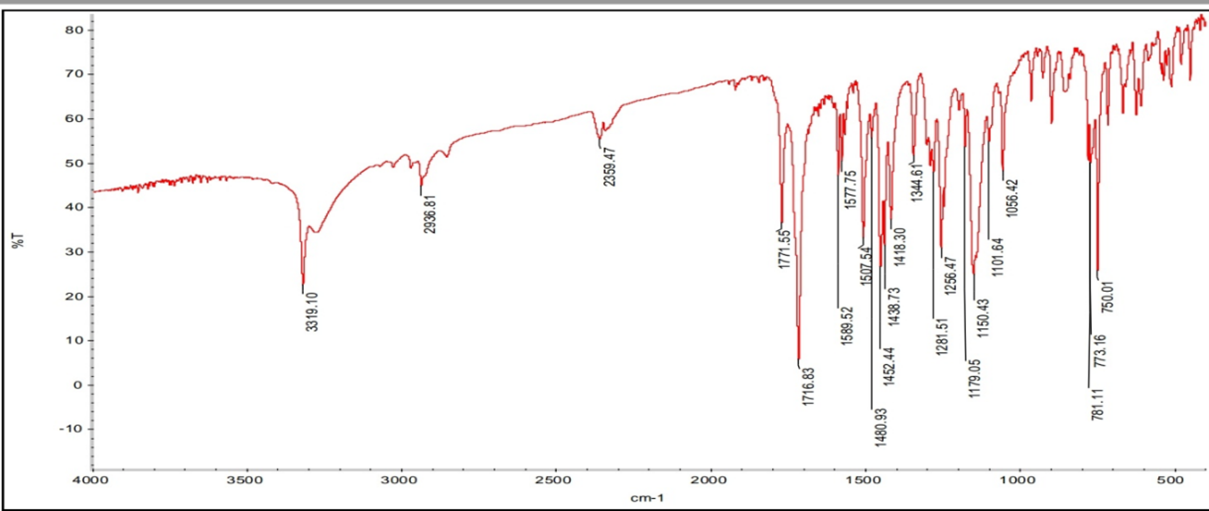
Figure 13: FTIR Spectra of Aceclofena
FTIR Spectra of HPMC K4M

Figure 14: FTIR Spectra of HPMC K4M
Table 16: Interpretation of FTIR Spectra of HPMC K4M
|
Wavelength
|
Functional groups
|
|
3459.75 cm-1
|
H-bonded alcohol
|
|
2933.26 cm-1
|
Carboxylic acid
|
|
1652.95 cm-1
|
N-H bending
|
|
1065.02 cm-1
|
Alkenes
|
|
945.65 cm-1
|
C-H (aromatic)
|
|
569.18 cm-1
|
C-Cl (alkyl halides)
|
Table 17: Interpretation of FTIR spectra of Aceclofenac and HPMC K4M
|
Wavelength
|
Functional group
|
|
3439.16 cm-1
|
–N-H Stretching
|
|
3042.18 cm-1
|
Aromatic -C-H Stretching
|
|
1621.72 cm-1
|
-COO- Stretching
|
|
1716.19 cm-1
|
-C=O Stretching
|
|
1523.54 cm-1
|
-C=C cis/vinyl strong; trans weak bonds
|
|
803.14 cm-1
|
Aromatic-Cl
|

Figure 15: FTIR Spectra of Blend of Aceclofenac and HPMC K4M
10.5 Evaluation Of Sustained Release Tablets Of Aceclofenac
10.5.1 Appearance:
The tablets were observed visually and did not show any defect such as capping, chipping and lamination.
10.5.2 Thickness
Ten tablets were randomly selected from each batch and their thickness was measured by using Vernier Caliper. The thickness of tablets for formulations F1 to F9 is given in Table 18.
10.5.3 Weight Variation Test
A tablet is designed to contain a specific amount of drug. The average weight of the tablet is 350 mg and the pharmacopoeial limit for percentage deviation is ± 5 %. Average weight of tablets for formulations F1 to F9 are mentioned in Table 18.
10.5.4 Tablet Hardness
A difference in tablet hardness reflects difference in tablet density and porosity. Hardness was measured using Monsanto hardness tester. The hardness of tablets was found to be in the range of 6.70 ± 0.54 kg/cm2 to 7.09 ± 0.55 kg/cm2. This indicates good tablet strength. The observed value of hardness of tablets for formulations F1 to F9 is mentioned in a Table 18.
10.5.5 Percentage Friability
Twenty tablets were weighed and placed in the Roche Friabilator apparatus and were rotated at 100 rpm for 4 minutes. After revolutions, the tablets were de-dusted and weighed again. Percentage friability of all the formulations was found between 0.22 to 0.56%. This indicates good handling property of the prepared SR tablet. The percentage friability of tablets for formulations F1 to F9 is given in Table 18.
The percentage friability was measured using the formula,
% F = {1- (Wt / W)} x 100
Where
%F = friability in percentage
W = Initial weight of tablet
Wt = weight of tablet after revolution
10.5.6 Drug Content Of Aceclofenac:
The content of active ingredients in the formulation was found to be between 98.67± 1.09 % to 99.81±0.87% w/w, which lies within the specified limit as per Indian Pharmacopoeia 1996, 90-110 % w/w. Drug content in formulations F1 to F9 is given in Table 18.
Table 18: Evaluation tests of Formulations F1 to F9
|
Formulation
|
Thickness
(mm)
|
Hardness
(kg/cm2)
|
Weight variation (mg)
|
Friability
(%)
|
Drug Content
(% w/w)
|
|
F1
|
4.39±0.06
|
7.01 ± 0.59
|
352.67 ± 2.26
|
0.28
|
99.18±0.45
|
|
|
F2
|
4.45±0.02
|
7.05 ± 0.63
|
350.56 ± 2.92
|
0.56
|
99.72±0.56
|
|
|
F3
|
4.42±0.07
|
7.02 ± 0.54
|
353.32 ± 2.77
|
0.42
|
99.59±0.69
|
|
|
F4
|
4.48±0.08
|
7.09 ± 0.55
|
350.98 ±2.39
|
0.22
|
99.81±0.87
|
|
|
F5
|
4.48±0.04
|
7.01 ± 0.58
|
351.43 ± 2.84
|
0.39
|
99.08±1.05
|
|
|
F6
|
4.47±0.05
|
7.07 ± 0.61
|
352.18 ± 2.39
|
0.22
|
99.32±1.41
|
|
|
F7
|
4.41±0.07
|
7.05 ± 0.55
|
351.75 ± 2.92
|
0.48
|
99.41±0.35
|
|
|
F8
|
4.42±0.04
|
6.95 ± 0.55
|
350.72 ± 2.95
|
0.48
|
98.67±1.09
|
|
|
F9
|
4.45±0.04
|
6.70 ± 0.54
|
351.62 ±2.78
|
0.34
|
98.90±0.65
|
|
N=3, Mean ± S.D
10.5.7 In-Vitro Dissolution Studies:
To simulate the pH variation in the GI tract, dissolution studies were performed first in HCl buffer pH 1.2 for 2 hours and later in phosphate buffer 6.8 pH. All the formulations showed very low drug release in HCl buffer pH 1.2. This was due to the very low solubility of Aceclofenac at pH 1.2. The release of the drug is faster in phosphate buffer pH 6.8 than HCl buffer medium.
All the matrix formulations, except F1, did not disintegrate within the 2-hour dissolution test period in pH 1.2 buffer. The disintegration of F1 tablets is probably due to its matrix which consisted of low – viscosity HPMC (E15) which is more soluble than the higher viscosity grades of the polymer. Tablets of formulation F1 to F3 with HPMC E15 shows release rate of 91.34%, 89.75% and 84.46%. Release rate for formulations F4 to F6 is 96.75%, 93.61% and 90.65 % whereas formulations F7 to F9 shows 91.23%, 87.56% and 81.38 % release of drug. Results of dissolution test are mentioned in tables 19, 20 and 21.
Table 19: In-Vitro Dissolution Result of formulations F1 to F3 with HPMC E15 as polymer
|
Time (hours)
|
Formulation F1
|
Formulation F2
|
Formulation F3
|
|
0
|
0 + 0.00
|
0 + 0.00
|
0 + 0.00
|
|
1
|
9.19 + 0.19
|
8.67 + 0.65
|
7.86 + 0.55
|
|
2
|
18.75 + 0.84
|
17.52 + 0.29
|
14.07 + 0.21
|
|
3
|
28.98 + 0.54
|
27.78 + 0.64
|
20.56 + 0.67
|
|
4
|
39.87 + 0.67
|
38.21 + 0.91
|
28.29 + 0.93
|
|
5
|
50.65 + 0.22
|
48.02 + 0.78
|
36.65 + 0.71
|
|
6
|
59.71 + 0.98
|
56.54 + 0.45
|
44.78 + 0.43
|
|
7
|
68.54 + 0.23
|
64.32 + 0.76
|
54.34 + 0.68
|
|
8
|
74.85 + 0.77
|
70.09 + 0.81
|
62.51 + 0.83
|
|
9
|
81.2 + 0.51
|
76.71 + 0.94
|
70.23 + 0.53
|
|
10
|
87.23 + 0.43
|
81.67 + 0.72
|
75.21 + 0.67
|
|
11
|
91.34 + 0.56
|
89.75 + 0.15
|
81.36 + 0.7
|
|
12
|
--
|
--
|
84.46 + 0.48
|
N=3, Mean ± S.D
Table 20: In-Vitro Dissolution Result of formulations F4 to F6 with HPMC K4 as polymer
|
Time (hours)
|
Formulation F4
|
Formulation F5
|
Formulation F6
|
|
0
|
0 +0.00
|
0 +0.00
|
0 + 0.00
|
|
1
|
16.26 + 0.24
|
15.4 + 0.86
|
12.54 + 0.13
|
|
2
|
27.43 + 0.69
|
25.06 + 0.49
|
23.61 + 0.74
|
|
3
|
38.57 + 0.25
|
39.54 + 0.27
|
37.6 + 0.69
|
|
4
|
49.02 + 0.79
|
49.08 + 0.83
|
48.01 + 0.94
|
|
5
|
59.05 + 0.6
|
59.12 + 0.91
|
56.11 + 0.26
|
|
6
|
67.45 + 0.37
|
67.41 + 0.45
|
64.37 + 0.61
|
|
7
|
74.72 + 0.45
|
73.5 + 0.92
|
70.03 + 0.75
|
|
8
|
81.85 + 0.62
|
79.62 + 0.31
|
76.28 + 0.32
|
|
9
|
87.25 + 0.94
|
85.74 + 0.64
|
82.34 + 0.79
|
|
10
|
90.5 + 0.53
|
89.43 + 0.89
|
85.61 + 0.5
|
|
11
|
93.25 + 0.86
|
90.98 + 0.64
|
89.98 + 0.23
|
|
12
|
96.75 + 0.39
|
93.61 + 0.43
|
90.65 + 0.74
|
N=3, Mean ± S.D
Table 21: In-Vitro Dissolution Result of formulations F7 to F9 with Guar Gum as polymer
|
Time (hours)
|
Formulation F7
|
Formulation F8
|
Formulation F9
|
|
0
|
0 +0.00
|
0 + 0.00
|
0+ 0.00
|
|
1
|
9.3 + 0.53
|
8.23 + 0.16
|
7.59 + 0.73
|
|
2
|
17.82 + 0.9
|
19.36 + 0.20
|
17.82 + 0.21
|
|
3
|
27.93 + 0.71
|
28.7 + 0.32
|
28.78 + 0.39
|
|
4
|
36.81 + 0.19
|
39.43+ 0.12
|
37.85 + 0.7
|
|
5
|
45.07 + 0.22
|
48.45 + 0.30
|
46.7 + 0.61
|
|
6
|
54.1 + 0.65
|
56.39 + 0.76
|
54.34 + 0.76
|
|
7
|
62.83 + 0.46
|
64.82 + 0.63
|
62.79 + 0.42
|
|
8
|
70.14 + 0.39
|
70.23 + 0.59
|
69.47 + 0.96
|
|
9
|
78.26 + 0.91
|
75.89 + 0.86
|
73.27 + 0.12
|
|
10
|
83.13 + 0.24
|
81.93 + 0.36
|
77.36 + 0.08
|
|
11
|
87.55 + 0.51
|
87.56 + 0.77
|
81.38 + 0.32
|
|
12
|
91.23 + 0.65
|
--
|
--
|
N=3, Mean ± S.D

Figure 16: In vitro dissolution of formulations F1-F3 with HPMC E15 as polymer
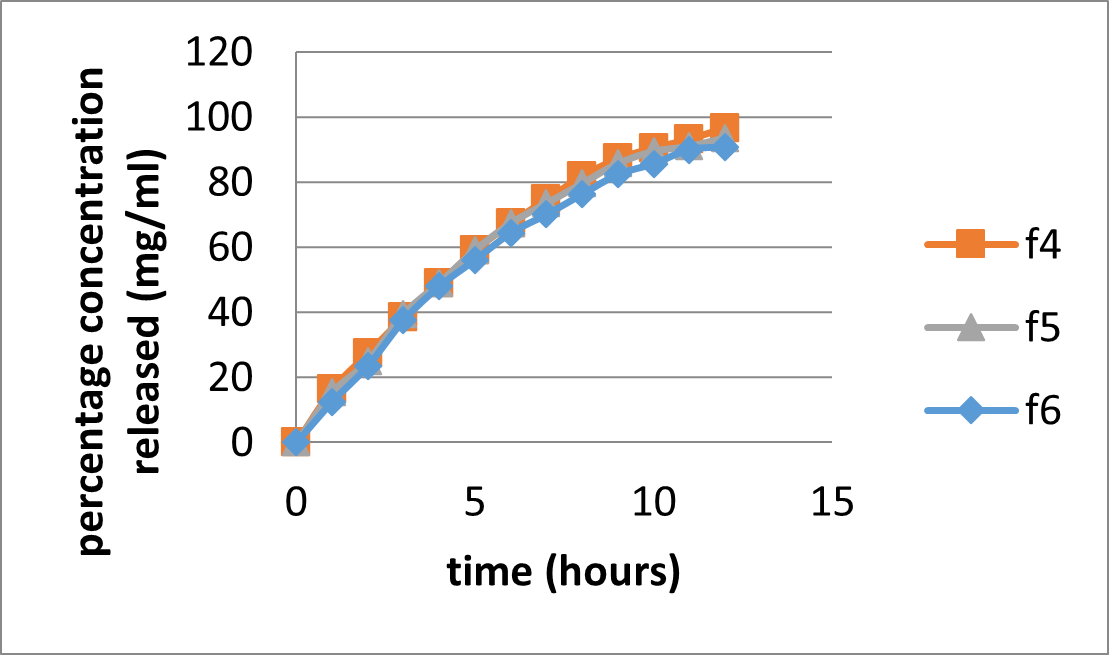
Figure 17: In vitro dissolution of formulations F4-F6 with HPMC K4 as polymer

Figure 18: In vitro dissolution of formulations F7-F9 with Guar Gum as polymer
10.5.8 Kinetic Study
To describe the kinetics of Aceclofenac sustained release tablet, the corresponding dissolution data were fitted in various kinetic dissolution models. The kinetics for Aceclofenac sustained release tablets were examined based on the magnitude of correlation coefficients obtained after application of zero order, first order, Korsemeyer peppas and Higuchi diffusion models. The kinetic analysis of drug release showed the release of drug from formulation in following order: Higuchi > Korsemeyer –Peppas >Zero order, First order. A higher correlation, as indicated by (r2) is observed for the Higuchi matrix release kinetics in most of the formulations suggesting the diffusion as a probable prominent mechanism of drug release.(Manoj Kumar Sarangi et al, 2018)
The value of correlation coefficient for zero order ranges from 0.946 to 0.997, for first order r2 ranges from 0.937 to 0.991. For Higuchi model value of r2 limits from 0.989 to 0.996 and for Korsemeyer Peppas plot r2 value ranges from 0.983 to 0.996 and value of n varies from 0.735 to 1.025.
Table 22: In-vitro Release Kinetic models for Aceclofenac sustained release Matrix tablets of Formulations (F1 to F9)
|
Formulation
|
Zero order
|
First order
|
Higuchi
|
Korsemeyer-Peppas
|
Best fit model
|
|
|
r 2
|
r 2
|
r 2
|
r 2
|
N
|
|
|
F1
|
0.973
|
0.962
|
0.993
|
0.991
|
0.956
|
Higuchi
|
|
F2
|
0.981
|
0.959
|
0.972
|
0.992
|
0.962
|
Korsemeyer- Peppas
|
|
F3
|
0.997
|
0.937
|
0.972
|
0.996
|
1.025
|
Zero order
|
|
F4
|
0.957
|
0.963
|
0.992
|
0.991
|
0.735
|
Higuchi
|
|
F5
|
0.946
|
0.989
|
0.989
|
0.985
|
0.752
|
Higuchi, First order
|
|
F6
|
0.949
|
0.991
|
0.992
|
0.981
|
0.802
|
Higuchi
|
|
F7
|
0.984
|
0.970
|
0.991
|
0.996
|
0.945
|
Korsemeyer- Peppas
|
|
F8
|
0.974
|
0.981
|
0.996
|
0.986
|
0.948
|
Higuchi
|
|
F9
|
0.971
|
0.987
|
0.996
|
0.983
|
0.963
|
Higuchi
|
For formulation F4, drug release data was best explained by Higuchi equation, as the plots showed the highest linearity (r2 = 0.992), followed Korsmeyer-Peppas (r2= 0.991) and first order (r2= 0.963). As the drug release was best fitted in first order kinetics, indicating that the rate of drug release is concentration dependent. Higuchi’s kinetics explains why the drug diffuses at a comparatively slower rate as the distance for diffusion increases.
Mechanism of drug release
As shown in Figure, the corresponding plot (log cumulative percent drug release vs time) for the Korsmeyer-Peppas equation indicated a good linearity (r2= 0.991). The diffusion exponent n was 0.735, which appears to indicate a coupling of the diffusion and erosion mechanism (Anomalous diffusion) and shows that the drug release was controlled by more than one process.
Table 23: Drug Release Kinetics of Formulation (F4) Matrix Tablets
|
Zero order
|
First order
|
Higuchi
|
Korsmeyer Peppas
|
|
r 2
|
K0 (h-1)
|
r 2
|
K1 (h -1)
|
r 2
|
KH (h-1/2)
|
r2
|
N
|
|
|
0.957
|
7.371
|
0.963
|
0.121
|
0.992
|
3.65
|
0.991
|
0.735
|
| |
|
|
|
|
|
|
|
|
|
r2 = Correlation coefficient; K = Kinetic constant; n= Diffusional exponent.
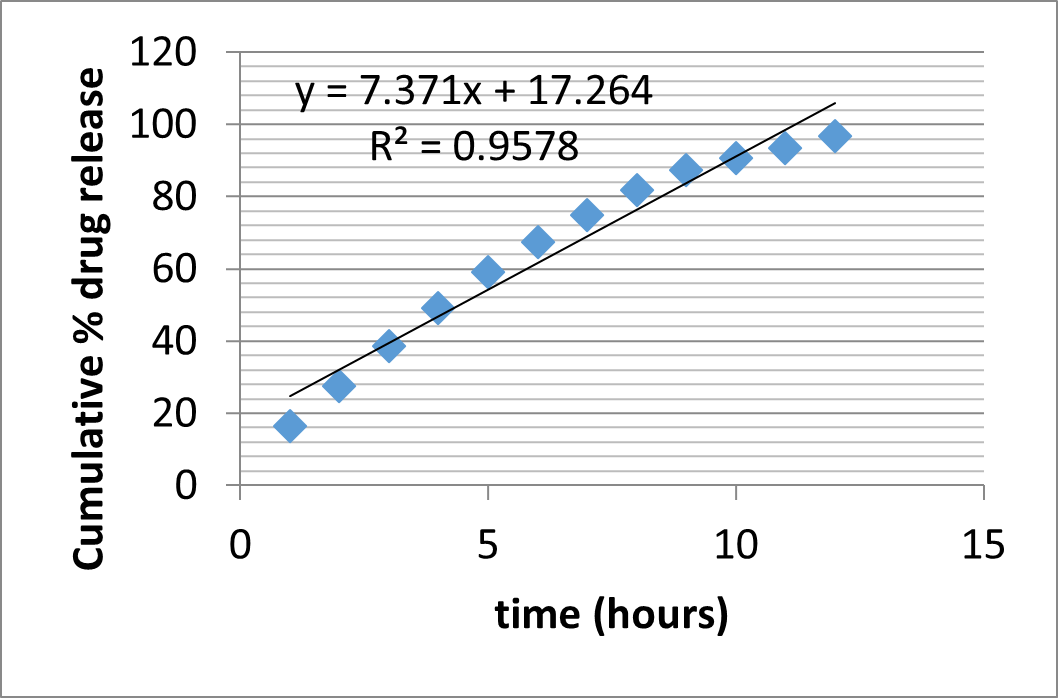
Figure 19: Zero order kinetics of Formulation F4

Figure 20: First order kinetics of Formulation F4

Figure 21: Higuchi plot of F4 formulation
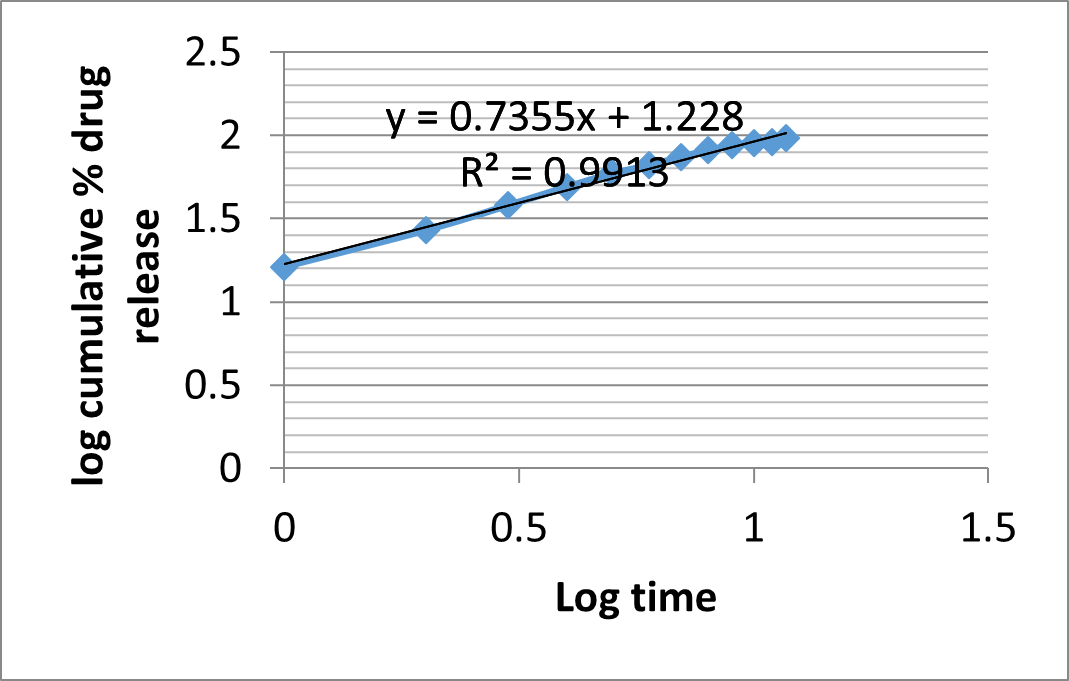
Figure 22: Korsmeyer-Peppas plot of Formulation F4
SUMMARY AND CONCLUSION
The study was undertaken with an aim to formulate and evaluate Aceclofenac sustained release tablets using different polymers like HPMC E15, HPMC K4M and Guar Gum as release retarding agent. Tablets were formulated with varying polymer concentration. Aceclofenac is anti-inflammatory, analgesic in nature and used in symptomatic treatment of rheumatoid arthritis and osteoarthritis. Because of its short biological half-life (3- 4 hours) and dosing frequency of more than one per day, Aceclofenac is considered as an ideal candidate for sustained release drug delivery system.
Preformulation study of active pharmaceutical ingredient, Aceclofenac was done initially for determination of its physical characteristics, analytical profiles and drug polymer compatibility study. Tablets were prepared by direct compression method. Later, tablets were subjected to post-compression evaluation tests like Thickness, Hardness, Weight variation, Friability, content uniformity and in-vitro dissolution testing and Kinetic study of drug release. Results of In-vitro dissolution testing showed that Aceclofenac showed pH dependent solubility. At lower pH, the solubility was less and as the pH was raised from acidic (1.2) to basic (6.8) its solubility drastically improved. This can be indicated by lower concentration of drug release in acidic media as compared to basic media. In-vitro dissolution result of formulation containing HPMC E15 ranged from 84.46 % to 91.34%. Formulation F4 –F6 containing HPMC K4M showed drug release from 90.65 % to 96.75 %. Formulation with Guar Gum showed drug release from 81.38% to 91.23%. Result of the present study demonstrated that hydrophilic polymers were successfully employed for formulating sustained release matrix tablets of Aceclofenac. Most of the investigated sustained release matrix tablets were capable of maintaining constant plasma concentration upto 12 hours. This can be expected to reduce the frequency of administration and decrease the dose dependent side effects. Moreover, in present investigation, the effect of type and concentration of polymer were studied on In-Vitro drug release. It shows that increase in concentration of polymer results in the sustaining the drug release. So, the study has revealed that by increasing concentration of polymer, release rate of drug is retarded and results confirmed that the release rate from hydrophilic matrix tablets depends on type and concentration of polymer. Release study was further subjected to kinetic study, which indicated F4 formulation was best fitted in Higuchi Model with highest regression coefficient ,r2 0.992, Korsemeyer-Peppas Model with highest regression coefficient ,r2 0.991 and diffusion exponent n equals 0.735.This showed drug release from hydrophilic polymer was controlled by more than one process.
REFERENCES
- Gaurav Agarwal, Shilpi Agarwal and Shagun Goyal (2018) “Formulation & Evaluation of Sustained Release Matrix Tablet of Repaglinide, Crimson Publishers; Volume 1, Issue 2, Page No. 1-9, ISSN 2578-0247
- Sudhir Karna, Shashank Chaturvedi, Vipin Agrawal, Mohammad Alim (2015 ) “Formulation Approaches For Sustained Release Dosage Forms: A Review” Asian Journal of Pharmaceutical and Clinical Research, Volume 8,Issue 5,Page No. 46-53 ISSN - 0974-2441
- K. P. Sampath Kumar, Debjit Bhowmik, Chiranjib, Margret Chandira, K. K.Tripathi (2010) “Innovations in Sustained Release Drug Delivery System and Its Market Opportunities” Journal of Chemical and Pharmaceutical Research,Volume 2,Issue1, Page No. 349-360, ISSN No: 0975-7384
- Ratnaparkhi M. P., Gupta Jyoti P (2013 “Sustained Release Oral Drug Delivery System - An Overview” International Journal of Pharma Research & Review, Mar; Volume 2,Issue3,Page No.11-21
- A. Anka Rao, V. Narasimha Rao, A. Seetha Devi,K. Anil, V. Vasu Naik and A. Rajesh (2015) “ Oral Controlled Release Drug Delivery System: An Overview” International Journal of Pharma And Chemical Research , Volume 1 , Issue 1,Page No.6-15, ISSN 2395-3411
- Sahilhusen I Jethara, Mukesh R Patel and Alpesh D Patel (2014) “Sustained Release Drug Delivery Systems: A Patent Overview” Aperito Journal of Drug Designing And Pharmacology, Volume 1 , Issue 1,Page No.1-14
- Sarika Pundir, Ashutosh Badola And Deepak Sharma (2013)“Sustained Release Matrix Technology And Recent Advance In Matrix Drug Delivery System: A Review” International Journal of Drug Research and Technology Volume 3,Issue1, Page No.12-20,ISSN 2277-1506
- Singh Arjun, Sharma Ritika, Jamil Faraz (2012) “Sustained Release Drug Delivery System: A Review” International Research Journal of Pharmacy, Volume 3,Issue 9,Page No. 21-24, ISSN 2230-8407
- Khyati Patel, Dr. Upendra Patel1, Bhavin Bhimani (2012) “Extended Release Oral Drug Delivery System” International Journal Of Pharmaceutical Research And Bio-Science, Volume1,Issue3,Page No.1-26, ISSN: 2277-8713
- Gaurav Gujral, Devesh Kapoor, Manish Jaimini (2018) review article on “An Updated Review On Modified Release Tablets” Journal of Drug Delivery and Therapeutics;Volume 8, Issue 4, Page No.5-9, ISSN: 2250-1177
- M.M. Gupta, Ray Brijesh (2012, ) “A Review On: Sustained Release Technology” International Journal of Therapeutic Applications, Volume 8, Page No.18 – 23
- Modi Kushal et al (2013) Review Article “Oral Controlled Release drug delivery system: An Overview” International Research Journal of Pharmacy:Volume 8, Issue 4, Page no. 70-76
- Textbook on Biopharmaceutics And Pharmacokinetics By D.M Brahmankar, Sunil B. Jaiswal, 2015
- Sudhir Karna, Shashank Chaturvedi, Vipin Agrawal, Mohammad Alim (2015 ) “Formulation Approaches For Sustained Release Dosage Forms: A Review” Asian Journal of Pharmaceutical and Clinical Research, Volume 8,Issue 5,Page No. 46-53 ISSN - 0974-2441
- Rajesh Tiwari (2016) “Controlled Release Drug Formulation In Pharmaceuticals: A Study On Their Application And Properties” World Journal Of Pharmaceutical Research, Volume 5,Issue 2, Page No.1704-1720, ISSN 2277– 7105
- Saini Nisha, George Mathew, Joseph Lincy (2012) “Review Article Matrix Tablets: An Effective Way for Oral Controlled Release Drug Delivery” Iranian Journal of Pharmaceutical Sciences,Volume 8,Issue 3,Page No. 165-170
- Y. Ganesh Kumar, J. Sreekanth, D. Satyavati (2015) “Formulation Development and Evaluation of Sustained Release Matrix Tablets of Vildagliptin - Synthetic and Natural Polymers” Asian Journal of Pharmaceutics,Oct-Dec 2015(Suppl.),Volume 9,Issue 4
- Shivani Kala and Divya Juyal(2016) “Preformulation and characterization studies of aceclofenac active ingredient” The Pharma Innovation Journal;Volume 5,Issue9,Page No. 110-119, ISSN: 2277- 7695
- Syed Namath Ulla, Anup Kumar Roy, Martand Kulkarni, Vinod Kumar SM (2011) “Formulation and Evaluation Of Sustained Release Matrix Tablets of Lornoxicam” International Journal of Drug Development & Research, , Volume 3, Issue 1 , Page No. 31-44, ISSN 0975-934
- Lachman L., Lieberman H.A. and Kanig J. L (1991) “ The Theory and Practice of Industrial Pharmacy”, 3rd edn., Varghese Publishing House, Mumbai, Page No. 430-439.
- Indian Pharmacopoeia 2007, Government of India,Ministry Health and Family Walfare, Delhi Controller of Publication
- Y. Ganesh Kumar, J. Sreekanth, D. Satyavati (2015) “Formulation Development and Evaluation of Sustained Release Matrix Tablets of Vildagliptin - Synthetic and Natural Polymers” Asian Journal of Pharmaceutics,Oct-Dec 2015(Suppl.),Volume 9,Issue 4
- Brahmankar H.A and Jaiswal S.B “Biopharmaceutics and Pharmacokinetics- A treatise”, Vallabh Prakashan
- Santanu Ghosh and BB Barik (2010) “Formulation and in Vitro Evaluation of Once Daily Sustained Release Formulation of Aceclofenac” Tropical Journal of Pharmaceutical Research; 9 (3):Page No. 265-273
- Gaurav Agarwal, Shilpi Agarwal and Shagun Goyal (2018) “ Formulation & Evaluation of Sustained Release Matrix Tablet of Repaglinide ,Crimson Publishers; Volume 1, Issue 2,Page No. 1-9,ISSN 2578-0247
- Sudhir Karna, Shashank Chaturvedi, Vipin Agrawal, Mohammad Alim (2015 ) “Formulation Approaches For Sustained Release Dosage Forms: A Review” Asian Journal of Pharmaceutical and Clinical Research, Volume 8,Issue 5,Page No. 46-53 ISSN - 0974-2441
- K. P. Sampath Kumar, Debjit Bhowmik, Chiranjib, Margret Chandira, K. K.Tripathi (2010) “Innovations in Sustained Release Drug Delivery System and Its Market Opportunities” Journal of Chemical and Pharmaceutical Research,Volume 2,Issue1, Page No. 349-360, ISSN No: 0975-7384
- Ratnaparkhi M. P., Gupta Jyoti P (2013 “Sustained Release Oral Drug Delivery System - An Overview” International Journal of Pharma Research & Review, Mar; Volume 2,Issue3,Page No.11-21
- A. Anka Rao, V. Narasimha Rao, A. Seetha Devi,K. Anil, V. Vasu Naik and A. Rajesh (2015) “ Oral Controlled Release Drug Delivery System: An Overview” International Journal of Pharma And Chemical Research , Volume 1 , Issue 1,Page No.6-15, ISSN 2395-3411
- Sahilhusen I Jethara, Mukesh R Patel and Alpesh D Patel (2014) “Sustained Release Drug Delivery Systems: A Patent Overview” Aperito Journal of Drug Designing And Pharmacology, Volume 1 , Issue 1,Page No.1-14
- Sarika Pundir, Ashutosh Badola And Deepak Sharma (2013)“Sustained Release Matrix Technology And Recent Advance In Matrix Drug Delivery System: A Review” International Journal of Drug Research and Technology Volume 3,Issue1, Page No.12-20,ISSN 2277-1506
- Singh Arjun, Sharma Ritika, Jamil Faraz (2012) “Sustained Release Drug Delivery System: A Review” International Research Journal of Pharmacy, Volume 3,Issue 9,Page No. 21-24, ISSN 2230-8407
- Khyati Patel, Dr. Upendra Patel1, Bhavin Bhimani (2012) “Extended Release Oral Drug Delivery System” International Journal Of Pharmaceutical Research And Bio-Science, Volume1,Issue3,Page No.1-26, ISSN: 2277-8713
- Gaurav Gujral, Devesh Kapoor, Manish Jaimini (2018) review article on “An Updated Review On Modified Release Tablets” Journal of Drug Delivery and Therapeutics;Volume 8, Issue 4, Page No.5-9, ISSN: 2250-1177
- M.M. Gupta, Ray Brijesh (2012, ) “A Review On: Sustained Release Technology” International Journal of Therapeutic Applications, Volume 8, Page No.18 – 23
- Rajesh Tiwari (2016) “Controlled Release Drug Formulation In Pharmaceuticals: A Study On Their Application And Properties” World Journal Of Pharmaceutical Research, Volume 5,Issue 2, Page No.1704-1720, ISSN 2277– 7105
- Saini Nisha, George Mathew, Joseph Lincy (2012) “Review Article Matrix Tablets: An Effective Way for Oral Controlled Release Drug Delivery” Iranian Journal of Pharmaceutical Sciences,Volume 8,Issue 3,Page No. 165-170
- Ansel H.C., Allen L.V. and Popovich N.G. Pharmaceutical Dosage Forms and Drug Delivery System (2009). 8th Edition,Lippincott Williams and Wilkins, New Delhi, , Page No.227-274.
- Anton S.A, Muthu A.K, Panditrao W.B. and Manavalan R( 2009) “ Formulation Development and Evaluation of Ondansetron Hydrochloride Sustained Release Matrix Tablets”, Journal of Pharmaceutical Sciences and Research, , Volume 1,Issue4,Page No. 48-54
- Aulton M.E. Pharmaceutics: The science of dosage form design (2007) 3rd Edition, Churchill Livingstone, New York, Page No. 355-359,483-498
- Altaf A.S. Rathbone M.J.Hadgraft J.Rober.M.S (2003) “Modified Release Drug Delivery Technology” Marcel Dekker Inc.,New York, ,126,996
- Anil Kumar, Dilip Agrawal, Mahaveer Prasad Khinchi , Shankar Lal Soni, Surya Pratap Singh (2015) “Design Development And Evaluation Of Water Dispersible Tablet Of Aceclofenac Using Synthetic Superdisintigrants” Asian Journal of Pharmaceutical Research and Development, Volume 3,Issue 6,Page No.1-8, ISSN 2320-4850
- Asha Gandhi, SL Harikumar (2015)“Formulation And Evaluation Of Aceclofenac Matrix Tablets Using Hydrophobic Waxes For Sustained Release” Indian Journal Of Drugs,Volume 3,Issue 3, Page No.49-56 ,ISSN: 2348-1684
- Agarwal Prakhar, Akhtar Semimul (2018 )“A Comprehensive Review On Sustained Release Matrix Tablets: A Promising Dosage Form” Universal Journal of Pharmaceutical Research, Volume 3, Issue 6,Page No.53-58
- Anil Kumar, Dilip Agrawal, Mahaveer Prasad Khinchi , Shankar Lal Soni, Surya Pratap Singh (2015) “Design Development And Evaluation Of Water Dispersible Tablet Of Aceclofenac Using Synthetic Superdisintigrants” Asian Journal of Pharmaceutical Research and Development, Volume 3,Issue 6,Page No.1-8, ISSN 2320-4850
- Abdulsalam Alhalmi, Marwan Altowairi, Omer Saeed,Nafa Alzubaidi, Marwan Almoiliqy,Watheeq Abdulmalik (2018)“Sustained Release Matrix System: An Overview” World Journal Of Pharmacy And Pharmaceutical Sciences, Volume 7, Issue 6,Page No. 1476-1486,ISSN 2278 – 4357
- Bendgude NT, Lyer VR, Poddar SS “ Sustained Release From Layered Matrix System Comprising Rice Bran Wax And Sterculia Foetida Gum” Int.J.Pharm Tech.Research Volume 2,Issue 1: 989-05
- B.Venkateswara Reddy, K.Navaneetha Research “Formulation and Evaluation of Sustain Release Tablets of Ramipril” PharmaTutor Magazine ,Volume 2, Issue 7,Page No. 110-119
- Carstensen J.T. and Rhodes C.T. Drug Stability Principles and Practices (2008), 3rd edn., Marcel Dekker, Inc, New York, , Page No.415-481.
- Chandira M., Sandip, Murugantham V., Debjit, Kumundhavalli and Jayakar B (2009) “Formulation and Evaluation of Sustained Release Matrix Tablet of Zidovudine” International Journal of Current Pharmaceutical Research, ,Volume 1,Issue 1,Page No. 14-31.
- Cole T.,Follonier M and Doelkar E “Evaluation Of Hot Melt Extrusion As A New Technique For The Production Of Polymer Based Pellets For Sustained Release Capsules Containing High Loading Of Freely Soluble Drug” Drugs Develop Ind.Pharm. Volume 20, Issue 8, Page No.1323-1329
- Cox P.J, Khan.K.A and Munday D.L “ Development And Evaluation Of A Multiple Unit Oral Sustained Release Dosage Form For S(+) Ibuprofen: Preparation and Release Kintics”Int.J.Pharam.193 Page No.73-84
- Dhara B. Patel and Madhabhai M. Patel (2009) “Natural excipients in controlled drug delivery systems” Journal of Pharmacy Research 2009, Volume 2, Issue 5,Page No.900-907, ISSN: 0974-6943
- Debjit Bhowmik, Harish Gopinath, B. Pragati Kumar, S. Duraivel, K. P. Sampath Kumar (2012 ) “Controlled Release Drug Delivery Systems” The Pharma Innovation, Volume 1,Issue 10,Page No.24- 32, ISSN: 2277- 7695
- Dr.Umesh.D .Shivhare, Nandkishor D.Adhao, Dr.Kishore.P.Bhusari, Dr.Vijay.B.Mathur, Mr.Digvijay U. Ambulkar (2009) “Formulation Development, Evaluation and Validation of Sustained Release Tablets of Aceclofenac” International Journal of Pharmacy and Pharmaceutical Sciences, Volume 1, Issue 2, Page no.74-80
- Fathelrahman A.A. Adam (2007)” Design and Evaluation of Prolonged Release Gliclazide Matrix Tablets” Volume 1,Issue 1
- Gwen M.J, Joseph R.R, In.Banker G.S and Rhodes C.T(1996) “Modern Pharmaceutics” Marcel Dekker Inc.New York ,Volume 72,Issue 3,575
- Hindustan A.A et al “Formulation and Evaluation Of Once Daily Sustained Release Tablet of Aceclofenac Using Prosophis Juliflora” Int.J.Pharm.Sci. & Research
- Harekrishna Roy, Chandan K Brahma, Sisir Nandi, Kirti R Parida (2013“Formulation and design of sustained release matrix tablets of metformin hydrochloride: Influence of Hypromellose and Polyacrylate polymers” International Journal of Applied and Basic Medical Research, , Volume 3, Issue 1,Page No.55-63
- Harun-Or-Rashid, Abul Kalam Lutful Kabir,, Md. Zakir Hossain, Abu Shara Shamsur Rouf (2009) “ Design and Formulation of Once Daily Naproxen Sustained Release Tablet Matrix from Methocel K 15M CR and Methocel K 100M CR” Iranian Journal of Pharmaceutical Sciences,: 5(4): Page No. 215-224
- Habeeb Panikkarakayil, Madhavan Nampoothiri, Gladis Kachappilly, Mohammed Shameem, Raghunath Pariyani, Y Anitha (2013) “Formulation optimization and evaluation of aceclofenac sustained release dosage form based on Kollidon sustained release” Asian Journal of Pharmaceutics, Volume 7,Page No. 8-14
- H.D.Zalte, R.B.Saudagar (2013) “Review On Sustained Release Matrix Tablet” International Journal of Pharmacy and Biological Sciences, Volume 3 Issue 4,Page No.17-29, ISSN: 2230-7605
- Jahan Nur Rahman Hazarika, Pulak Deb (2017) “Formulation Evaluation And Optimization Of Immediate Release Tablet Of Aceclofenac By Direct Compression Method” International Journal Of Current Pharmaceutical Research Vol 9, Issue 3, ISSN- 0975-7066
- Kinam Park (2014) “The Controlled Drug Delivery Systems: Past Forward and Future Back” J Control Release. September 28; 190: Page No.1-17
- Le Sun, Weixiang Zhang, Xiaohong Liu, Jin Sun (2014) “Preparation and evaluation of sustained-release azithromycin tablets in vitro and in vivo” Asian Journal of Pharmaceutical SciencesPage No.,155-161
- Mayur Karvekar, Arshad Bashir Khan(2017) “A Brief Review on Sustained Release Matrix Type Drug Delivery System” Journal of Pharmaceutical Research Volume 16, Issue 3,Page No. 282-289
- Pritam Dinesh Choudhary and Harshal Ashok Pawar Review Article “Recently Investigated Natural Gums and Mucilages as Pharmaceutical Excipients: An Overview”Hindawi Publishing Corporation,Journal of Pharmaceutics, Volume 2014 Issue 5, Page No.1-9
- Parasuram Rajam Radhika, Pankaj R.Kharkate, Thangavel Sivakumar “Formulation of aceclofenac sustained release matrix tablet using hydrophilic natural gum (2011)” International Journal of Research in Ayurveda and Pharmacy, volume 2, Issue 3, Page No.851-857
- Raman Suresh Kumar, Suggula, Sai Ratan, Yakkala.Anil Raju (2014) “Formulation And In Vitro Characterization Of Aceclofenac Sustained Release Pellets Prepared By Suspension Layering Technique Using Sugar Spheres” International Journal of Drug Deliver ,Volume 6, Page No. 292-300, ISSN: 0975-0215
- Rishabha Malviya, Pranati Srivastava, Mayank Bansal and Pramod Kumar Sharma (2010) “Formulation And Optimization Of Sustained Release Tablets Of Diclofenac Sodium Using Guar Gum As Release Modifier” International Journal of Pharmaceutical Sciences and Research, Volume 1, Issue 6; Page No.82-88,ISSN: 0975-8232
- Ranjith Kumar Mamidala, Vamshi Ramana, Sandeep G, Meka Lingam, Ramesh Gunnu and Madhusudan Rao Yamsani (2009) “Factors influencing the design and performance of oral sustained/controlled release dosage form” International Journal of Pharmaceutical Sciences and Nanotechnology, , Volume 2, Issue 3,Page No,583-594
- Raghavendra R,Gandisagar,Tarum P (2009 ) “ Formulation and Evaluation of Sustained Release Matrix Tablet of Tramadol Hydrochloride” Int. J. Pharmaceutical Sciences, -1(1)Page No.60-70
- Supriyo Saha, Mohd Vaseem Fateh, Rajendra.S.Mehta, Mehtab Ali (2013)“Formulation of Sustained Release Aceclofenac Matrix tablets using Prunus Armenica L. Gum as a release retardant” Journal of Advanced Pharmacy Education & Research , Volume 3, Issue 3,Page No.206-216
- Santanu Ghosh and BB Barik (2010) “Formulation and in Vitro Evaluation of Once Daily Sustained Release Formulation of Aceclofenac” Tropical Journal of Pharmaceutical Research; 9 (3):Page No. 265-273
- S. Shanmugam, R. Manavalan And D. Venkappayya(2008) “Studies On Sustained Release Tablets Of Aceclofenac: Formulation And In Vitro Evaluation” Int. J. Chem. Sci.: 6(1), Page No.381-384


 Gurpreet Kaur*


 10.5281/zenodo.14538445