Department of Pharmaceutics, Loknete Dr. J.D. Pawar college of Pharmacy, Manur, Kalwan, Nashik- 423501.
The present study focuses on the formulation and evaluation of omeprazole mouth dissolving tablets (MDTs) designed for rapid disintegration and enhanced patient compliance. Omeprazole, a proton pump inhibitor, faces challenges in conventional dosage forms due to its instability in acidic environments and delayed onset of action. Using a direct compression method, various super disintegrants crospovidone,, sodium starch glycolate, and croscarmellose sodium—were tested in different concentrations across eight formulations. Pre- and post-compression parameters such as hardness, friability, disintegration time, and drug content were evaluated. Among all formulations, F5 exhibited the most promising results, with a disintegration time of 12?±?1.90 seconds and maximum drug release of 99.24% within 15 minutes. Drug-excipient compatibility was confirmed via FTIR and DSC analysis, and stability studies indicated consistent performance over time. These findings suggest that the optimized omeprazole MDT formulation offers an effective alternative to conventional dosage forms, ensuring rapid onset of action and improved therapeutic efficacy.
Tablet formulations are preferred primarily because of their low Right now, pure formulations are the most important requirement, followed by increased stability, packaging, transportation, and manufacturing costs. Over the last ten years, there has been an increase in demand for evaporating tablets, and this area of the pharmaceutical industry is currently growing rapidly Super disintegrants such as croscarmellose sodium and sodium starch glycolate are used to deliver medications to living things. To get the desired result with the fewest possible side effects, the medication must be taken at work in a specific amount and concentration. Super disintegrants including sodium starch glycolate, croscarmellose sodium, and crospovidone1 are used in the two fundamental processes for making tablets for oral disintegration1. It is also possible to lyophilize and vacuum-dry tablets to enhance their pore structure. Direct compression is utilized for all techniques because to its dependability, effectiveness, and affordability. For up to 50–60% of all dosage types, oral administration is the most common form of administration. Due to their exceptional ease of use, accuracy in Particularly popular are solid dose forms for pain relief, self-medication friendliness, dosage, and above all patient compliance. The most widely used solid dosage forms are capsules and tablets. widely used; nonetheless, swallowing issues are a major disadvantage for some patients. Drinking water is essential to taking an oral dosage form well. When traditional dose forms, such as tablets, are taken without water, people often experience discomfort.2 A possible method for achieving a quick onset of action or better bioavailability for medications with a high first-pass metabolism is oral mucosal drug administration. Because a rapidly dissolving medication can enter the systemic circulation immediately through the oral mucosa, there is increasing interest in creating alternate dosage forms, such as oral fast disintegrating tablets.3
METHODS
Spectrometric analysis
In order to create a standard stock solution of 100 µg/ml, 10 mg of precisely weighed omeprazole was dissolved in 100 ml of water in a 100 ml volumetric flask. The volume was then increased to 100 ml with water. 2.5 milliliters of the standard stock solution were pipetted into a 10-milliliter volumetric flask. Water was added to get the volume up to 10 ml. Between 200 and 400 nm, the resultant solution, which contained 10 µg/ml, was scanned.5
Infrared spectroscopy
IR spectroscopy is helpful scientific method for determining how drugs interact chemically and polymer during storage. Therefore, infrared spectroscopy utilization to examine how additional excipients employed in the formulation interact chemically with the Omeprazole. The drug's IR spectra was compared to that physical mixture of drug and excipients to verify for any potential interactions between medicine excipients.4
Differential Calorimetry scanning (DSC)
The differential scanning calorimetric technique was used to do a thermal examination of omeprazole with all excipients. An device called the Shimadzu DSC-60plus was used to evaluate the samples. All excipients and a sample equal to around 8 mg of omeprazole were heated in aluminum pans from 25 to 300 °C at a rate of 10 °C per minute.6
Preparation of Omeprazole MDT
All materials, with the exception of Aerosil and magnesium sterate, were weighed precisely and mixed uniformly in a mortar and pestle for fifteen minutes. The prepared powder mixture was run through sieve number 60. After passing through filter number 30, Aerosil and magnesium sterate were added and combined for an additional ten minutes.7 200 mg of a precisely weighed, uniformly blended powder blend was manually fed into a Cadmach tablet compression machine, which used 8 mm, breakthrough, and flat-faced punches to crush the mixture with consistent compression force and hardness. Nine formulations in all were created. 8.
Experimental Design
A methodical and scientific way to investigate the connection and interplay between independent and dependent variables is through experimental design. 23 In order to optimise the formulas, a complete factorial design was suggested. A sufficient degree of flexibility is provided by the chosen design to ascertain the primary impacts of both individual variables and factor interactions.10
Table 1: Composition of independent variables and their levels for the preparation of Omeprazole mouth dissolving tablet.
|
Sr. No. |
Independent factor |
Unit |
Low (-1) |
High (+1) |
|
1 |
Croscarmellose sodium |
mg |
4 |
8 |
|
2 |
sodium starch glycolate |
mg |
4 |
8 |
|
3 |
crospovidone |
mg |
4 |
8 |
Table 2: 23 full factorial design for formulation designed using Stat-Ease Design-Expert® soft-ware (Version 8.0.7.1)
|
Formulations |
F1 |
F2 |
F3 |
F4 |
F5 |
F6 |
F7 |
F8 |
|
Omeorazole |
20 |
20 |
20 |
20 |
20 |
20 |
20 |
20 |
|
sodium starch glycolate |
4 |
8 |
4 |
4 |
8 |
4 |
8 |
8 |
|
Croscarmellose |
4 |
4 |
8 |
8 |
8 |
4 |
8 |
4 |
|
Crospovidone |
4 |
8 |
4 |
8 |
8 |
8 |
4 |
4 |
|
Mannitol |
25 |
25 |
25 |
25 |
25 |
25 |
25 |
25 |
|
Microcrystalline cellulose |
128 |
120 |
124 |
120 |
116 |
124 |
120 |
124 |
|
Sodium Saccharin |
5 |
5 |
5 |
5 |
5 |
5 |
5 |
5 |
|
Aerosil |
5 |
5 |
5 |
5 |
5 |
5 |
5 |
5 |
|
Magnesium stearate |
5 |
5 |
5 |
5 |
5 |
5 |
5 |
5 |
|
Strawberry flavouring agent |
qs |
qs |
qs |
qs |
qs |
qs |
qs |
qs |
|
Total |
200 mg |
200 mg |
200 mg |
200 mg |
200 mg |
200 mg |
200 mg |
200 mg |
Evaluation of MDT
In order to evaluate omeprazole in mouth dissolving tablets, important factors such tablet hardness, friability, disintegration time, and drug content homogeneity were evaluated. Acceptable mechanical strength and quick breakdown in the oral cavity were verified. The formulation is suitable for quick and effective oral drug administration, as evidenced by in vitro dissolution experiments showing effective drug release and UV spectrophotometric measurement at 245 nm confirming constant drug content12-13.
In-vitro dissolution study
Dissolution studies were conducted under sink conditions using an 8-station USP Type II paddle apparatus with 900?mL of phosphate buffer (pH 6.8) as the medium. The temperature was maintained at 37?±?2?°C, with paddles rotating at 50?rpm. Samples of 5?mL were withdrawn at 1, 2, 3, 5, 6, 7, 8, 9, 10, 11, and 12 hours, and an equal volume of fresh medium was added to maintain constant volume. The samples were diluted and analyzed using a UV spectrophotometer at 245?nm to determine drug release.14-15
Stability Studies
Appearance
The tablets were visually inspected at regular intervals for any changes in physical characteristics such as color, texture, or surface integrity. Any signs of discoloration, mottling, or cracking were carefully noted to assess the physical stability of the formulation during storage under accelerated conditions.
Disintegration Time
The disintegration time of the tablets was determined using a standard disintegration test apparatus as per pharmacopeial guidelines. One tablet was placed in each tube of the basket rack, and the assembly was immersed in a beaker containing phosphate buffer at 37 ± 2°C. The time taken for complete disintegration of the tablets without any palpable mass was recorded.
Dissolution
The dissolution studies were performed using a USP Type II (paddle) apparatus. The tablets were placed in 900 mL of phosphate buffer (pH 6.8) maintained at 37 ± 0.5°C with paddle rotation at 50 rpm. At predetermined time intervals, samples were withdrawn and replaced with fresh medium to maintain sink conditions. The collected samples were filtered and analyzed using a UV spectrophotometer at 245 nm to determine the percentage of drug released.
Drug Content
The drug content of the tablets was assessed by dissolving a known quantity of powdered tablet in a suitable solvent such as methanol. The resulting solution was diluted to a defined volume and filtered. An aliquot was then analyzed spectrophotometrically at the specific wavelength (245 nm) to determine the actual amount of drug present in the formulation.
RESULTS AND DISCUSSION
Spectrometric analysis
The λmax of omeprazole was determined by preparing a standard solution in methanol. A 10?mg sample of omeprazole was dissolved in methanol and diluted to 100?mL to obtain a 100?µg/mL stock solution. From this, 2.5?mL was further diluted to 10?mL to obtain a 10?µg/mL solution, which was scanned in the UV range of 200–400?nm. The maximum absorbance (λmax) for omeprazole in methanol was found to be at 295?nm.
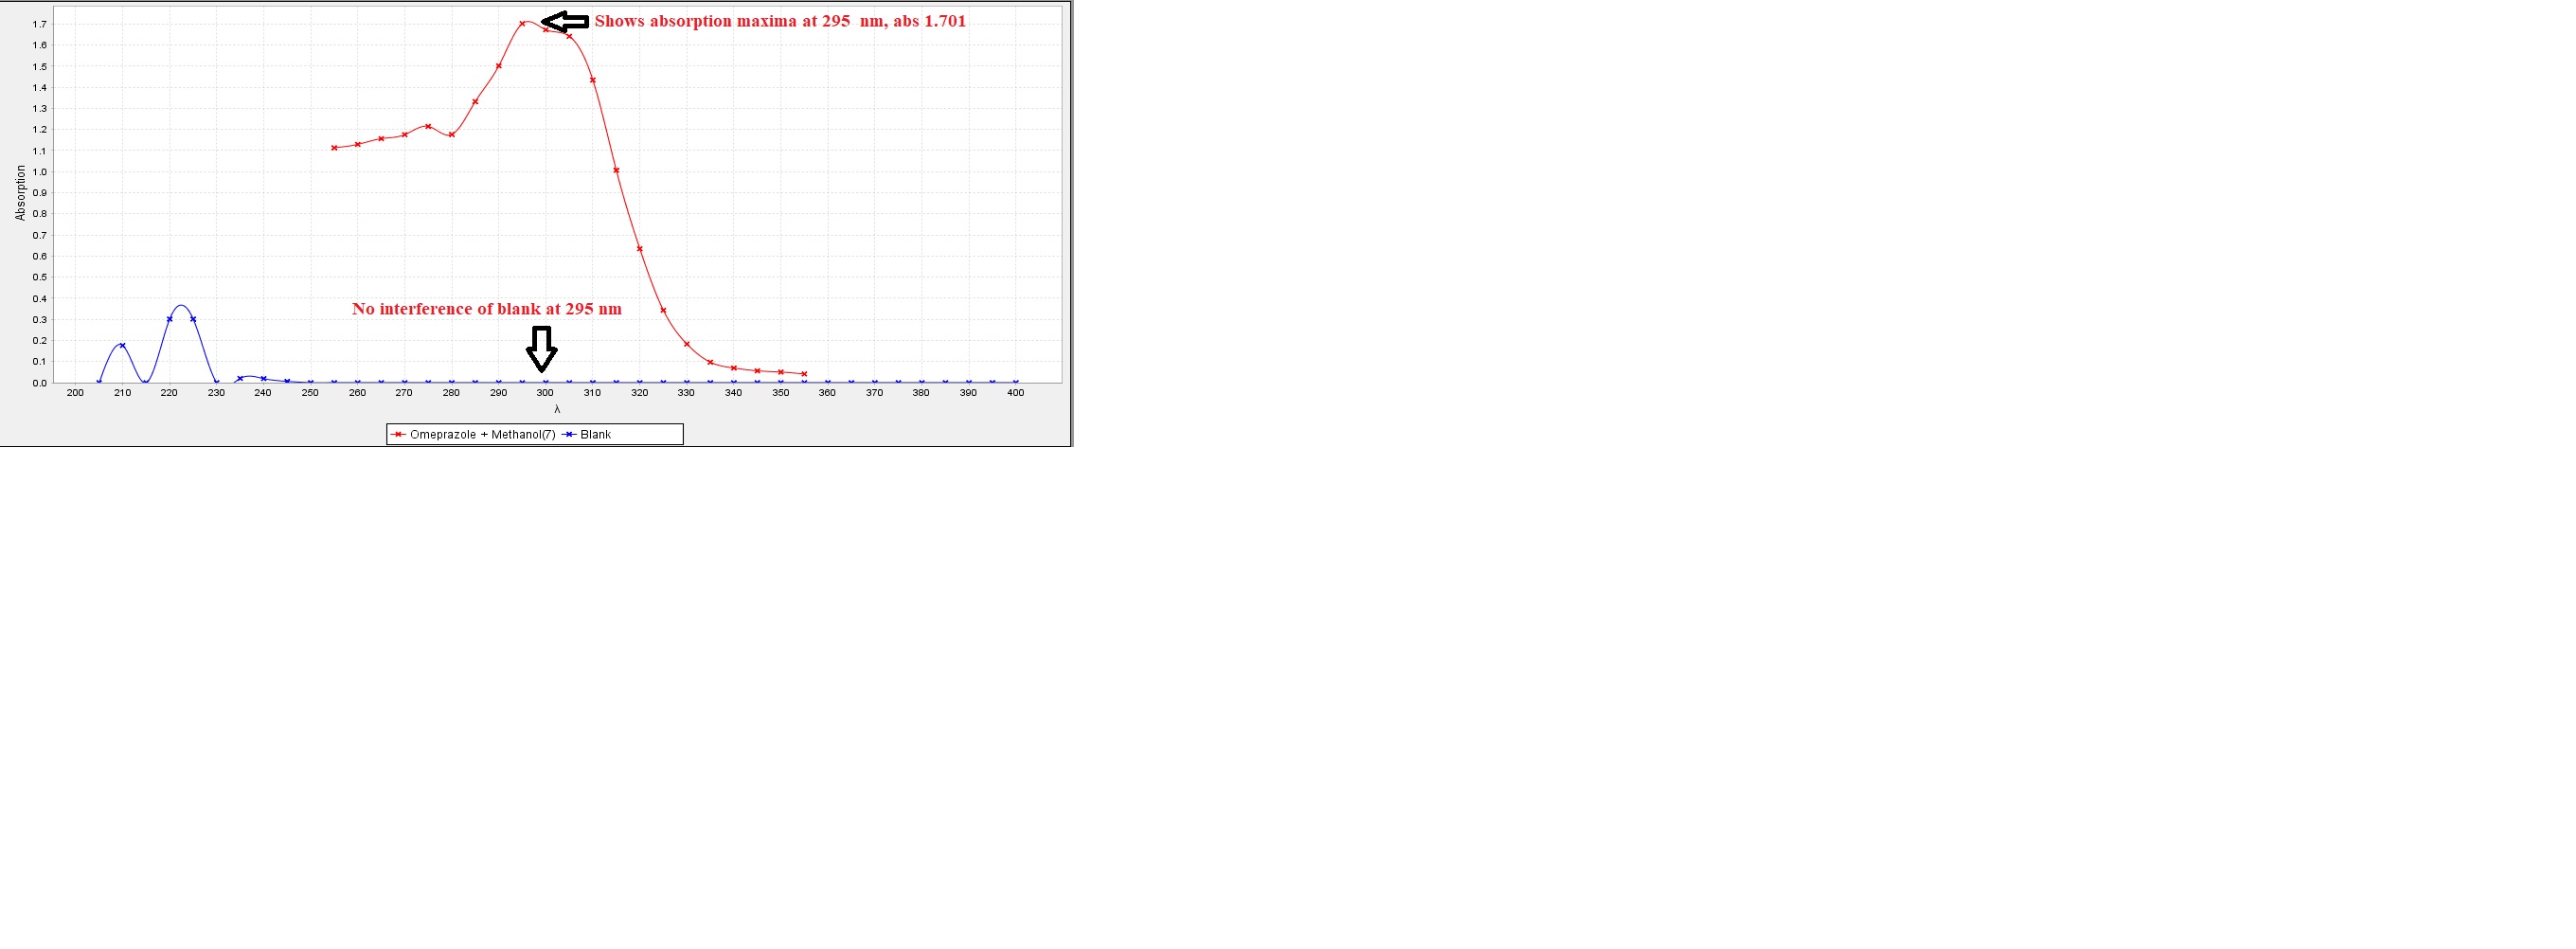
Figure No. 1: Spectrometric analysis of Omeprazole in Methanol
Standard Calibration curve
A precisely measured 10 mg dose of omeprazole was dissolved in a small amount of distilled water, and the volume was increased to 100 ml using the same solution (100 µg/ml). Subsequently, extract 0.5, 1, 1.5, 2, and 2.5 milliliters from the aforementioned solution into distinct 10-milliliter volumetric flasks, and adjust the volume to 10 milliliters to yield 1, 2, 3, 4, and 5 micrograms per milliliter, respectively. Additionally, absorbance measurements were made at 295 nm. In order to verify the calibration curve, this process was carried out three times.
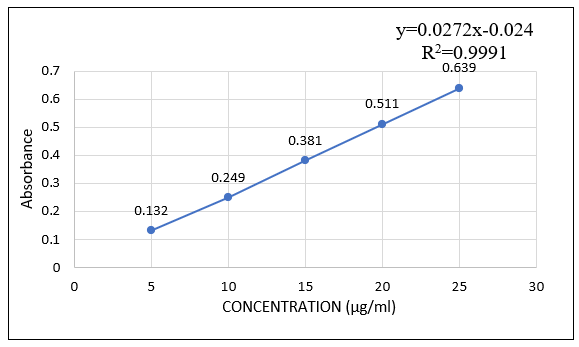
Figure No. 2: Calibration Curve of Omeprazole
Drug- excipient compatibility study
Infrared Spectroscopy: The FTIR spectra of pure drug and pure drug + excipient was taken and shown in figure 3.
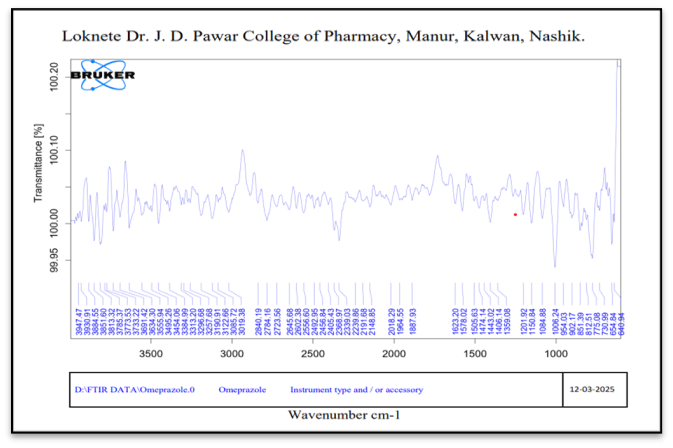
Figure No. 3: FTIR Spectrum of Pure Omeprazole
When comparing pure drug + excipient to pure drug, these spectra showed no discernible shift or alteration in the absorption peaks. It demonstrates that the medicine and excipients do not significantly interact.
Differential Scanning Calorimetry (DSC)
Figure 4 displays the results of the DSC thermograms of the pure medication and polymer, respectively
Figure No. 4: DSC Curve of Omeprazole
According to the DSC thermograms above, the melting point peak of the pure Omeprazole medication with all polymers is almost the same at 158.01 C. Consequently, it is discovered that the polymer blend does not exhibit a notable change in the DSC peak since there is no interaction with the medication, indicating satisfactory compatibility.
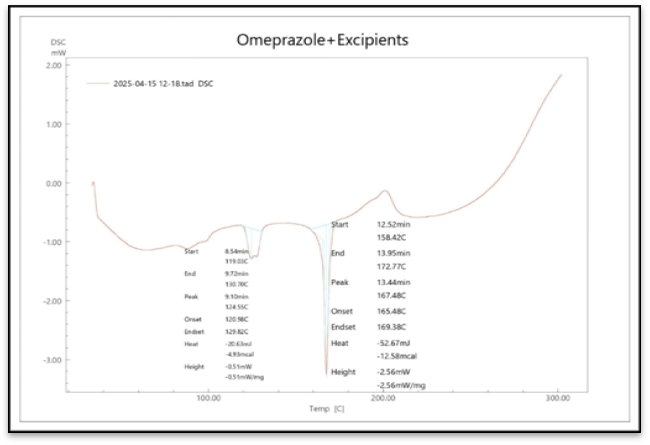
Figure No. 5: DSC Curve of Omeprazole – All Excipients
Table 3: Pre-Compression Parameters for the Formulations
|
Formulation Code |
Bulk density (g/ml) |
Tapped density (g/ml) |
Angle of repose (?) |
Compressibility index% |
Hausner's ratio |
|
F1 |
0.45±0.0125 |
0.50±0.0231 |
24.7±0.2645 |
13.72±0.00 |
1.15±0.0057 |
|
F2 |
0.44±0.0042 |
0.49±0.0099 |
20.3±0.3055 |
10±0.00 |
1.11±0.0115 |
|
F3 |
0.45±0.0090 |
0.50±0.0063 |
27.02±0.0723 |
13.46±0.07 |
1.15±0.0057 |
|
F4 |
0.47±0.0120 |
0.54±0.0217 |
28.3±0.2081 |
12.96±0.12 |
1.14±0.01 |
|
F5 |
0.45±0.0125 |
0.50±0.0107 |
20.8±0.2645 |
10±0.00 |
1.11±0.0115 |
|
F6 |
0.48±0.0134 |
0.55±0.0218 |
32.6±0.3464 |
16.36±0.00 |
1.19±0.0057 |
|
F7 |
0.46±0.0103 |
0.53±0.0214 |
24.2±0.4932 |
13.20±0.12 |
1.15±0.0057 |
|
F8 |
0.44±0.0043 |
0.52±0.0213 |
22.7±0.2081 |
10.20±0.00 |
1.11±0.0115 |
All values are expressed as mean± SE, n=3.
Table 4: Post-Compression Parameters for the Formulations
|
Formulation code |
Weight variation |
Diameter (mm) |
Thickness (mm) |
Hardness (kg/cm2) |
Friability (%) |
Drug content (%w/w) |
|
F1 |
204.6±1.18 |
7.86±0.20 |
2.90±0.10 |
3.26±0.05 |
0.8±0.05 |
96.70±0.16 |
|
F2 |
205.15±1.59 |
7.73±0.32 |
2.9±0.17 |
3.36±0.11 |
0.8±0.15 |
98.52±0.26 |
|
F3 |
206.15±1.63 |
7.83±0.24 |
2.76±0.25 |
3.26±0.15 |
0.9±0.14 |
97.74±0.14 |
|
F4 |
207.10±1.61 |
7.96±0.20 |
2.80±0.10 |
3.36±0.15 |
0.9±0.13 |
98.78±0.25 |
|
F5 |
201.55±1.63 |
7.83±0.20 |
2.8±0.10 |
3.0±0.10 |
0.9±0.11 |
99.04±0.05 |
|
F6 |
205.10±1.48 |
7.80±0.45 |
3.0±0.10 |
3.4±0.10 |
0.8±0.09 |
97.48±0.16 |
|
F7 |
206.40±1.66 |
7.93±0.35 |
2.86±0.11 |
3.4±0.10 |
0.8±0.06 |
98.26±0.26 |
|
F8 |
207.15±1.53 |
7.76±0.30 |
2.96±0.05 |
3.4±0.10 |
0.9±0.10 |
98.78±0.25 |
Disintegration time
The in-vitro disintegration time of the tablets was evaluated using the USP disintegration test apparatus (Electro lab). All eight formulations showed disintegration times ranging from 12?±?1.8973 to 30?±?1.8973 seconds. Formulations containing Crospovidone and Croscarmellose sodium exhibited the fastest disintegration due to their swelling, burst effect, and rapid water absorption. An increase in sodium starch glycollate and Croscarmellose sodium content further reduced disintegration time. Wetting time, measured twice for each formulation, ranged from 11?±?1.4142 to 42?±?1.8973 seconds, correlating with water absorption efficiency.
Table 5: Post-Compression Parameters for the Formulations
|
Formulation code |
Disintegration time (sec) |
Wetting time (sec) |
Water absorption ratio (%) |
|
F1 |
20±2.000 |
25±3.2863 |
81.26±0.983 |
|
F2 |
15±1.4142 |
20±2.0000 |
90.28±3.982 |
|
F3 |
30±1.8973 |
17±1.4142 |
112.40±1.88 |
|
F4 |
19±1.4142 |
42±1.8973 |
78.45±5.92 |
|
F5 |
12±1.8973 |
11±1.4142 |
125.80±5.10 |
|
F6 |
25±3.2863 |
23±2.2803 |
96.66±1.41 |
|
F7 |
15±1.4142 |
26±2.0000 |
84.24±6.02 |
|
F8 |
22±1.4142 |
17±1.4142 |
96.66±5.40 |
All values are expressed as mean± SE, n=3
In Vitro Drug release study
The F8 formulation was used to conduct a follow-up drug release research in phosphate buffer PH6.8. For all formulations, the percent cumulative drug release ranged from 88.27±0.5352 to 99.24±0.1401%. The higher the concentration of super disintegrants, the higher the drug release. The maximum drug release, or 99.24%, was seen in the first 15 minutes with F5 formulations.
Table 6: Percentage of Drug Release of Omeprazole Formulations MDTs.
|
Time (min) |
Formulation code (Drug Release %) |
||||||||
|
F1 |
F2 |
F3 |
F4 |
F5 |
F6 |
F7 |
F8 |
|
|
|
0 |
0.00 |
0.00 |
0.00 |
0.00 |
0.00 |
0.00 |
0.00 |
0.00 |
|
|
3 |
70.25± 1.0727 |
76.9± 1.2227 |
70.45± 1.1015 |
83.7± 0.0305 |
85.5± 0.1228 |
72.45± 0.1285 |
76.55± 0.3821 |
72.25± 1.1149 |
|
|
6 |
72.49± 0.1285 |
83.72± 0.0305 |
76.44± 1.3030 |
85.46± 0.1228 |
90.07± 0.1216 |
78.75± 1.1832 |
81.12± 1.4953 |
80.95± 1.2989 |
|
|
9 |
77.15± 1.1832 |
86.31± 0.8357 |
87.87± 0.6992 |
89.92± 1.3308 |
93.45± 0.2523 |
83.76± 0.2663 |
84.45± 1.0001 |
83.28± 0.5881 |
|
|
12 |
85.27± 0.5538 |
90.29± 0.1216 |
88.93± 0.8304 |
93.74± 0.1450 |
97.41± 1.1328 |
87.61± 0.2165 |
89.91± 1.2189 |
87.44± 0.4384 |
|
|
15 |
88.27± 0.5352 |
94.26± 0.4079 |
90.09± 0.7794 |
96.14± 1.1714 |
99.24± 0.1401 |
91.43± 2.0351 |
93.94± 1.9813 |
93.59± 0.2523 |
|
All values are expressed as mean± SE, n=3.
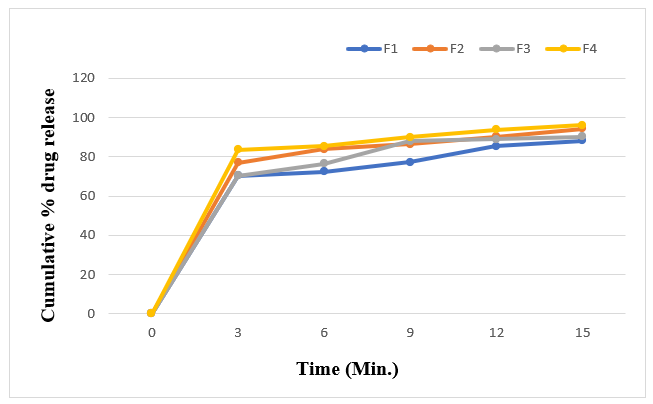
Figure 6: Cumulative % drug release profile of formulation F1-F4.
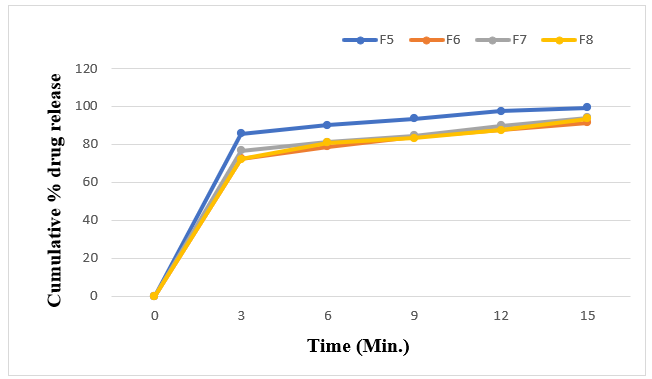
Figure 7: Cumulative % drug release profile of formulation F5-F8
Statistical Data
A polynomial equation was derived to examine the effects of independent variables on the responses, such as the percentage of drug release and the disintegration time, in order to examine the influence of three components using a complete factorial design. Regression equations are used to draw conclusions about the findings after taking into account the magnitude of the coefficient, and the sign of the coefficient shows the type of response. In a polynomial equation, a positive sign indicates that the reaction rises as the value does, whereas a negative sign indicates that the response falls as the value rises.
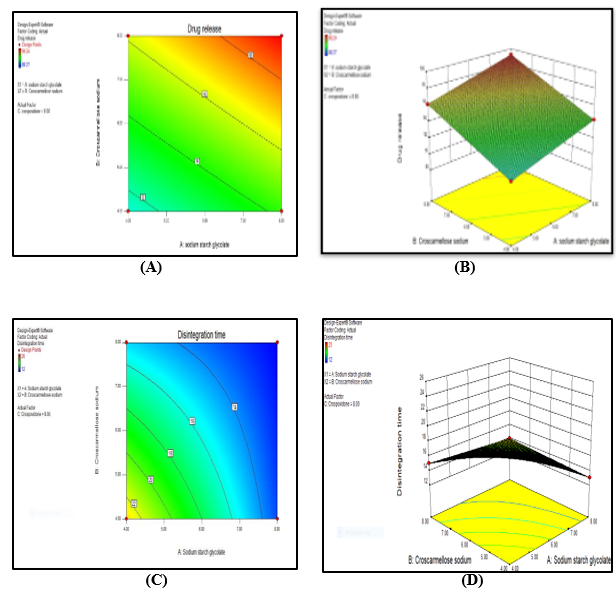
Figure No. 8: (A): Contour plot (B): 3D Response Surface (C): Contour plot (D): 3D Response Surface Plot
Effect of independent factors on % drug release (Y1)
+93.31+1.82*A+1.42*B+1.96*C- 0.21*A* B-0.34*A* C+1.00* B * C+0.28*A*B*C is the drug release. This polynomial equation showed that the independent variables crospovidone, SSG, and croscarmellose sodium—had a favourable impact on drug release.
3D Response Surface Plot:
Crospovidone, SSG, and Croscarmellose Sodium's effects on the drug release time of Omeprazole were verified using a 3D response surface plot. The figure-response curve of Y1 (drug release) shows that drug release increases considerably as the concentration of Croscarmellose sodium rises from 4 mg to 8 mg, SSG rises from 4 mg to 8 mg, and Crospovidone rises from 4 mg to 8 mg.
Effect of independent factors on disintegration time (Y2)
+19.75-3.75* A-0.75* B-2.00*C-1.75%A* B-0.50*A*C-1.50*B* C+2.50 * A*B*C is the disintegration time. The independent variables, crospovidone, SSG, and croscarmellose sodium, were found to have a negative impact on disintegration time based on this polynomial equation.
3D Response Surface Plot
Croscarmellose sodium concentration rises from 4 mg to 8 mg, SSG rises from 4 mg to 8 mg, and Crospovidone rises from 4 mg to 8 mg, according to the Curve of Y2 (Disintegration Time). Figure illustrates the considerable decrease in disintegration time. The statistical model indicates that the eighth run is an optimal formulation. The analysis of the optimised batch's reaction, or drug release rate of 99.24% and disintegration time of 12 seconds.
Stability Studies
Research for MDTs Omeprazole tablet formulation F5, which is optimised at 40°C ± 2°C/75% RH ± 5%.
|
Sr. No |
Observation |
Before Stability |
15 Days |
1 Month |
|
1 |
Appearance |
Pink |
Pink |
Pink |
|
2 |
Disintegration Time (sec) |
12 ±1.8973 |
11.80 ±1.632 |
11.65 ±0.632 |
|
3 |
Dissolution Time |
99.24 ± 0.1401 |
99.20 ±0.1311 |
98.52 ±0.041 |
|
4 |
Drug Content |
99.04 ± 0.032 |
99.02 ±0.011 |
98.95±0.080 |
The stability studies of Omeprazole Mouth Dissolving Tablets (formulation F5) conducted at 40°C ± 2°C / 75% RH ± 5% over 1 month demonstrated good physical and chemical stability. The tablet retained its pink appearance throughout the study, with only a slight decrease in disintegration time from 12 ± 1.8973 sec to 11.65 ± 0.632 sec. Dissolution remained high, slightly reducing from 99.24 ± 0.1401% to 98.52 ± 0.041%, while drug content showed minimal variation from 99.04 ± 0.032% to 98.95 ± 0.080%. These results indicate that the formulation remains stable and effective under accelerated conditions, ensuring its suitability for long-term storage.
CONCLUSION
Using a sensory approach and the Direct Compression method, omeprazole mouth dissolving tablets may be effectively made using a variety of superdisintegrants, diluents, and taste-inhibiting substances. A preformulation research using DSC and FTIR revealed no discernible differences between Omeprazole and the excipients. Formulation F5, which had high concentrations of sodium starch glycolate, croscarmellose sodium, and crosspovidone, showed encouraging results. With its maximum in-vitro drug release, lowest disintegration time, and best water absorption and hydration capacity, this formulation offers rapid beginning of action and instant relief from duodenal ulcers and heartburn. They also had a pleasing mouthfeel. All of the tablet assessment criteria for the mouth-dispersing drug delivery system were met by this formulation. As a result, the F5 Formulation was found to be optimal. formulating between F1 and F8.
REFERENCES


Khairnar Darshan*, Dr. Surawase Rajendra, Formulation Development and Characterization of Mouth Dissolving Tablet Containing Omeprazole, Int. J. of Pharm. Sci., 2025, Vol 3, Issue 7, 1747-1757. https://doi.org/10.5281/zenodo.15877943
 10.5281/zenodo.15877943
