Abstract
Gastroretentive floating tablets of clopidogrel bisulfate were prepared by direct compression method using HPMC K100M, Xanthan gum and mixture of other excipients. The drug content of tablets was found to be in between 100.08 0.92101.64 0.87 %. The in vitro dissolution studies of the prepared floating tablets were carried out on USP-I dissolution apparatus using Basket. It was observed that the formulations showed good linearity (r2 = 0.999) over the range of 0-30g/ml in 0.1N HCl. The IR spectra of drug and various polymers were recorded in combination with each other. The pH and solubility of the drug were determined by UV spectroscopy, IR, and differential scanning calorimetric. The formulations were found to obey Beer-Lambert's law over this range. Hence, the calibration curves of tablets obeyed Beer-lambert law. The calibration curve of tablets is found to conform to the Brewster's Law. The formulas showed higher correlation coefficient values between 0.920 and 0.997 than the other kinetic models. The results revealed that all formulations released the drug by zero-order kinetics by the Higuchi's Model. The development of multiple tablets as a biphasic drug delivery system for fenoverine, diltiazem hydrochloride, and atenolol from Floating Matrix Tablets, Formulation and In Vitro Evaluation.
Keywords
Bioavailability, Clopidogrel bisulfate, Therapeutic benefits, Release Kinetics, Floating tablets
Introduction
The oral route is considered as the most promising route of drug delivery. Effective oral drug delivery may depend upon the factors such as gastric emptying process, gastrointestinal transit time of dosage form, drug release from the dosage form and site of absorption of drugs. Most of the oral dosage forms possess several physiological limitations such as variable gastrointestinal transit, because of variable gastric emptying leading to non-uniform absorption profiles, incomplete drug release and shorter residence time of the dosage form in the stomach. The gastric emptying of dosage forms in humans is affected by several factors because of which wide inter and intrasubject variations are observed. Since many drugs are well absorbed in the upper part of the gastrointestinal tract, such high variability may lead to non-uniform absorption and makes the bioavailability unpredictable. Hence a beneficial delivery system would be one which possesses the ability to control and prolong the gastric emptying time and can deliver drugs in higher concentrations to the absorption site (i.e. upper part of the small intestine).[1] An oral drug delivery system providing a uniform drug delivery can only partly satisfy therapeutic and biopharmaceutical needs, as it doesn’t take into account the site specific absorption rates within the gastrointestinal tract, therefore there is need for developing delivery system that release the drug at the right time, at the specific site and with the desired rate.[1]It is an established fact that the conventional immediate release drug delivery systems when taken frequently in a day can maintain drug concentration levels in therapeutically effective range. However, this results in significant fluctuations in plasma drug levels.[1] Recently, several technical advancements have led to the development of various Novel Drug Delivery Systems (NDDS) that could revolutionize method of drug delivery and hence could provide definite therapeutic benefits.[1]

Figure 1. Hypothetical drug concentration profiles of multiple doses of an immediate release drug delivery system
Till date, man has found remedies for almost all diseases; but still research is going on in order to improve the existing therapy, i.e. NDDS with improved bioavailability. To formulate a drug or to reformulate it in a form of NDDS is not a herculean task if one goes methodically and skilfully. This is where the formulation development studies play an important role.[1] The most important objective for the development of controlled release dosage forms systems is to furnish an extended duration of action and thus assure greater patient compliance. Pharmacokinetically, it is often desirable to administer a single dose of medication, which release the active ingredient over an extended period of time rather than to administer a number of single doses at regular intervals.[2]
Anatomy
Anatomically the stomach is divided into 3 regions: fundus, body, and antrum (pylorus) had shown in figure 2. The proximal part made of fundus and body acts as a reservoir for undigested material, whereas the antrum is the main site for mixing motions and act as a pump for gastric emptying by propelling actions.[3]
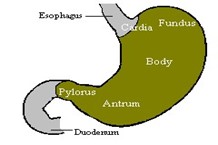
Figure 2 Anatomy and physiology of human stomach
Physiology
Factors such as pH, nature and volume of gastric secretions, and gastric mucosa play an important role in drug release and absorption. Environmental pH affects the performance of orally administered drugs. The pH of stomach in fasted condition is about 1.5 to 2, and in fed condition usually it is 2 to 6. A study conducted in male and female subjects in the Netherlands obtained surprising results. It was found that many subjects in this study had basal pH higher than 6 and many values were between 7 and 9. A large volume of water administered with an oral dosage form changes the pH of stomach to the pH of water initially. This change occurs because the stomach does not have enough time to produce a sufficient quantity of acid before emptying of liquid from the stomach. Thus, it does not improve dissolution of basic drugs. Basic drugs will have a better chance to dissolve in a fed condition rather than in fasted conditions. [3].
Gastrointestinal Transit Time [4]
Food content remains in each segment of the gastrointestinal tract for different periods of time. The resident time for both liquid and solid foods in each segment of the gastrointestinal tract is shown in Table 1.1.

Table 1 Transit time of food in each segment of the gastrointestinal tract
In the development of oral controlled drug delivery system, one of the main challenges is to modify the GI transit time. Gastric emptying of pharmaceuticals is highly variable and is dependent on the dosage form and the fed/fasted state of the stomach. The pattern of motility is however distinct in the 2 states. During the fasting state an interdigestive series of electrical events take place, which cycle both through stomach and intestine every 2 to 3 hours. In the fasted state the electrical activity in the stomach – the interdigestive myoelectric cycle or migrating myoelectric complex (MMC) governs the activity and, hence, the transit of dosage forms. It is characterized by four phases.

Figure 3 Gastrointestinal motility pattern.
Phase I (basal phase)
lasts from 40 to 60 minutes with rare contractions.
Phase II (pre-burst phase)
lasts for 40 to 60 minutes with intermittent action potential and contractions. As the phase progresses the intensity and frequency also increase gradually.
Phase III (burst phase)
lasts for 4 to 6 minutes. It includes intense and regular contractions for short period. It is due to this wave that all the undigested material is swept out of the stomach down to the small intestine. It is also known as the housekeeper wave.
Phase IV lasts
For 0 to 5 minutes and occurs between phases III and I of 2 consecutive cycles.
MATERIALS AND METHODS:
Materials
Clopidogrel bisulfate (Sun pharma, Ahmednagar), Xanthan gum (Glenmark Pvt, Ltd. Nasik), HPMC K4M (Glenmark Pvt, Ltd. Nashik), HPMC K100M (Glenmark Pvt, Ltd. Nashik), Sodium bicarbonate (Glenmark Pvt, Ltd. Nashik), Citric acid (anhydrous) (Glenmark Pvt, Ltd. Nashik), Magnesium Stearate (Research Lab, Mumbai), Talcum Powder (Vishal chem, Mumbai).
Instruments and Equipments
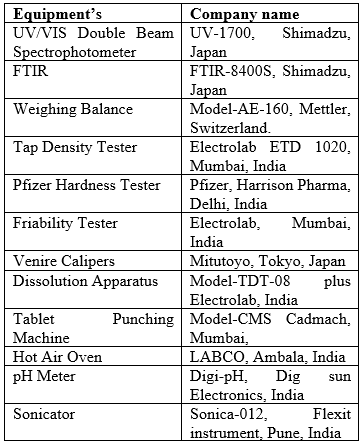
Table no 2. Equipment’s used with their model
Preformulation studies of clopidogrel bisulfate [38]
Characterization of clopidogrel bisulfate
1. Organoleptic properties
2. Determination of Melting point
3. Determination of pH and solubility
4. Spectroscopic characterization using
-UV- Visible Spectroscopy
-IR Spectroscopy
5. Determination of Thermal behaviour by DSC
1. Organoleptic properties
The colour and Odor of the drug were characterized and recorded using descriptive terminology.
2. Determination of Melting point
The melting point of Clopidogrel bisulfate was determined by melting point apparatus (Chemiline). The melting point was determined by introducing the small amount of substance in the capillary attached to graduated thermometer and constant heat was applied with the assembly suspended in the paraffin bath. The drug sample was tested in the temperature rang 0-3600C and point at which drug melts was noted.
3. Determination of pH and solubility
Drug is BCS Class-II drug having low solubility and high permeability. Clopidogrel bisulfate is Soluble in 0.1N HCL, sparingly soluble in methanol and practically insoluble in water.[13] The solubility of Clopidogrel bisulfate was determined by prepared saturated solution in various medium or solvent like water, 0.1 N HCL. The temperature was maintained at 37oC ± 0.5oC in water bath and continuously shaking in an orbit shaking incubator up to 24 hours. Withdrawal samples was filtered through Whatman filter paper and assayed by UV spectrophotometer at 220 nm.
4. Spectroscopic characterization using
A. Determination of ? max
For UV scanning for ? max of Clopidogrel bisulfate, about 20 mg of pure drug weighed and transferred to a 100ml volumetric flask and volume adjusted using 100 ml of 0.1 N HCl solutions and Sonicated until it gets completely dissolved & filtered by Vacuum filter. Then 12.5 ml of this solution was diluted to 100 ml with 0.1 N HCl in a volumetric flask to obtain a solution of 25µg/ml and scanned for ? max.
B. Calibration curve of Clopidogrel bisulfate in 0.1 N HCL at 220nm
A stock solution containing 300 µg/ml of Clopidogrel bisulfate in 0.1N HCl was prepared. Then suitable aliquots of stock solution (0.5-3ml) of Clopidogrel bisulfate were transferred into 10 ml volumetric flask and diluted with 30 ml 0.1 N HCl to get solution of different concentration of 5-30 µg/ml. The absorbance of all solutions was measured against 0.1N HCl as a blank at 220nm. Using this concentration-absorbance data, Beers-Lambert graph was plotted. This standard curve was used to estimate Clopidogrel bisulfate release from sustained release formulations in the dissolution fluid. The calibration curve was used for determination of drug content and percent cumulative drug release of Clopidogrel bisulfate from sustained release tablets.
C. Determination of IR Spectrum
FTIR spectrum of Clopidogrel bisulfate was observed using FTIR spectrometer Shimadzu in the scanning range 400-4000 cm-1. Spectrum was obtained to identify the peak as per official monograph.
5. Determination of Thermal behaviour by DSC
Clopidogrel bisulfate was assessed by carrying out thermal analysis. The inert atmosphere was maintained by purging nitrogen gas throughout the experiment. The sample (5mg) were carefully transferred and heated in a crimped aluminium pan for accurate results. The samples were heated from 300 C-2500C at the rate of 100C/min.
Characterization of Polymers
Polymers HPMC K100M, HPMC K4M and Xanthan gum used for the formulation were characterized for following parameters.
- Determination of Melting point
The melting point of HPMC K100M, Xanthan gum, and HPMC K4M was determined by melting point apparatus (Chemiline). The melting point was determined by introducing the small amount of substance in the capillary attached to graduated thermometer and constant heat was applied with the assembly suspended in the paraffin bath. The polymer sample was tested in the temperature rang 0-3600C and point at which drug melts decomposed was noted.
2. Micromeritic properties
A. Particle size
It is a fundamental physical characteristic that must be selected, monitored, and controlled from raw material to finished product to assure the desired performance. Correspondingly, much can be learned about processes by studying the sizes of particles that were produced by or involved in the process. No single sizing technique is ideal for all materials and applications. The most appropriate selection of instrumentation depends on many factors including the physical and chemical properties of the materials, their size ranges, the analytical throughput requirements, resolution, precision, and the environment in which the instrument is to be operated.
B. Bulk density
An accurately weighed quantity of Polymers, which was previously passed through sieve # 40 [USP] and carefully poured into graduated cylinder. Then after pouring the powder into the graduated cylinder the powder bed was made uniform without disturbing. Then the volume was measured directly from the graduation marks on the cylinder as mL. The volume measure was called as the bulk volume and the bulk density is calculated by following formula. (39)
Bulk density = Weight of polymer / Volume polymer……1)
C. Tapped density
After measuring the bulk volume, the same measuring cylinder was set into tap density apparatus. The tap density apparatus was set to 300 taps drop per minute and operated for 500 taps. Volume was noted as (Va) and again tapped for 750 times and volume was noted as (Vb). If the difference between Va and Vb not greater than 2% then Vb is consider as final tapped volume. The tapped density is calculated by the following formula. If the difference between Va and Vb is greater than 2%, So we go through tapping for 1250 times. (39)
Tapped density = Weight of polymer / Tapped volume of polymer … (2)
D. Carr’s compressibility index
It is one of the most important parameters to characterize the nature of polymer.
It can be calculated from the following equation- [39]
Carr’s Index = Tapped Density – Bulk Density / Tapped Density X 100…. (3)

Table - 3 Carr’s index table
E. Angle of repose
Angle of repose has been used to characterize the flow properties of solids. It is a characteristic related to inter particulate friction or resistance to movement between particles. This is the maximum angle possible between surface of pile of powder or granules and the horizontal plane. (39)
Tan ? = h/r……. (5)
Where,
? = angle of repose,
h = height of heap,
r = radius of base of heap circle.
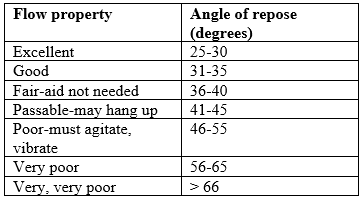
Table 4. Flow properties and corresponding angles of repose
A funnel was fixed at a height approximately 2-4 cm over the platform. The loose powder was slowly passed along the wall of funnel, till the tip of powder cone so formed just touched the tip of funnel stem. Angle of repose was then determined by measuring the height of the cone of powder and radius of the circular base of powder heap.[13]
COMPATIBILITY STUDIES
Fourier transforms infrared spectroscopic (FTIR)
Infrared spectra matching approach was used for the detection of any possible chemical reaction between the drug and the polymer. A physical mixture of drug and polymer was prepared and mixed with suitable quantity of potassium bromide. 1 mg of the sample was powdered and intimately mixed with 10 mg of dry powdered KBr. The powdered mixture was taken in a diffuse reflectance sampler and the spectrum was recorded by scanning in the wavelength region of 4000-400cm-1 in an FTIR spectrophotometer. The IR spectrum of the physical mixture was compared with those of pure drug and polymers and matching was done to detect any appearance or disappearance of peaks of drug-excipients interaction. [32]
FORMULATION & DEVELOPMENT CLOPIDOGREL BISULFATE FLOATING TABLET
Formulation of clopidogrel bisulfate floating tablet

Table - 5 Developed formulations of Clopidogrel bisulfate tablet
Role of Ingredients
The Clopidogrel bisulfate used as an antiplatelet agent. The HPMC K100M and xanthan gum was used as a Sustained release agent, viscosity increasing agents. The Sodium bicarbonate and citric acid was used as gas generating agents. The talc was used as a glidant. The magnesium stearate and starch were used as lubricating agents.
Proposed specification of tablet

Table 6 Specifications of tablets
Precompression studies
Bulk density
An accurately weighed quantity of powder, which was previously passed through sieve # 40 [USP] and carefully poured into graduated cylinder. Then after pouring the powder into the graduated cylinder the powder bed was made uniform without disturbing. Then the volume was measured directly from the graduation marks on the cylinder as mL. The volume measure was called as the bulk volume and the bulk density is calculated by following formula. [39]
Bulk density = Weight of blends / Volume of blend……… (1)
Tapped density
After measuring the bulk volume the same measuring cylinder was set into tap density apparatus. The tap density apparatus was set to 300 taps drop per minute and operated for 500 taps. Volume was noted as (Va) and again tapped for 750 times and volume was noted as (Vb). If the difference between Va and Vb not greater than 2% then Vb is consider as final tapped volume. The tapped density is calculated by the following formula. If the difference between Va and Vb is greater than 2%, So we go through tapping for 1250 times.[39]
Tapped density = Weight of blends /Tapped volume of blend…. (2)
Carr’s index
It is one of the most important parameters to characterize the nature of powders and granules. It can be calculated from the following equation- (39)
Carr’s Index = Tapped Density – Bulk Density / Tapped Density X 100…. (3)

Table – 7 Carr’s index table
Hausner’s ratio
Hausner’s ratio is an important character to determine the flow property of powder blends. This can be calculation by the following formula-
Value < 1>
While > 1.50 indicate poor flow
Between 1.25 and 1.5, adding Glidant will improve flow. The index of car’s is a one-point determination and does not reflect the ease or speed with which consolidation occur. Indeed, some materials have high index suggesting poor flow but may consolidate rapidly, which is essential for uniform filling on tablet machines when the power flows at nearly equal to bulk density in to the die and consolidates to approaching tapped density prior to compression.[49]
Hausner’s ratio = Tapped density / Bulk density……. (4)
Angle of repose
Angle of repose has been used to characterize the flow properties of solids. It is a characteristic related to inter particulate friction or resistance to movement between particles. This is the maximum angle possible between surface of pile of powder or granules and the horizontal plane. (39)
Tan = h/r……. (5)
Where, = angle of repose, h = height of heap, r = radius of base of heap circle

Table 8 Flow properties and corresponding angles of repose
A funnel was fixed at a height approximately 2-4 cm over the platform. The loose powder was slowly passed along the wall of funnel, till the tip of powder cone so formed just touched the tip of funnel stem. Angle of repose was then determined by measuring the height of the cone of powder and radius of the circular base of powder heap.[13]
Preparation of floating tablet of clopidogrel bisulfate
Clopidogrel bisulfate Tablet was prepared by direct compression method using variable concentrations of HPMC K100M and Xanthan gum. All ingredients were well dried before use at 400C for 12 hrs. Different tablets formulations were prepared by following process. Dry mixing of material, sifting: Clopidogrel bisulfate, HPMC K 4 M, HPMC K100M and Xanthan gum was sifted through sieve no 80#. Then Lactose was sifted through sieve no 100#. All ingredients were mixed properly. Sodium bicarbonate and citric acid anhydrous was sifted through sieve no100 #. Both were mixed well.
- Lubrication:
Talcum was added in to dry mixed blend. At last Magnesium stearate was sifted and mixed in to final blend.
- Compression:
Compression weight was should be 200 mg per tablet. Require punch Size was 7 mm.
EVALUATION OF CLOPIDOGREL BISULFATE FLOATING TABLETS
Weight variation test
Twenty tablets of the formulation were weighed using an electronic balance and the test was performed according to the official method. Twenty tablets were selected randomly from each batch and weighed individually to check for weight variation. The weight of 20 tablets should not deviate 2 % then average standard weight.[48]

Table - 9 Percentage deviation allowed under weight variation
Thickness
The thickness of the tablets was determined by using Vernier Callipers. Five tablets were used, and average values were calculated.[26]
Hardness
Hardness indicates the ability of a tablet to withstand mechanical shocks while handling. The hardness of the tablets was determined using Pfizer hardness tester. It is expressed in kg/cm2. Three tablets were randomly selected and hardness of the tablets was determined.[26]
Friability
The friability of tablets was determined using Roche Friabilator. It is expressed in percentage (%). Twenty tablets were initially weighed (W) and transferred into friabilator. The friabilator was operated at 25 rpm for 4 minutes or run up to 100 revolutions. The tablets were weighed again (W) and calculated the friability. % Friability of tablets less than 1% are considered acceptable.[44]
The percentage friability was measured using the formula
Where,
% F - friability in percentage
W - Initial weight of tablet
Wo -weight of tablets after revolution
Swelling index
The swelling index of tablets was determined n 0.1 N HCl (pH 1.2) at room temperature. The swollen weight of the tablets was determined at predefined time intervals. The swelling index was calculated by the following equation: [26]
Swelling index (%WU) = (Wt – W0) x 100 ……. (7)
W0
Where, Wt = Weight of tablet at time t.
W0 = Initial weight of tablet
Content uniformity
For this at least 30 tablets were randomly selected, out of 30 tablets 10 tablets were crushed into fine powder and assayed individually. The powdered tablet equivalent to 20 mg drug in one tablet was taken and transferred in dry 100 mL volumetric flask, to it added 20 mL of DMF and made the volume by DMF and shake. Sonicated for 15 min. the solution was filtered. 5 mL was pipetted out to 50 mL, made the volume by DMF. Measured the absorbance at about 220 nm using UV spectrophotometer, DMF was used as a blank.[34]
Buoyancy studies
The in vitro buoyancy was determined by floating lag time method described as the tablets were placed in 250 mL beaker containing 0.1 N HCl (pH 1.2). The time required for the tablets to rise to the surface and float was determined as floating lag time. The time between introduction of dosage form and its buoyancy in 0.1 N HCl and the time during which the dosage form remain buoyant were measured. The time taken for dosage form to emerge on surface of medium called floating lag time (FLT) or Buoyancy Lag Time (BLT) and total duration of time by which dosage form remain buoyant is called total floating time (TFT). [34]
In vitro dissolution studies of tablets
In Vitro dissolution studies of the prepared floating tablets of clopidogrel bisulfate were carried out on USP-I dissolution apparatus using Basket. The dissolution study of all the prepared tablets was carried in 900 mL 0.1 N HCl (pH 1.2) at 100 rpm. Withdrawal of sample was up to 5 mL. Checked the absorbance at 220 nm and calculate the percent (%) drug release at different time intervals. Cumulative percentage of drug release was calculated using the equation obtained from a standard curve. [34
RESULTS AND DISCUSSION:
Preformulation Studies
Characterization of Clopidogrel bisulfate:
The characterization of drug was done by the melting point, pH, and solubility, UV spectroscopy, IR spectroscopy and differential scanning calorimetric.
Organoleptic properties:

Table No 10 Organoleptic properties of Clopidogrel bisulfate
Melting point determination:

Table No. 11 Standard and practical Melting point of Clopidogrel bisulfate
pH study and solubility
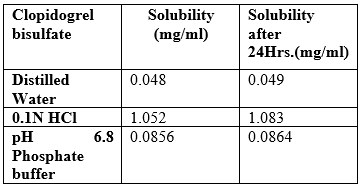
Table No 12 Solubility study of Clopidogrel bisulfate at room temperature
Complies as per IP. Clopidogrel bisulfate was found to be freely soluble in 0.1 N HCl.
Spectroscopic characterization of drug
UV- visible Spectroscopic characterization:
The UV spectrum of Clopidogrel bisulfate (20µg/ml) in 0.1N HCl is shown in figure no. 8.4, the wavelength of maximum absorption (? max) was found at 220 nm and 272 nm.

Table No.13. ? max value of Clopidogrel bisulfate in 0.1N HCl
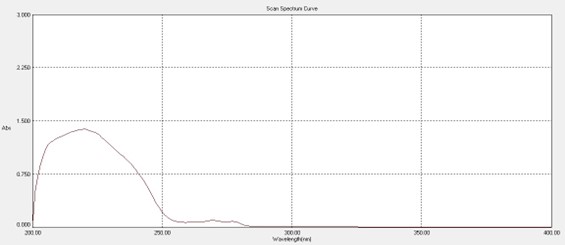
Figure No. 4 UV spectrum of Clopidogrel bisulfate in 0.1N HCl
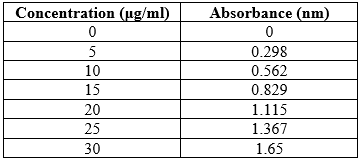
Table No. 14 Calibration curve data of Clopidogrel bisulfate in 0.1N HCl

Figure No. 5 Standard calibration curve of Clopidogrel bisulfate in 0.1N HCl
Calibration curves of Clopidogrel bisulfate:
The UV absorption data at the wavelength 220 nm (in 0.1N HCl) is shown in Table No.8.1. It was observed that Clopidogrel bisulfate showed good linearity (r2 = 0.999) over the range of 0-30µg/ml in 0.1N HCl (Table No.8.5). Hence, calibration curves of Clopidogrel bisulfate were found to obey Beer-Lambert’s law over this range. (Fig.no.3.2)
Determination of IR spectrum:
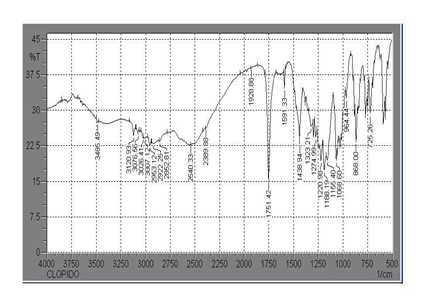
Fig No. 6 IR spectra of Clopidogrel bisulfate drug

Table No. 15 Characteristic peak of Clopidogrel bisulfate
The IR Spectrum of Clopidogrel bisulfate reveals the presence of major functional group in the structure of Clopidogrel bisulfate supporting its identity (Figure.no.3.3, Table No.3.6).
Determination of thermal behaviour by differential scanning calorimetry (DSC):

Figure No. 7 DSC curve of pure Clopidogrel bisulfate
This DSC graph is showing the hygroscopic peak and the graph also shows a onset point is 166.89 °C and end set point is 176.29 °C. This is a graph that shows sharp peak at 173.62 °C that means the drug is confirmed clopidogrel bisulfate because it compares with standard is 173 °C.
Characterization of Polymers
Here Results of identification tests of, HPMC K100M, HPMC K4M and Xanthan gum were compared with the reported standards as given in Table 3.7. The results obtained were found to be matched with the reference values.

Table No.17 Determination of melting point
COMPATIBILITY STUDIES
FTIR Studies:
The IR spectra of drug and various polymers were recorded in combination with each other. The results are presented in Fig. no.3.5.
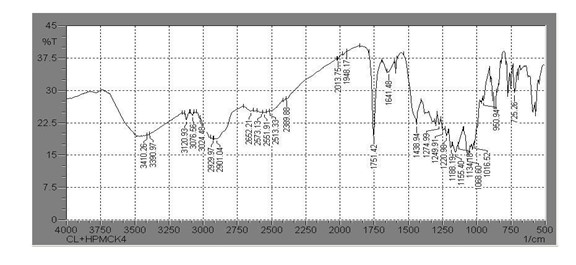
Figure No. 8 IR spectra of Clopidogrel bisulfate and HPMC K4M

Table No. 18 Characteristic peaks of clopidogrel bisulfate and HPMC K4M
The IR Spectra of Clopidogrel bisulfate and the polymer HPMC K4M revealed the major functional groups of Clopidogrel bisulfate hence there was no probable interaction between drug and polymers.

Figure No. 9 IR Spectra of Clopidogrel bisulfate and HPMC K100M
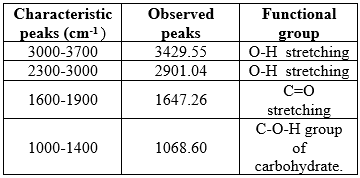
Table No. 19 Characteristic peaks of Clopidogrel bisulfate and HPMC K100M
The IR Spectra of Clopidogrel bisulfate and the polymer HPMC K100M revealed the major functional groups of Clopidogrel bisulfate hence there was no probable interaction between drug and polymers.

Figure No.10 IR spectra of Clopidogrel bisulfate and Xanthan gum
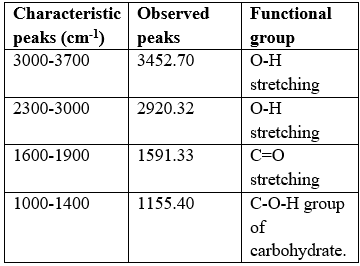
Table No. 20 Characteristic peaks of Clopidogrel bisulfate and Xanthan gum
The IR Spectra of Clopidogrel bisulfate and the polymer Xanthan gum revealed the major functional groups of Clopidogrel bisulfate hence there was no probable interaction between drug and polymers.

Figure No. 11 FTIR spectra of formulation blend optimized batch F3

Figure No. 12 FTIR spectra of formulation blend optimized batch F4
Clopidogrel bisulfate showed prominent peaks at 1651, 2943, 3354, 1529 and 1689 due to the presence of C-X aliphatic group, C-H2 aliphatic, N-H stretching of NH2, C-H aliphatic and C=O stretching. The same peaks were also observed in the formulation blend indicating the stable nature of the drug.
MICROMERTICS PROPERTIES

Table No. 21 Pre-compression parameters of polymers
As per table no. 2.5 the concentration of drug and excipients was used in the formulation was clopidogrel bisulfate was used as 49 %, HPMC K4M 10% (F1 to F8 formulation batches ), the variable HPMC K100M was 5, 10, 15, 20% (F1 to F4 formulation batches), and the xanthan gum is also used as variable as 5, 10, 15, 20% (F5 to F8 formulation batches), the sodium bicarbonate and citric acid was 10 and 7.5 % (F1 to F8 formulation batches) respectively, then talcum 1% (F1 to F8 formulation batches), magnesium stearate was 1.5 % (F1 to F8 formulation batches), and the starch was used 17,11,6,1 % concentrations (F1 to F4 formulation batches) and 17,11,6,1% concentrations (F5 to F8 formulation batches) respectively used.
Pre-compression Parameters:

Table No.22 Pre-compression parameters of tablet blends
n=3, Average ±S.D.
Angle of repose:
Table No.3.13 shows the results obtained for all the formulations. The values were found to be in the range of 27.11 to 29.60. All the formulations shows angle of repose bellow 300 which indicates good flow property of the tablet blends.
Bulk density and tapped density:
The tablet blends were evaluated for the bulk density and tapped density the results are shown in Table No.3.13. The bulk density and tapped density for all the formulations varied from 0.40 to 0.41 g cm-3 and 0.43 to 0.49 g cm-3 respectively. The values obtained lies within the acceptable range and not a large difference exist between bulk density and tapped density. This result helps in calculating % compressibility of powder blend.
Carr’s Compressibility index:
The percentage compressibility of powder blend determined using Carr’s compressibility index. Carr’s index lies within the range of 12.52 to 15.94 %. All the formulations show good flow property. The results are shown in Table No.3.13.
Hausner Ratio: Hausner Ratio was found to be in the range of 1.19 to 1.17 as shown in Table No.3.13.
EVALUATION OF CLOPIDOGREL BISULFATE FLOATING TABLET

Table No. 24 Evaluation of Clopidogrel bisulfate floating tablet
n=3, Average ±S.D.
Hardness test:
The mean values of hardness of tablets are shown in Table No.3.13. The hardness of all formulations is in the range of 7.7±0.071 to 8.0±0.148 kg/cm2. The values of standard deviation indicate that the hardness of all the formulations were almost uniform and possess good mechanical strength with sufficient hardness.
Thickness:
The thickness for formulated tablets was determined using vernier calliper and results are shown in Table No.3.13. Tablet mean thickness (n=10) were almost uniform in all formulations and values for tablets ranged from 3.15±0.031 to 3.17±0.021 mm. The standard deviation values indicated that all formulations were within the range and show uniform thickness.
Friability test:
The friability values of prepared tablets were given in Table No.8.13. The values ranged from 0.28 ± 0.025 to 0.60 ± 0.027 %. All values are below 1% indicating that the all formulations are having good compactness and showing enough resistance to the mechanical shock and abrasion.
Drug content:
The content uniformity was performed for all the formulations and results are shown in Table 8.13. The percent drug content of tablets was found to be in between 100.08± 0.92 to 101.64± 0.87 % of Clopidogrel bisulfate.
Weight variation test:
Twenty tablets were randomly selected from each formulation and evaluated. The average weight of each formulation was recorded and sown in Table 3.13. The values were almost uniform and lie within the USP specifications. All the tablets passed weight variation test as the % weight variation was within the Pharmacopeial limits (Less than 7.5% w/w).
Swelling index
Swelling increases as the time passes because the polymers gradually absorb water due to hydrophilicity of polymer. The outermost hydrophilic polymer hydrates and swells and a gel barrier are formed at the outer surface. As the gelatinous layer progressively dissolves and/or is dispersed, the hydration swelling release process is continuous towards new exposed surfaces, thus maintaining the integrity of the dosage form. HPMC K100M, Xanthan gum having good hydrophilicity because of that it shows maximum swelling. HPMC K100M shows good swelling in 1st hour but on time goes it swells slightly slowly. It retained high water because of lactose, which produce osmotic pressure. On increase the concentration of HPMC K100M the swelling percentage was increases. HPMC K100M, Xanthan gum having low hydrophilicity, it retarded the penetration of water. Therefore from 3rd hour the swelling of the tablet was goes slowly up to 5th hour.

Table No. 25 Swelling index of formulation batches
n = 3 Average ±SD
In vitro buoyancy studies
After immersion in 0.1N HCl solution at 37°C, the tablets floated, and remained buoyant without disintegration. This may be due to the nature of polymer and gas generating agent, which were kept constant in the present study. The generated gas is trapped and protected within the gel formed by hydration of HPMC, thus decreasing the density of tablet. The results are given in table 3.14.

Table No. 26 Lag time and mean floating time of different formulation batches
Ref: See the readings in research papers.
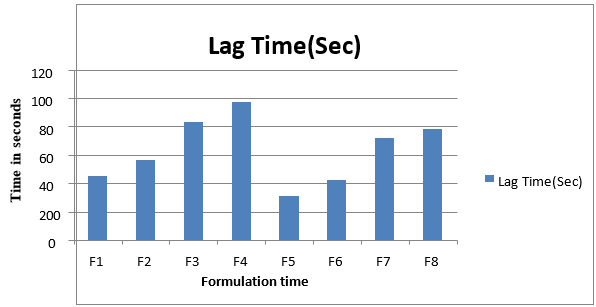
Figure No.13 Lag time and total floating time of different formulation batches
As the density of tablet falls below 1 the tablet becomes buoyant. The buoyancy lag times of the tablets were in between 45, 97, 72 and 78 seconds and total floating time was more than 12 hours for F3, F4, F7, and F8 respectively.

Figure No. 14 Swelling property and lag time of optimized batch F3
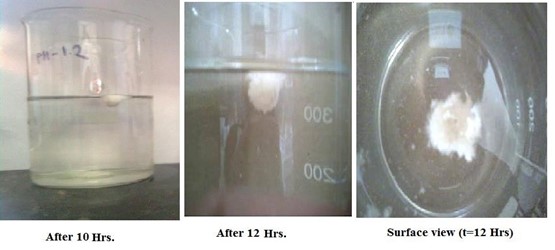
Figure No. 15 Swelling property and floating time of optimized batch up to 12 hr.
Dissolution study:

Table No.27 In-vitro% Cumulative Drug release study of Formulations (F1 to F4)
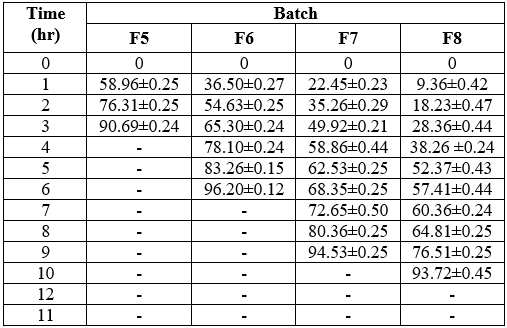
Table No.18 In-vitro% Cumulative Drug release study of Formulations (F5 to F8)

Table No 29 Dissolution time
In-vitro release study

Figure No. 16 Dissolution profiles of Clopidogrel bisulfate sustained release tablets (F1 to F8)
Curve Fitting Analysis for Different Formulations

Figure No. 17 Cumulative % drug release Vs Time (Zero order kinetics) of F4

Figure No. 18 log Cumulative % drug release Vs Square root of Time (Korsmeyer Peppas release Mechanism) of F4

Table No. 30 Values of rate constants (K) and Correlation coefficients (R) for release from Clopidogrel bisulfate solid dispersion tablets
The kinetic data of all formulations are shown in Table 8.19 and graphical representation in Fig 8.14, 8.15, 8.16 and 8.17. Different kinetic models (zero-order, first-order, Higuchi’s, Korsmeyer’s and Higuchi’s) were applied to interpret the release profile from formulation. When the data were plotted according to zero-order equation, the formulations showed higher correlation coefficient values between 0.920 to 0.997 than the other kinetic models. Hence, the results revealed that all the formulations release the drug by zero-order kinetics by the Higuchi’s Model. To ascertain, the drug release mechanism the invitro release data were also subjected to Higuchi’s diffusion plots and Peppas plots and the correlation coefficient values were in the range of 0.916 to 0.997 and 0.936 to 0.999 respectively. So, it confirms that, the calculated r values for Higuchi plot and Peppas plots were nearer to one (1) in all the cases suggesting that drug released by diffusion mechanism. The value of n indicates the drug release mechanism related to the geometrical shape of the delivery system, if the exponent n = 0.5, then the drug release mechanism is Fickian diffusion. If n < 0>= 1.0 mechanism is non-Fickanian case ?? diffusion, n > 1.0 mechanism is nonFickanian super case ??. In the present study the mean diffusional exponent values (n) ranged from 0.62 to 1.49 indicating that all these formulations presented a dissolution behaviour controlled by Fickian diffusion. The dissolution data for tablets F1 to F8 was fitted to drug release kinetic models like Zero order. The model that gives high ‘R’ value is considered as the best fit model for the release data.
CONCLUSION:
The study conducted so far on “Formulation, development and evaluation of gastroretentive floating tablets of Clopidogrel bisulfate” reveals following conclusion: Clopidogrel bisulfate floating tablet can be prepared successfully containing HPMC K100M, Xanthan gum and mixture of other excipients by direct compression method. The FTIR and DSC study confirmed that no chemical interaction took place during tablet formulation process. Swelling studies was indicated significant water uptake. It was contributed in drug release and was give gastric retention significantly. Proper equilibrium between swelling and gel nature of the polymer helps tablet to maintain its integrity and total floating time. The floating of the optimized batch was found to have about > than 12 hours. Formulation F1-F4 contains HPMC K100M in varying concentration 5-20%. As concentration of HPMC K100M increased in the formulation F1 to F4 swelling index, lag time for floating was found to be increased. Above 15 % w/w concentration of HPMC K100M, Floating time was found be greater than 12 hrs. Formulation F5-F8 contains Xanthan gum in varying concentration 5-20%. As concentration of Xanthan gum increased in the formulation F5 to F8 swelling index, lag time for floating was found to be increased. Above 15 % w/w concentration of Xanthan gum, Floating time was found be greater than 12 hrs. Formulation F4 shows better sustained release, floating time (greater than 12hrs), early T50 along with T90 after 11hrs. It was selected as the best sustained release floating tablet formulation of clopidogrel bisulfate. Formulation F4 follows zero order kinetics followed by Higuchi matrix and mechanism of drug release was non-Fickian (n=0.5-1.0) diffusion.
CONFLICT OF INTEREST:
The authors declare that they have no known competing financial interests or personal relationships that could have appeared to influence the work reported in this paper.
FUNDING:
This research did not receive any specific grant from funding agencies in the public, commercial, or not-for-profit sectors.
ACKNOWLEDGEMENT:
The authors wish to acknowledge the help provided by the technical and support staff of KCT’s R. G. Sapkal College of Pharmacy, Nashik.
REFERENCES
- Chien YW. Novel Drug Delivery System: Marcel Dekker, New York 1992; 50(2):139196.
- Biopharmaceutics and Pharmacokinetics. Vallabh Prakashan 1995; 1:347- 352.
- Waugh A, Grant A. Ross and Wilson. Anatomy and Physiology in Health and Illness, Churchill Livingstone 2005; 9:74-78.
- Nayak AK, Maji R, Das B. Gastroretentive Drug Delivery Systems: A review. Asi J Pharm and Clin Res 2010;3: 02-10.
- Sharma N, Agrawal DA. Comprehensive Review on Floating Drug Delivery System. Int J of Res in pharmaceutical and biomedical science 2011; 2(2): 428-441.
- Sharma N, Agarwal D, Gupta MK, Khinchi M. A Comprehensive Review on Floating Drug Delivery System. Int J Res Pharm Biomedi Sci 2011; 2(2): 428-441.
- Mishra A, Gupta P. A Review on Gastro retentive Drug Delivery System, Int. J. Drug Dev. & Res 2012; 4(4):28-39.
- Sheth NS, Mistry RB. Formulation and Evaluation of Floating Drug Delivery System. Int J Pharm and Bio Sci 2011; 2: 571 – 580.
- Vinod KR, Vasa S. Review on: Approaches for Gastroretentive Drug Delivery Systems. Int J of Applied Biology and Pharmaceutical Technology 2010; 1(2):589-600.
- Oth M, Franz M, Timmermans J. The Bilayer Floating Capsule: A Stomach-Directed Drug Delivery System for Misoprostol. Pharm Res 1992; 9(3): 298-302.
- Chaturvedi S, Prabha K. A Review: Approaches to increase the gastric residence time: Floating drug delivery system. Asian journal of pharmaceutical and clinical research 2013; 6(3):1-9.
- Surana AS, Kotecha RK. An overview on various approaches to Oral Controlled Drug Delivery System Via Gastroretention. Int J. Pharm Sci Rev Res 2010;2: 68-72.
- Sing BN, Kim KH. Floating Drug Delivery Systems: An approach to Oral Controlled Drug Delivery Via Gastric retention. J Control Release 2000; 63(3): 235-59.
- Badoni A, Ojha A. Review on Gastro retentive Drug Delivery System. The pharma journal 2012; 1(8):32-42.
- Samyuktha RB, Vedha Hari BN, Brahma RA, Punitha S, Parimala D, Victor R. The Recent Developments on Gastric Floating Drug Delivery Systems: An Overview. Int J Pharmtech Res 2010; 2(1): 524-534.
- Mayavanshi AV, Gajjar SS. Floating Drug Delivery Systems to Increase Gastric retention of Drugs. Res J Pharm. Tech 2008; 1(4): 345-348.
- Dolas RT, Hosmani A, Bhandari A, Kumar B, Somvanshi S. Novel Sustained Release Gastro Retentive Drug Delivery System: A Review. Int J Pharm Res Dev 2004; 2 (11):26-41.
- Vyas SP, Khar RK. Controlled Drug Delivery Concepts and Advances. Vallabh Prakashan, Delhi 2002; (1):257-261.
- Jain NK. Controlled and Novel Drug Delivery. CBS Publishers and Distributors. New Delhi 2004; 1(2):676-698.
- Banker GS, Rhodes CT. Modern Pharmaceutics. Marcel Dekker 2004;4 (121):501-573.
- http://www.drugbank.ca/drugs/DB00758.
- Martindale. The Complete Drug Reference. Pharmaceutical press 2006; (35):108.
- Rowe RC, Sheskey PJ, Owen SC. Hand Book of Pharmaceutical Excipients. Pharmaceutical Press 2006 ;(5):346, 385, 767, 430.
- Rama K, Koteswara R, Rajyalakshmi K. Design, Development and Evaluation of Clopidogrel Bisulphate Floating Tablets. International journal of pharmaceutical investigation, 2010; 5(9):112-126.
- Syeda BY, Karuppasamy C. Method Development and Validation of Spectrophotometric Method for The Estimation of Clopidogrel Bisulphate in Pure and Tablet Dosage Form, International Journal of Research in Pharmaceutical and Nano Sciences 2013;2(3): 365 - 370.
- Thulasiramaraju TV, Reddy RS. Preparation and In vitro Evaluation of Famotidine Floating Tablets By Using Different Hydrophilic Polymers. International Journal of Research in Pharmaceutical and Nano Sciences 2013; 2(3): 382 - 393.
- Doodipala N, Reddy CP. Development of Gastroretentive Floating Matrix Tablets of Cefixime trihydrate: In vitro and In vivo Evaluation. Journal of Pharmacy Research, 2011; 4(11): 3997-4000.
- Chandra SY, Jagannathan K. Floating and Sticking Tablets of Clopidogrel Bisulphate. An International Journal of Advances In Pharmaceutical Science 2011; 2 (4):378-384.
- Bomma R, Naidu RA. Development and Evaluation of Gastroretentive Norfloxacin Floating Tablets. Acta Pharm 2009; 59: 211–221.
- Indhumathi D, Damodharan N. Development and Evaluation of Verapamil Hydrochloride Floating Matrix Tablets Based On Gas Forming Agent. JAPS 2011;1(1): 13-21.
- Ramkanth S, Alagusundaram M. Formulation and Characterization of Floating Tablets of Diltiazem Hydrochloride. Journal of Pharmacy Research 2010; 3(6),1263-1267.
- Shinde. AJ, Waghule AN. Formulation and In vitro Evaluation Of Sustained Release Floating Tablet Of Cephalexin Using Hydrophilic Polymers.Int. J Pharmacy Pharm Sci.2010;2(2):58-65.
- Bandari S, Eaga CM. Formulation and Evaluation of Multiple Tablets As A Biphasic Gastroretentive Floating Drug Delivery System For Fenoverine. Acta Pharm 2010; 60: 89–97.
- Rao KR, Rajyalakshmi K. Design, Development and Evaluation of Clopidogrel Bisulphate Floating Tablets. International journal of pharmaceutical investigation 2014; 4(1):19-26.
- Gambhire MN, Kshitij W, Ambade. Development and In Vitro Evaluation of an Oral Floating Matrix Tablet Formulation of Diltiazem Hydrochloride. AAPS Pharm Sci Tech 2007; 8 (3); E2-E9.
- Arunachalam A, Stephen B, Rathinaraj. Design and Evaluation of Levofloxacin Hemihydrate Floating Tablet. International Journal of Applied Biology and Pharmaceutical Technology 2010; 1(2): 260-268.
- Srivastava AK, Wadhwa S. Oral Sustained Delivery of Atenolol from Floating Matrix Tablets, Formulation and In Vitro Evaluation. Drug Development and Industrial Pharmacy 2005; 31:367–374.
- Government of India Ministry of Health & Family Welfare. The Indian Pharmacopoeia. The Indian Pharmacopoeia Commission Ghaziabad, New Delhi 2010; 2336.
- Lieberman HA, Lachman L. The Theory and Practice of Industrial Pharmacy. Varghese Publication House 1990 ;(3)171, 293.
- Arunachalam A, Stephen B, Rathinaraj. Design and Evaluation of Levofloxacin Hemihydrate Floating Tablet. International Journal of Applied Biology and Pharmaceutical Technology 2012; 1(2): 110-135.
- Cuine A, Barochez BH, Guez D. Matrix Tablet Permitting the Sustained Release of Indapamide after Oral Administration. 1994; US Patent: Patent No. 5334392.
- ICH Topic Q 1 A (R2) Stability Testing of new Drug Substances and Products. Note for guidance on stability testing: Stability testing of new drug substances and products (CPMP/ICH/2736/99). Eur Medi Age.1-20.
- ICH Topic Q 8 (R2) Pharmaceutical development (2009). Note for Guidance on Pharmaceutical Developments (EMEA/CHMP167068/2004). Eur Medi Age. 1-25.
- Kumar R, Patil MB. Formulation and Evaluation of Effervescent Floating Tablet of Famotidine. Int J Pharmtech Res Coden 2009; 1(3): 754-763.
- Lodhiya DJ, Mukherjee DJ. Gastroretantive System of Atenolol using HPMC K15. Int J Pharmtech Res Coden. 2009; 1(4): 1616-1620.
- Patil JM, Hirlekar RS, Gide PS, Kadam VJ. Trend in floating drug delivery system. J sci industrial res 2006; 65: 11-21.
- Rao BP, Kottan NA, Snehith VS, Ramesh C. Development of Gastro Retentive Drug Delivery System of Cephalexin by Using Factorial Design. ARS Pharm 2014; 50: 8-24.
- The British pharmacopoeia. The British pharmacopoeia commission. UK 1990; (16).
- The United States Pharmacopoeia. United States Pharmacopeial Convention. Rockville 2000; XXIV: 1941-1943.


 Kajal A Choursiya* 1
 Sachin M Nikam 2
 Khanderao R Jadhav 3
 Rishikesh S Bachhav 4


 10.5281/zenodo.10903356