Department of Pharmaceutical Chemistry, Rani chennamma Collage of Pharmacy, Rajiv Ghandi University of Health Sciences, Belagavi, 590001, Karnataka, India
The objective of present work is to extract, purify and partially estimate caffeinefrom marketed coffee and tea powder.UV-Spectrophotometric method was evolved using chloroform as solvent. The evolved method was standardized in terms of validation parameters such as simple, sensitive, linear as per ICH Q2 (R1). Guidelines for analysis of caffeine in marketed tea and coffee powder.Caffeine was extracted from different brands of marketed coffee and tea powder and was analyzed through different analytical methods like UV-Spectroscopy, Iodometric Titration, Solubility, Melting point, Thin Layer Chromatography.
The name coffee is derived from the name of the territory keffa where shepherds from Abyssinia/Ethiopia discovered the coffee beans in the 6thcentury[1]. Coffee plants be linked to the family Rubiaceae. They are green shrubs with funnel shaped flowers that evolved into a pulpy fruit known as cherry[2]. There are different species of coffee like Coffee arabica, Coffee liberica and Coffee canephora. The most widely used among these three species are Coffee arabica and Coffee liberica . Coffee canephora is not much used because of its sensitivity to pests which reduces the yield. Tea refers to the agricultural products of the leaves, leaf buds and internodes of the Camellia sinensis plant and belongs to family The aceae. It has bees devoured as potation for almost 2000 years get under way in chine [3].
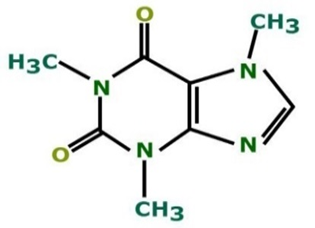
Coffee drinking is still an imoprtant ritual in Japan and England.[4] caffeine is also present in several beverages and cocoa derivate foods like carbohydrated soft drinks etc.[5] caffeine has the ability to et heart rate , blood pressure and basal metabolic rate for several hours.[6] caffeine gets readily absorbed in the body, and it reaches the brain within 5min after its consumption and is also eliminated with an average half-life of five hours from the body.[7] caffeine can be extracted from cocoa by various methods, such as water extraction, supercritical carbon dioxide extraction and organic solvent extraction.[8]In recent years, tea quality has gained considerable significance as consumers have become more health conscious.[9] Caffeine is a naturally found in the leaves, seeds and fruits of a numerous plant species of a group of compounds called trimethyl xanthine. Its chemical formula is C8H10N4O2[10]. Caffeine (1,3,7 – trimethyl xanthine) is an purine alkaloid of xanthine group widely known worldwide due to it occurrence in extensively consumed beverages, drinks and food[11]. Caffeine is a heat stable bitter white crystalline xanthine [12].
2. METHODS
2.1. Extraction Method
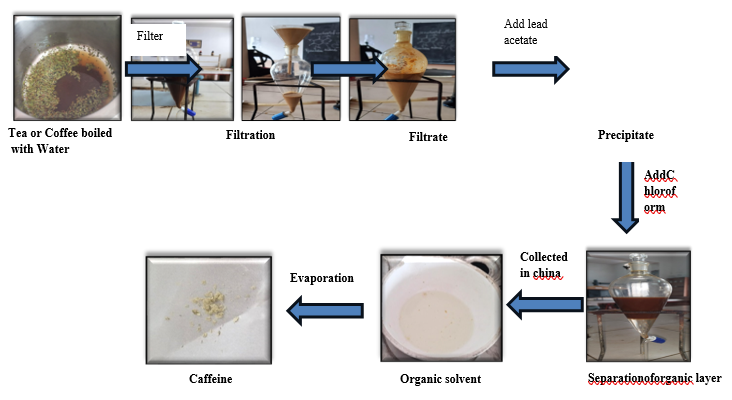
50g coarse powder of different brands of tea ( Taj , Green tea) and coffee ( Bru, Sun bean) were mixed with water (approximate 700ml) and heated up to 2hours at 1000C boiling.The solution was filtered and lead acetate(30ml) was added to the filtrate and a curdy brown precipitate was obtained.Lead acetate was added till the precipitation was complete.It was filtered again and the filtrate was boiled until it reduced to 50ml.The solution was allowed to cool and caffeine was extractedfrom it using chloroform(50ml).Chloroform was evaporated from the extract and the residueleft behind was caffeine.It was dried and weighed.The procedure was repeated with all the tea and coffee samples.[13]
2.2. Melting Point
Melting point is the temperature at which a given solid material changes from a solid state to liquid state or melts. The melting point is useful for indication to check the identity and purity of the substance. Melting Point By Capillary Method: The caffeine is filled in the capillary tubes.The capillary tube and thermometerisdipped in liquid paraffin containing Thiel’s tube. heat supply continuously to Thiel’s tube until the product melt. Note down the temperature range.[14]
2.3. Solubility Estimation
For the caffeine it is necessary to know the solubility of the drug. So that solvent selection doneby performing solubility test of caffeine in difference solvents.It was confirmed that the drug is i.e. caffeine is freely soluble in chloroform and boiled water.
Weigh accurately 1gm of caffeine and dissolve in a100ml of different solvents which is taken in a 100ml of volumetric flask.[15]
2.4. Identification test
Confirmative tests for were performed to check the presence of caffeine:-
2.5. Test for purity
For checking purity of caffeine limit tests were performed
2.6 Analytical method for caffeine (UV- Spectroscopy method)
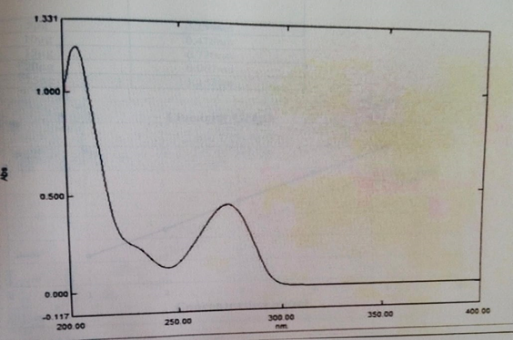
0.1gm of extracted caffeine was dissolved in 100ml of chloroform and it was scanned in the UV-visible region i.e., from 200-400nm.
0.1gm of extracted caffeine was weighed and dissolved in 100ml of chloroform. Series of dilutions were done like 5, 10, 15, 20, 25µg in 10ml volumetric flask. Absorbance was checked at maximum wavelength obtained.[21]
Method Validation
The method was validated according to ICH guidelines Q2 (R1) by following parameters.
Linearity and range
Linearity and range were calculated with the by adding stock solution and with series of dilutions done in 10ml volumetric flask with chloroform and scanned at maximum wavelength obtained (273.2nm). The calibration curve was plotted in graph by taking Concentration vs absorbance on x and y axis respectively. Correlation coefficient was calculated.
Specificity
Specificity of working standard solution was taken and was scanned at 273.2nm.[22]
LOD
Limit of detection is concentration at which analyte in the test sample was detected.
LOD= 3.3 ×Standard deviation of regression
Slope LOQ
Limit of quantification is the concentration at which analyte in the test sample is quantified.
LOQ= 10 ×Standard deviation of regression
Slope
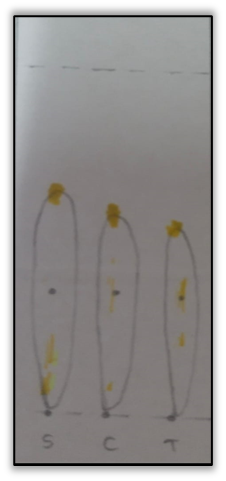
2.7. Thin Layer Chromatography
Thin Layer Chromatography was done in separation and identification and of caffeine from different brands of tea and coffee powder.
Retention factor (Rf) = Distance travelled by the component substance from the baseline Distance travelled by the solvent from the baseline
2.8. Iodometric Titration
Iodometric titration was performed on extracted caffeine where it reacts with excess of iodine and the remaining iodine forms a precipitate. Then this precipitate is filtered. Then the titration is done by using standard sodium thiosulphate solution with starch solution as indicator. Here, the amount of remained iodine is determined and by this the amount of caffeine is also found.
3. RESULTS
a. Caffeine content in different brands of tea and coffee
|
Tea And Coffee Brands
|
Weight Of Caffeine Content |
|
Taj |
0.96g |
|
Lipton Green Tea |
0.28g |
|
Golden Tea |
0.14g |
|
Bru |
1.04g |
|
Nescafe |
0.82g |
|
Levista |
0.84g |
b.Melting point
|
Sr. No |
Melting point Range |
||
|
Standard |
Tea |
Coffee |
|
|
1 |
2380C |
2400C |
2380C |
|
2 |
2370C |
2380C |
2400C |
|
3 |
2370C |
2390C |
2390C |
|
Average |
237.30C |
239.30C |
239.30C |
|
Sr. No |
Test |
Observation |
Inference |
|
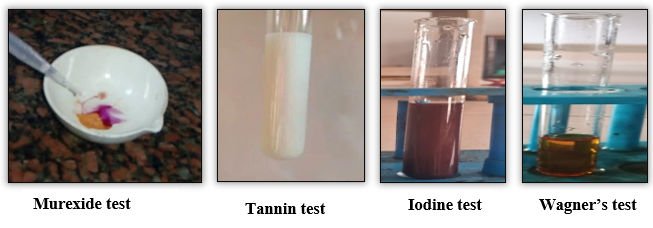
1 |
Murexide test |
Purple colour appears |
Caffeine present |
|
2 |
Tannin test |
White precipitate appears |
Caffeine present |
|
3 |
Iodine test |
Brown precipitate appears |
Caffeine present |
|
4 |
Wagner’s test |
Reddish brown colour appears |
Caffeine present |
d.Test for purity
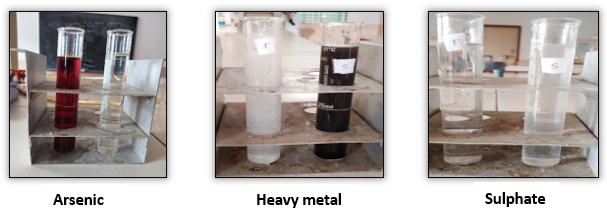
Limit test
?Limit test for Arsenic:
?The intensity of brown stain produced in test mercuric chloride paper is less in test than in standard. Hence the sample passes the limit test.
?Limit test for Heavy metals:
?The purple colour produced in test solution is less than that of standard solution. Hence the sample passes the limit test.
?Limit test for Sulphate:
e.Linearity
? max of caffeine
Standard Caffeine
|
Concentration(µg/ml) |
Absorbance |
|
5µg |
0.254nm |
|
10µg |
0.478nm |
|
15µg |
0.726nm |
|
20µg |
0.962nm |
|
25µg |
1.183nm |
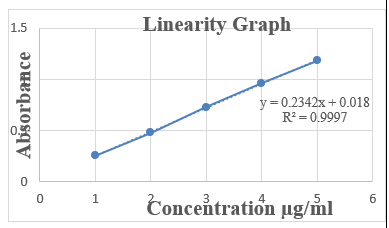
Report: The results of UV spectroscopic method were within the acceptance limit. The calibration curve of the drug gives correlation coefficient value 0.9997.
|
Concentration (µg/ml) |
Absorbance |
|
5µg |
0.223nm |
|
10µg |
0.447nm |
|
15µg |
0.653nm |
|
20µg |
0.882nm |
|
25µg |
1.076nm |
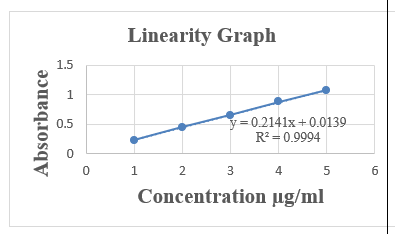
Report: The results of UV spectroscopic method were within the acceptance limit. The calibration curve of the drug gives correlation coefficient value 0.9994.
|
Concentration(µg/ml) |
Absorbance |
|
5µg |
0.189nm |
|
10µg |
0.387nm |
|
15µg |
0.541nm |
|
20µg |
0.702nm |
|
25µg |
0.942nm |
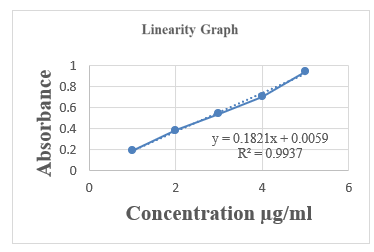
REPORT: The results of UV spectroscopic method were within the acceptance limit. The calibration curve of the drug gives correlation coefficient value 0.9937.
Rf of standard = Distance travelled by the solute
Distance travelled by the solvent
Rf =3.7 = 0.695.3
Rf of coffee =Distance travelled by the solute
Distance travelled by the solvent
Rf = 3.4 = 0.64
5.3
Rf of tea =Distance travelled by the solute
Distance travelled by the solvent
Rf =3.2 = 0.60
5.3
g.Iodometric Titration
|
Sr. No |
Burette Reading |
Average |
|
|
|
Initial |
Final |
|
|
Blank 1 |
0.0 |
17.5 |
16.55 |
|
Blank 2 |
0.0 |
15.6 |
|
|
Standard 1 |
0.0 |
12.6 |
13 |
|
Standard 2 |
0.0 |
13.4 |
|
CALCULATION:
Caffeine = Volume of sodium thiosulfate × molarity of sodium thiosulfate × 194.19
content (mg/ml)
Volume of sample
NOTE:
Blank = 16.5 × 0.1 × 194.19 = 64.08mg
5
Sample = 13× 0.1 × 194.19 =50.48mg
5
|
Sr. No |
Burette Reading |
Average |
|
|
|
Initial |
Final |
|
|
Balnk 1 |
0.0 |
17.7 |
17.15 |
|
Blank 2 |
0.0 |
16.6 |
|
|
Standard 1 |
0.0 |
13.3 |
13.9 |
|
Standard 2 |
0.0 |
14.5 |
|
Calculation:
Caffeine = Volume of sodium thiosulfate × molarity of sodium thiosulfate × 194.19
content (mg/ml)
Volume of sample
Note:
Blank = 17.15 × 0.1 × 194.19 = 66.6mg
5
Sample = 13.9× 0.1 × 194.19 =53.98mg
5
|
Sr. No |
Burette Reading |
Average |
|
|
|
Initial |
Final |
|
|
Blank 1 |
0.0 |
16.53 |
15.88 |
|
Blank 2 |
0.0 |
15.24 |
|
|
Standard 1 |
0.0 |
11.98 |
12.73 |
|
Standard 2 |
0.0 |
13.49 |
|
Calculation:
Caffeine = Volume of sodium thiosulfate × molarity of sodium thiosulfate × 194.19
content (mg/ml)
Volume of sample
Note:
Blank=15.88 × 0.1 × 194.19= 61.67mg
5
Sample=12.73× 0.1 × 194.19 =49.44mg
5
4. DISCUSSION
The estimation of caffeine was done partially by methods like iodometric titration, thin layer chromatography, UV- Spectroscopy. In thin layer chromatography we cannot see other chemical constituents present in different brands of coffee and tea used because the mobile phase used in separation may not be suitable for constituents to be separated or they cannot be seen through UV- light. In iodometric titration as the excess of iodine being taken some of the iodine gets evaporated as it is volatile in nature and there will be fluctuation in the results. The standard solution which is used in the experiment for titration should be properly standardized by sodium thiosulphate to get the accurate results. Then the chemicals of required quantity should be taken so to get precise results.For UV- Spectroscopy the standard solution should be prepared with the solvent in which the caffeine gets dissolved (boiling water or chloroform). The dilutions should be done properly and any small changes in the dilution may lead to change in the final result.
5.CONCLUSION
Tea and coffee are very rich in anti-oxidants. They are most widely used beverages all over the world. They also have medicinal properties. In this study different brands of marketed tea and coffee were decaffeinated using chloroform as solvent. This study was carried out to check the amount of caffeine present in different brands of marketed tea and coffee.Caffeine from different brands of marketed tea and coffee were extracted by liquid-liquid extraction followed by recrystallization. The obtained caffeine were then analysed by UV-Spectroscopic method. The effective characterization of caffeine was achieved by melting point apparatus. Caffeine is most commonly used for Central Nervous System (CNS) activation and it is widely used as psychoactive drug in the world. When the caffeine content of different brands of marketed tea were compared and it was noted that Taj Mahal Tea had highest caffeine content and Lipton Green Tea had lowest caffeine content and when different brands of marketed coffee were compared and it was noted that Bru had highest caffeine content and Nescafe had lowest caffeine content.
6. ACKNOWLEDGEMENT
The completion of our project work has been an intense learning period for us,not only in scientific arena,but also an personal level. In this acknowledgement we take privilege to express sincere gratitude towards the fine individuals for their inspiration, guidance and support that we received. First and foremost, we thank the almighty who blessed us with this apportunity , gave us the evidence of requisite determination and strength to persue and complete this course and sertation successfully. We would like to express our deepest gratitude to our guide, Mrs. Ankita Thaikar M. pharm Lecturer ,Dept of Pharmaceutical chemistry ,Rani Chennamma college of pharmacy,. Her valuable guidance, simplicity, prompt inspiration, encouragement timely suggestions with her goodness,great support throughout our dessertation work will always be remembered. We wish to express our sincere thanks to Vice-Chancellor, Principal and VicePrincipal, of Rani Chennamma College of Pharmacy, Belagavi for providing invigorative and conductive environment to persue this research work with a great ease. We expressed our sincere gratitude to our Mr. Udaykumar Bolmal sir and all teachers for their valuable feedback and profound co-operation offered during the time of course. We extend thanks to all our batch mates (Friends) for their valuable co-operation, support and help throughout our research work. Our sincere and humble thanks to our peons, Technicians and Librarians for their directly or indirectly help in our research work. We again express our sincere thanks to all the people who helped and support us in the journey of fulfilment of our research work.
Thanks to one and all...
REFERENCES


Ankita Thaikar*, Deepti Bommanal, Mayuri Shindhe, Rashika Wagger, Ujjanagouda Dannappanavar, Veeranagoud Patil, Extraction, Purification and Partial Estimation of Caffeine from Marketed Tea and Coffee Powder, Int. J. of Pharm. Sci., 2024, Vol 2, Issue 12, 3366-3373. https://doi.org/10.5281/zenodo.14575565
 10.5281/zenodo.14575565
