Mount Zion College of Pharmaceutical Sciences and Research, Adoor
Atropine sulphate is a widely used anticholinergic drug, particularly in ophthalmic formulations and its analytical evaluation is essential to ensure quality, stability and safety. The present study was undertaken to evaluate the effect of selected excipients on the UV spectroscopic characteristics of atropine sulphate using a Quality by Design (QbD) approach. UV-Visible spectrophotometry was employed as a simple and economical analytical technique. The UV absorption spectrum of atropine sulphate was recorded in the wavelength range of 200-400nm, and the drug exhibited a maximum absorbance (?max) at 257nm, which was selected for further analysis. The influence of excipients such as sodium chloride (NaCl), sodium citrate (Na3C6H5O7) and sodium hydroxide (NaOH) on the UV behavior and stability of atropine sulphate was studied. Forced degradation studies under thermal stress, pH variation, and concentration changes were carried out to assess degradation behavior. A QbD-based design of experiments (DoE) approach using Box-Behnken design was applied to evaluate the effect of critical process parameters such as concentration, temperature and pH on percentage recovery. Statistical analysis using ANOVA conformed the significance of the developed models. The results demonstrated that excipient type and experimental conditions significantly influence the UV spectroscopic response and stability of atropine sulphate. The study concludes that the developed UV spectrophotometric method is robust, reproducible, and suitable for analytical and formulation studies of atropine sulphate.
Pharmaceutical Analysis
Pharmaceutical analysis is a crucial area within pharmaceutical sciences, focusing on the identification, quantification, and purification of pharmaceutical components to ensure drug safety, efficacy and quality throughout their lifecycle[1]. It involves various analytical techniques such as titrimetric analysis, spectroscopy, chromatography, and electrophoresis to assess drug content, detect impurities, and confirm compound identity. This analysis is vital in quality control, drug development, regulatory compliance, and clinical studies, with strict validation required by authorities like the FDA and EMA[2]. Moreover, it plays a significant role during research and development phases, optimizing drug formulations and ensuring consistency. In bioanalytical studies, it measures drug concentrations in biological fluids, informing pharmacokinetic and pharmacodynamic evaluations. Additionally, adherence to pharmacopoeial standards is essential for regulatory submissions, reinforcing the role of pharmaceutical analysis in ensuring the quality, integrity and global accessibility of medicines[3].
The foundation of contemporary pharmaceutical sciences is pharmaceutical analysis. It guarantees that all processes are based on precise, dependable and repeatable data from medication research and discovery to regulatory approval and post marketing monitoring. Pharmaceutical analysis will play a crucial role as novel drug delivery systems and advanced therapeutic approaches are developed. This demands continuous innovation, adaptation and strict adherence to international quality standards[4].
UV Spectroscopy
An analytical method called UV spectroscopy is used to quantify how much UV light is absorbed by chemicals, usually in the 200-400 nm range. It requires the excitation of molecules electrons, which causes energy levels to change from lower to higher[5]. This procedure is useful for recognizing and measuring molecules, especially those with conjugated systems or aromatic rings, and it provides information on the structure of a molecule[6]. The method is widely used for both qualitative and quantitative analysis in the fields of chemistry, biology and pharmaceuticals. Rapid and non-destructive evaluations of concentration, purity and kinetics are among its benefits[7]. The Beer-Lambert Law, which links light absorption to a material's characteristics, is the fundamental idea. The central principle behind UV spectroscopy is the interaction between electromagnetic radiation and the electronic transitions within molecules which can provide valuable information about the chemical composition[8].
Atropine Sulphate
Atropine sulphate is a naturally occurring tropane alkaloid obtained from plants of the Solanaceae family, particularly Atropa belladona[9]. It is a well-known anticholinergic agent that acts by competitively inhibiting muscarinic acetylcholine receptors in the peripheral and central nervous systems[10]. Due to its pharmacological actions, atropine sulphate is widely used in ophthalmology as a mydriatic and cycloplegic agent, as well as in the management of conditions such as uveitis, amblyopia and progressive myopia. In ophthalmic formulations, atropine sulphate must be carefully formulated to ensure stability, Safety, efficacy and patient comfort. The selection of suitable excipients plays a crucial role in maintaining isotonicity, pH, clarity and chemical stability of the formulation[11]. Common excipients such as sodium citrate, sodium chloride and sodium hydroxide are incorporated to adjust tonicity, buffer the solution, adjust pH thereby enhancing drug stability and ocular tolerability[12].
Sodium Chloride
Sodium chloride (NaCl) is a widely used pharmaceutical excipient, especially in ophthalmic formulations, due to its ability to maintain isotonicity[13]. It helps to adjust the osmotic pressure of the formulation so that it is compatible with tear fluid, thereby minimizing ocular irritation and discomfort upon administration[14]. Maintaining isotonicity is essential for patient compliance and safety in eye preparations. In atropine sulphate formulations, sodium chloride plays an important role in ensuring uniform drug distribution and stability of the solution[15]. By maintaining an appropriate ionic environment, it supports the physiochemical stability of the formulation without interfering with the therapeutic action of the drug[16]. NaCl is chemically stable and highly soluble in water, making it suitable for aqueous ophthalmic solutions.
From a safety perspective NaCl is generally regarded as non-toxic and non-irritant when used within acceptable concentration limits[17]. However, excessive concentrations may lead to hypertonicity and ocular discomfort. Therefore, precise concentration control is essential during formulation development to ensure safety and effectiveness[18].
Sodium Hydroxide
Sodium hydroxide (NaOH) is an important excipient used primarily for pH adjustment in pharmaceutical formulations. In ophthalmic preparations, maintaining an appropriate pH is critical to ensure drug stability, solubility and patient comfort[19]. NaOH allows precise adjustment of pH to the desired range, preventing degradation of the active pharmaceutical ingredient. In atropine sulphate formulations, NaOH is used in small quantities to control acidity or alkalinity during formulation development[20]. Proper pH control helps to enhance the chemical stability of atropine sulphate and reduces the risk of irritation to ocular tissues. Due to its strong alkaline nature, NaOH must be handled carefully during formulation. Although NaOH is highly corrosive in concentrated form, it is considered safe when used in very low concentrations as a pH- adjustment agent[21]. Strict control of concentration and thorough mixing are essential to avoid local irritation or tissue damage, making careful formulation and quality control procedures are necessary[22].
Sodium Citrate
Sodium citrate (Na3C6H5O7) is the sodium salt of citric acid and is commonly used as a buffering and stabilizing agent in pharmaceutical formulations[23]. It helps to maintain a stable pH environment, which is crucial for the chemical stability of the drug substance. In ophthalmic preparations, buffering agents like sodium citrate help to minimize pH fluctuations that may occur during storage[24]. In atropine sulphate formulations, sodium citrate contributes to improved formulation stability and ocular tolerability. It also possesses mild chelating properties, which help in reducing metal ion induced degradation[25]. Additionally, sodium citrate is used to enhance compatibility with biological tissues, making it suitable for sensitive dosage forms such as eye drops. Sodium citrate is generally regarded as safe and well tolerated when used within recommended limits. However, excessive concentrations may cause irritation or imbalance in formulation pH[26]. Therefore, its concentration must be optimized to achieve effective buffering without compromising safety or patient comfort[27].
Quality by Design
Designing and comprehending processes to guarantee predetermined quality results is the focus of Quality by Design (QbD), a sophisticated, science-driven framework for pharmaceutical development and manufacture[28]. In response to changing regulatory requirements, the need for more effective manufacturing procedures, and the realization that conventional end-product testing alone cannot ensure consistent product quality, the pharmaceutical industry has adopted QbD more and more over the past 20 years. QbD encourages a proactive, methodical strategy where quality is integrated into the product from the very beginning of development, as opposed to depending on empirical formulation techniques and retroactive quality assessments[29]. The International Council for Harmonization (ICH) guidelines, specifically ICH Q8 (Pharmaceutical Development), ICH Q9 (Quality Risk Management), ICH Q10 (Pharmaceutical Quality System), and ICH Q11 (Development and Manufacture of Drug Substances), form the basis of QbD[30]. Together, these recommendations support lifecycle management through continuous improvement, improved process understanding, and scientifically supported control measures. By enabling businesses to thoroughly investigate the connections between formulation components, material properties, process parameters, and the final product features, QbD transforms the development process[31].
DRUG PROFILE
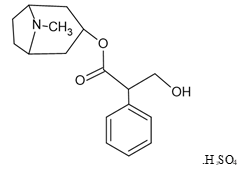
Figure 1: Chemical structure of Atropine sulphate
Atropine sulphate is the sulphate salt of atropine, a tropane alkaloid obtained from Atropa belladonna and related plants. Chemically, it is known as (8-methy-8-azabicyclo[3.2.1]oct-3-yl)2-hydroxy-2-phenylacetate, with a molecular formula of C17H23NO3.H2SO4 and a molecular weight of approximately 694.83 g/mol[32]. Structurally, it consists of a bicyclic tropane ring linked to tropic acid through an ester linkage. Atropine sulphate appears as a white, crystalline, odourless powder with a bitter taste[33]. It is freely soluble in water and alcohol but insoluble in ether and chloroform and has a melting point of about 190?. It is a weak base with a pKa of 9.43 and a partition coefficient of 1.83. The compound shows maximum UV absorption in the range of 255-260nm in aqueous solution. Atropine sulphate is stable under normal storage conditions but decomposes on prolonged exposure to light and moisture, and hence should be stored in tightly closed, light-resistant containers. Therapeutically, it is used as an anticholinergic agent to reduce salivary and bronchial secretions before surgery, to produce pupil dilation (mydriasis), as an antidote in organophosphate poisoning, and in the treatment of bradycardia[34].
MATERIALS AND METHODS
Instrumentation
The Cary 5000 UV-VIS-NIR spectrophotometer is a high-performance UV-VIS and NIR spectrophotometer with photometric performance in the 173-3300nm range. All weighing is done on analytical balance.
Chemicals and Reagents
Atropine was purchased from Isochem Laboratories, Angamaly, Kochi. The powder formulation used was Atropine Sulphate AR 5gm (Molecular weight = 694.28). Sodium hydroxide was purchased from Isochem Laboratories, Angamaly, Kochi. The flakes formulation used was Sodium hydroxide flakes 500gm (Molecular weight = 40.00). Sodium chloride, purchased from Isochem Laboratories, Angamaly, Kochi. The powder formulation used was Sodium Chloride 500gm (Molecular weight = 58.44). Sodium citrate was purchased from Isochem Laboratories, Angamaly, Kochi. The powder formulation used was tri-Sodium citrate 500gm (Molecular weight = 294.10)
Choice of solvent
Atropine sulphate was found to be soluble in water so distilled water is taken as suitable solvent for sample preparation.
Preparation of calibration curve of Atropine
100mg of atropine sulphate drug was accurately weighed and transferred to a 100ml volumetric flask. To this 10ml distilled water was added and flask was shaken to solubilize the drug. The volume was made up to the mark with distilled water. The stock solution was further diluted with distilled water to obtain various dilutions containing 5,10,15µg/ml of drug respectively. To find the λmax of Atropine sulphate, the spectrum used is in the range of 200 to 400nm.
Study of excipients
The selected excipients are Sodium Chloride, Sodium Citrate, Sodium Hydroxide. Stock solution of selected excipients were prepared by accurately weighing the required quantities and dissolving them in distilled water. Sodium Chloride solutions of 0.9%, 2% and 5% were prepared in separate volumetric flasks and the volume was made up to 250ml with distilled water. Similarly, Sodium Citrate solutions of 0.1%, 0.5% and 1.0% were prepared in different volumetric flasks and diluted to 250ml. Sodium Hydroxide solutions of 0.01%, 0.05% and 0.1% were also prepared in separate volumetric flask, with the final volume adjusted to 250ml using distilled water. These prepared solutions were used for the study of excipient effects.
Accurately weigh 1g of Atropine using an analytical balance and transfer it into a 100 ml volumetric flask. Add about 50 to 60 ml of the prepared excipient stock solution (sodium chloride, sodium citrate, sodium hydroxide) to the flask and shake gently until the drug completely dissolves. After complete dissolution make up the volume to 100 ml using the same excipient stock solution to obtain a standard stock solution of Atropine. The final concentration of the prepared solution is:
1g/100ml= 10mg/ml (10,000µg/ml)
The standard stock solution is used for further dilution to prepare the required working standards for UV analysis.
Forced degradation studies
Forced degradation is done under heat, pH and concentration
QbD approaches to analysis
Applying QbD in UV method development begins with establishing analytical objectives based on validated scientific principles to ensure consistent method performance characteristics. Thus, the objective of this work was to perform experimental design by using Design Expert Software leading to the development of a simple, rapid and sensitive method by QbD approach and validated as per ICH guidelines Q2(R1) for Atropine Sulphate.
For conducting the study, we assume that the compound is stable at different conditions and it is checked by measuring its percentage recovery.
Here we consider the concentration, temperature and pH as independent variables and percentage recovery as dependent variable. Several trial runs using all three possible combinations of these factors were performed. The contour plot was created using data representing the relationship between three parameters. Box-Behnken design was constructed using the data obtained and the significance of the method was checked using p-value and f-value obtained from the ANOVA table.
RESULTS AND DISCUSSION
The UV spectroscopic behavior of atropine sulphate was evaluated by scanning the drug solution in the wavelength range of 200-400nm using a UV-Visible spectrophotometer. The absorption characteristics were studied to identify the analytical wavelength suitable for further analysis[35].
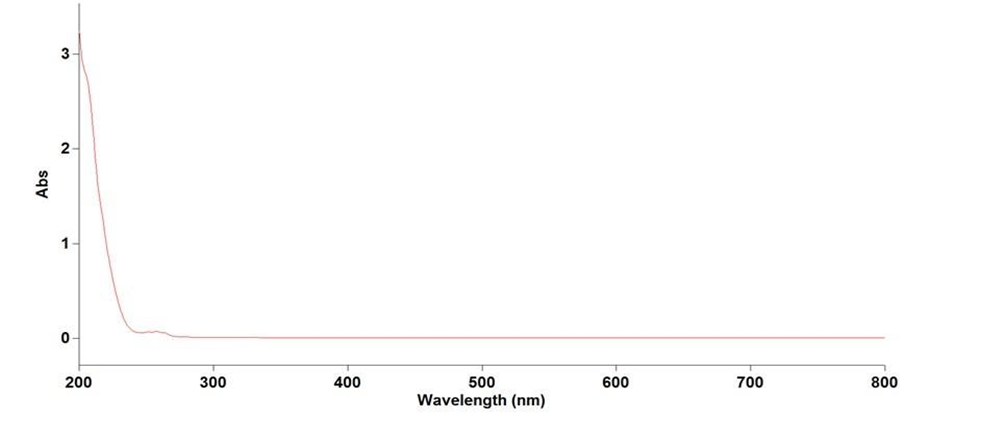
Figure 2: Absorbance vs wavelength profile of Atropine Sulphate
The UV spectroscopic behavior of atropine sulphate was evaluated by scanning the drug solution in the wavelength range of 200-400nm using a UV visible spectrophotometer. The absorption spectrum of atropine sulphate showed a well-defined maximum absorbance (λmax) at 257nm, which is consistent with reported literature values[36]. This wavelength selected for further analytical and degradation studies and spectroscopic analysis.
Forced degradation studies
Forced degradation studies of atropine were carried out to evaluate its stability under various stress conditions such as the thermal stress, pH induced stress, and concentration-dependent stress, using UV-Visible spectrophotometry as the analytical tool[37]. These studies help in understanding the degradation behavior of atropine and in establishing the stability-indicating nature of the method. Atropine undergoes degradation under stress conditions due to hydrolysis and structural changes[38]. Exposure to elevated temperature accelerates degradation, resulting in a gradual decrease in the characteristic absorbance of atropine at its λmax, pH plays a significant role in the degradation process, where alkaline conditions promote faster degradation due to ester cleavage, while acidic conditions also induce degradation but at a comparatively slower rate[39]. These stress conditions lead to visible changes in the UV absorption spectra, which can be effectively monitored using UV Visible spectroscopic analysis[40]. The concentration atropine influences both the degradation kinetics and the accuracy of spectroscopic measurements. Higher concentrations enhance detectability of degradation-related absorbance changes however; excessive concentrations may result in deviations from Beer-Lambert’s law[41]. The spectral variations observed under different stress conditions generate distinct degradation profiles that can be quantitatively analyzed. UV-Visible spectrophotometry proved to be a simple, sensitive and reliable method for characterizing atropine degradation under controlled stress conditions[42]. The robustness of the method was evaluated using Design of Experiments (DoE) with the aid of statistical software. Critical processes parameters such as temperature, pH, and concentration that influence the stability of atropine were identified[43].
Once these factors were recognized, they were systematically varied within predefined ranges to determine the optimal experimental conditions. The selected ranges are presented in table1 and various experimental runs were performed using different combination of these parameters, as shown in table2. Sequential data analysis was carried out using a fit summary and the quadratic model was selected as the most appropriate model for the study. The model F-value indicated that the selected model was statistically significant, with a low probability of occurrence due to random error. Based on the developed model, 2D, 3D contour plots were generated to visualize the effect of independent variables on a response under varying experimental conditions and indicate regions of maximum stability. A Box-Behnken design was employed to study the interaction between multiple independent variables and the dependent response[44]. The p-values obtained from ANOVA confirmed the significance of selected model terms. Factors such as concentration and pH show minimal variation, indicating their stability, whereas temperature exhibited a more pronounced effect on atropine degradation[45]. The final optimized conditions demonstrate the suitability of the developed UV-Visible spectrophotometric method for stability assessment of atropine.
Table no: 1 coded value for independent variables
|
Name |
Units |
Low |
High |
|
Concentration |
mg |
5 |
15 |
|
Temperature |
? |
37 |
80 |
|
pH |
nil |
4 |
9 |
Table no: 2 Optimization parameters of analysis of atropine
|
|
Factor 1 |
Factor 2 |
Factor 3 |
Response 1 |
Response 2 |
Response 3 |
|
Run |
A:concentration (mg) |
B:temperature (?) |
C: pH |
% recovery (NaCl) |
% recovery (Na3C6H5O7) |
% recovery (NaOH) |
|
1 |
1 |
80 |
6.5 |
6.6325 |
11.921 |
61.192 |
|
2 |
0.2 |
80 |
6.5 |
10.596 |
14.172 |
79.470 |
|
3 |
0.6 |
58.5 |
6.5 |
30.463 |
13.245 |
59.602 |
|
4 |
0.6 |
58.5 |
6.5 |
30.463 |
13.245 |
59.602 |
|
5 |
1 |
37 |
6.5 |
9.2715 |
13.245 |
100 |
|
6 |
0.6 |
37 |
4 |
33.112 |
13.245 |
75.496 |
|
7 |
0.6 |
80 |
4 |
29.139 |
15.894 |
76.821 |
|
8 |
0.2 |
58.5 |
4 |
10.596 |
14.172 |
129.80 |
|
9 |
0.6 |
37 |
9 |
29.139 |
15.894 |
76.821 |
|
10 |
1 |
58.5 |
9 |
3.9735 |
14.369 |
65.622 |
|
11 |
0.2 |
37 |
6.5 |
10.596 |
14.172 |
129.80 |
|
12 |
1 |
58.5 |
4 |
5.2981 |
11.920 |
71.390 |
|
13 |
0.6 |
80 |
9 |
29.139 |
14.569 |
43.708 |
|
14 |
0.6 |
58.5 |
6.5 |
30.463 |
13.245 |
59.602 |
|
15 |
0.6 |
58.5 |
6.5 |
30.463 |
13.245 |
59.602 |
|
16 |
0.6 |
58.5 |
6.5 |
30.463 |
13.245 |
59.602 |
|
17 |
0.2 |
58.5 |
9 |
11.920 |
14.304 |
86.092 |
Quality by Design (QbD) and Design of Experiments (DoE) Evaluation
To evaluate thtablee robustness of the analytical method, a quality by design approach was applied using design of experiments. Critical process parameters such as concentration, temperature and pH were identified as independent variables, while percentage recovery was selected as the dependent response[46]. These parameters were systematically varied within predefined ranges, as shown in table 1 and multiple experimental runs were carried according to a Box-Behnken. Repeated center point runs included to assess experimental error and method reproducibility. Sequential model analysis was performed, and the quadratic model was selected as the most appropriate model for sodium chloride and sodium hydroxide based on fit summary results, whereas a linear model was found suitable for sodium citrate. The selected models showed statistically significant F-values with low p-values, indicating that the models were not influenced by random error[47].
Table no: 3 Fit summary (NaCl)
|
Source |
Sequential p-value |
Adjusted R2 |
Predicted R2 |
|
|
Linear |
0.9538 |
-0.2008 |
-0.7918 |
|
|
2FI |
0.9980 |
-0.5552 |
-2.9530 |
|
|
Quadratic |
<0.0001 |
0.9888 |
0.9217 |
Suggested |
Table no: 4 Fit summary (Na3C6H5O7)
|
Source |
Sequential p-value |
Adjusted R2 |
Predicted R2 |
|
|
Linear |
0.0003 |
0.7043 |
0.5204 |
Suggested |
|
2FI |
0.1252 |
0.8353 |
-0.1528 |
|
|
Quadratic |
0.1805 |
1.0000 |
|
Aliased |
Table no: 5 Fit summary (NaOH)
|
Source |
Sequential p-value |
Adjusted R2 |
Predicted R2 |
|
|
Linear |
0.0155 |
0.4314 |
0.1404 |
|
|
2FI |
0.9882 |
0.2699 |
-0.8978 |
|
|
Quadratic |
< 0.0001 |
0.92629 |
0.7402 |
Suggested |
Response surface and contour plot analysis
Two-dimensional contour plots and three-dimensional contour plots were generated to visualize the influence of independent variables on percentage recovery. These plots helped identity regions of maximum stability and optimal experimental conditions. NaCl showed minimal influence on λmax but affected percentage recovery at higher concentrations, likely due to changes in ionic strength. Sodium citrate exhibited moderate effects, which can be attributed to its buffering capacity and influence on microenvironmental pH[48]. NaOH demonstrated the most pronounced effect on atropine sulphate stability, conforming the drug’s sensitivity to alkaline conditions.
ANOVA Interpretation
ANOVA results confirmed the statistical significance of the selected models. For sodium chloride and sodium hydroxide the quadratic models were significant (p< 0.0001), while sodium citrate followed a linear model. Temperature was identified as the most influential factor affecting degradation, particularly in sodium hydroxide containing solutions. Concentration and pH showed comparatively lesser variation within the studied range, indicating controlled stability[49]. Extreme percentage recovery values observed under certain experimental condition suggest instability or matrix effects due to excipient interaction or stress severity. These findings highlight the importance of controlling formulation and analytical parameters during method development. Overall the optimized conditions obtained through the QbD- based approach demonstrate that the developed UV-Visible spectrophotometric method is suitable, robust and reproducible for the stability assessment of atropine sulphate in the presence of selected pharmaceutical excipients[50].
The study confirms that excipient type and experimental conditions significantly influence the UV spectroscopic behavior and stability of atropine sulphate, supporting their careful selection during formulation development.
Table no: 6 ANOVA for Quadratic model (NaCl)
|
Source |
Sum of squares |
Mean square |
F-value |
p-value |
|
Model |
2057.01 |
228.56 |
158.24 |
<0.0001(significant) |
|
A-concentration |
42.93 |
42.93 |
29.73 |
0.0010 |
|
B-temperature |
5.47 |
5.47 |
3.78 |
0.0928 |
|
C- pH |
1.97 |
1.97 |
1.37 |
0.2807 |
|
AB |
1.74 |
1.74 |
1.21 |
0.3086 |
|
AC |
1.74 |
1.74 |
1.21 |
0.3086 |
|
BC |
3.95 |
3.95 |
2.73 |
0.1423 |
|
A2 |
1980.40 |
1980.40 |
1371.14 |
< 0.0001 |
|
B2 |
1.04 |
1.04 |
0.7228 |
0.4234 |
|
C2 |
2.89 |
2.89 |
2.00 |
0.1988 |
Table no: 7 ANOVA for Linear model (Na3C6H5O7)
|
Source |
Sum of squares |
Mean square |
F-value |
p-value |
|
Model |
13.33 |
4.44 |
13.70 |
0.003(significant) |
|
A-concentration |
3.60 |
3.60 |
11.09 |
0.0054 |
|
B-temperature |
1.97 |
1.97 |
6.09 |
0.0283 |
|
C- pH |
7.76 |
7.76 |
23.92 |
0.0003 |
Table no: 8 ANOVA for Quadratic model for (NaOH)
|
Source |
Sum of squares |
Mean square |
F-value |
p-value |
|
Model |
7044.85 |
782.76 |
47.12 |
< 0.0001(significant) |
|
A-concentration |
1009.67 |
1009.67 |
60.78 |
0.0001 |
|
B-temperature |
2814.98 |
2814.98 |
169.44 |
< 0.0001 |
|
C- pH |
28.27 |
28.27 |
1.70 |
0.2333 |
|
AB |
33.20 |
33.20 |
2.00 |
0.2004 |
|
AC |
0.1825 |
0.1825 |
0.0110 |
0.9195 |
|
BC |
7.02 |
7.02 |
0.4224 |
0.5365 |
|
A2 |
2742.34 |
2742.34 |
165.07 |
< 0.0001 |
|
B2 |
236.37 |
236.37 |
14.23 |
0.0070 |
|
C2 |
160.19 |
160.19 |
9.64 |
0.0172 |
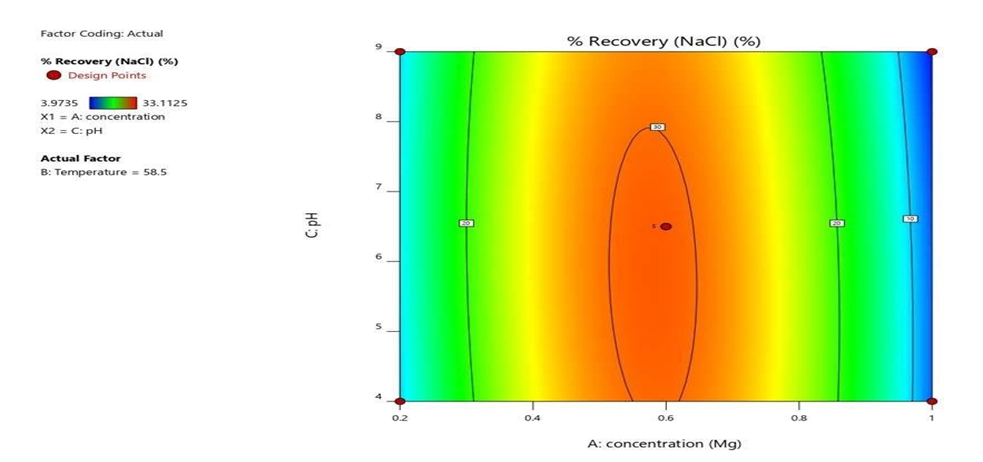
Figure 3: 2D Contour Plot of Sodium Chloride
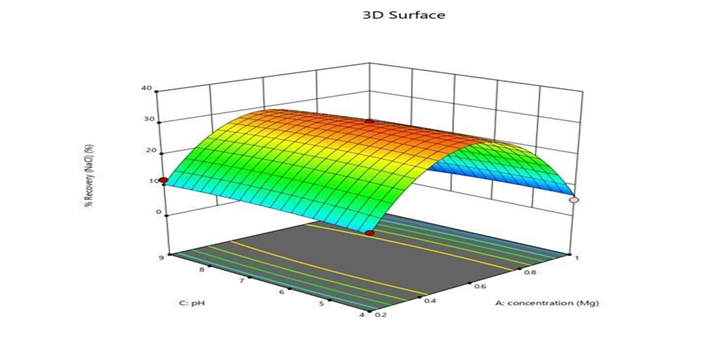
Figure 4: 3D Response Surface Plot of Sodium Chloride
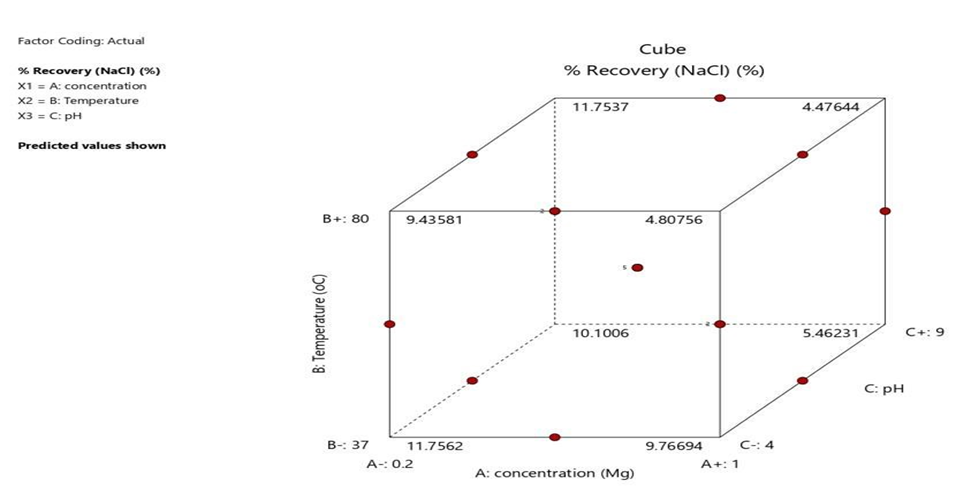
Figure 5: Box Behnken Design of Sodium Chloride
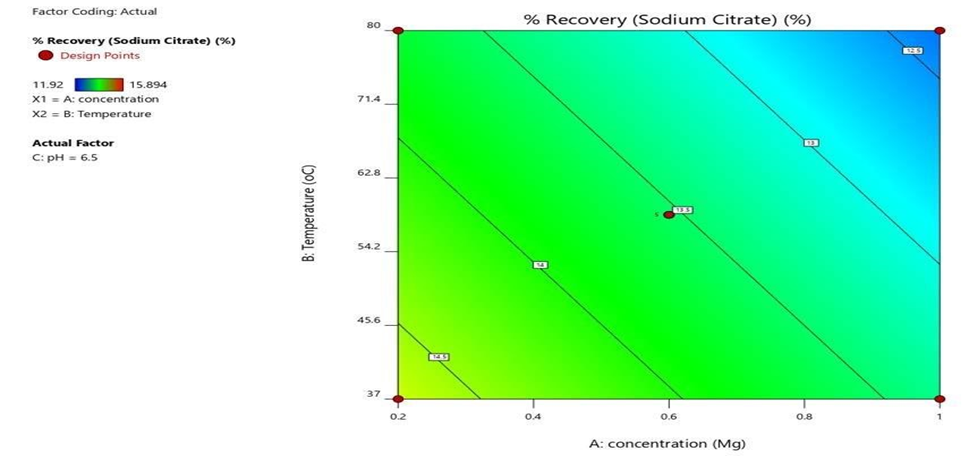
Figure 6: 2D Contour Plot of Sodium Citrate

Figure 7: 3D Response Surface Plot of Sodium Citrate
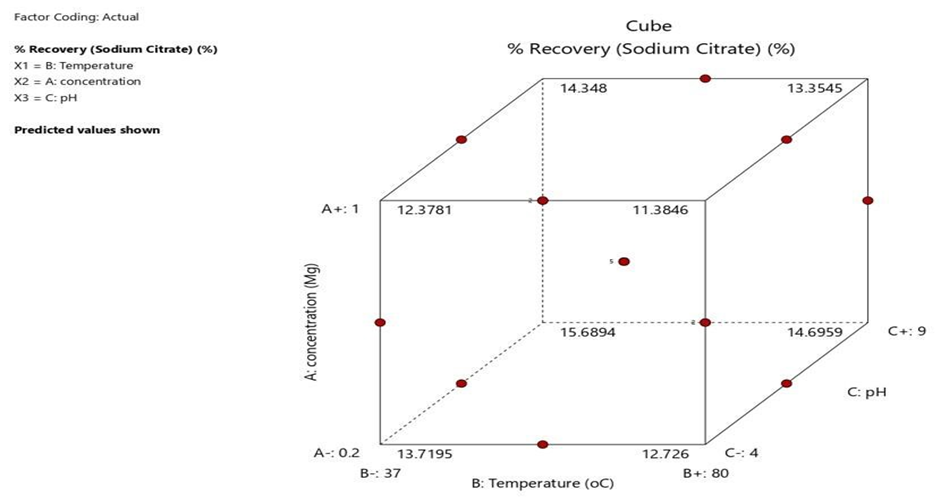
Figure 8: Box Behnken Design of Sodium Citrate
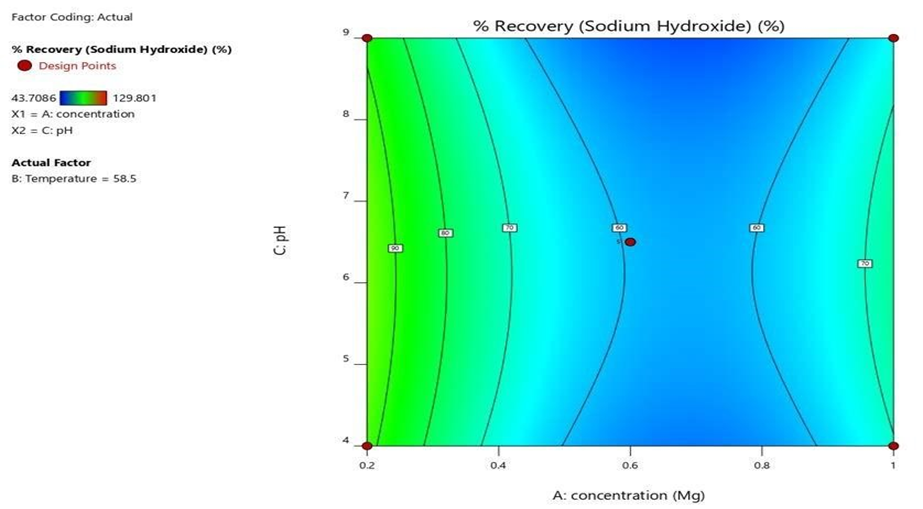
Figure 9: 2D Contour Plot of Sodium Hydroxide

Figure 10: 3D Response Surface Plot of Sodium Hydroxide
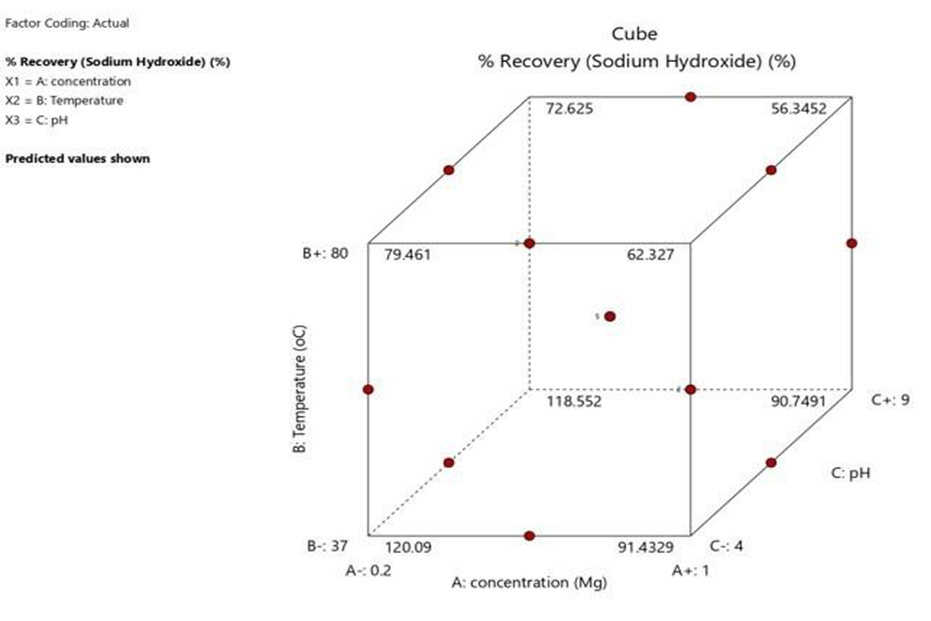
Figure 11: Box Behnken Design of Sodium Hydroxide
CONCLUSION
The present study successfully evaluated the effect of selected pharmaceutical excipients on the UV spectroscopic characteristics and stability of atropine sulphate using a Quality by Design (QbD) approach. Atropine sulphate exhibited a clear and well-defined λmax at 257nm, confirming its suitability for UV-Visible spectrophotometric analysis. Forced degradation studies revealed that atropine sulphate is sensitive to stress conditions, particularly temperature and alkaline pH, indicating potential degradation under extreme conditions. The excipients studied showed varying levels of influence on drug stability, with sodium hydroxide producing the most pronounced effect due to pH-related degradation, while sodium chloride and sodium citrate exhibited comparatively moderate effects. Application of Design of Experiments and statistical evaluation using ANOVA demonstrated that temperature, concentration and pH are critical parameters affecting percentage recovery and stability. The optimized conditions obtained through response surface and contour plot analysis confirmed the robustness and reliability of the development method. Overall, the study highlights the importance of excipient selection and controlled analytical conditions during formulation development. The developed UV-Visible spectrophotometric method, supported by QbD principles is simple, sensitive, reproducible and suitable for routine analysis and stability assessment of atropine sulphate in pharmaceutical formulations.
REFERENCES


Niranjana S Kumar, Shifa Fathima A R, Sangeetha K, Karthika R, Alfi R, Emin Jose, Evaluation of Effect of Excipients on Atropine Sulphate by UV Spectroscopy, Int. J. of Pharm. Sci., 2026, Vol 4, Issue 2, 1318-1333. https://doi.org/10.5281/zenodo.18548658
 10.5281/zenodo.18548658
