College of Pharmacy, Kannur Medical College, Anjarakandy, Kerala.
Thienopyrimidines can be regarded as a potential candidate for the treatment of cancer. In this study Ethyl 4-(chlorophenyl amino)-5 methyl thieno[2,3-d]pyrimidine-6-carboxylate; named as AV79 is evaluated for its anticancer potential . The compound is a thienopyrimidine derivative and this skeletal structure has been extensively studied for its EGFR inhibiting property. The amino and ester substitutions on the basic ring structure will enhance its chemotherapeutic activity. The compound is subjected to docking studies to find out the drug-target interaction. The objective of the study is to understand the molecular mechanism by which this chemical analog carry out is activity. MTT assay and neutral red assay are done to get a clear idea about its cytotoxic potential. Apoptosis assay by acridine orange and ethidium bromide double staining was done to determine the mechanism of cell death caused by the compound. Transwell migration assay is performed to detect whether this chemical analog could inhibit the migration of tumor cells. TMRE and DAPI staining is done to detect the cell death caused by AV79. Comet assay is also done to evaluate the genotoxicity.
Cancer is termed as a group of diseases which causes uncontrolled proliferation of cells1. In the two distinctions of cancer, benign and malignant, the later is the cause of death in 90?ses. As per ICMR-NCDIR cancer registry there are 12% increase in the cancer cases by the year 2025. Thienopyrimidines have been studied for its various pharmacological activities including antibacterial, anti-inflammatory, antiviral, antiprotozoal and anticancer activities out of which the activity against tumor remain significant since there are few marketed drugs and few drugs are in the last phase of clinical trials found to be active for the therapy of cancer. One of the thienopyrimidine analog Relugolix (TAK-385) has completed the phase III clinical trial for treating endometriosis and prostate cancer. The drug act by inhibiting the gonadotropin releasing hormone receptor. Pictilisib is also a thienopyrimidine derivative in the clinical trials investigated for its potential to treat solid tumors. There are marketed drugs like Omlutinib which is again a thienopyrimidine derivative which is used to treat non small cell lung cancer. The drug acts by inhibiting the epidermal growth factor receptor. Thus thienopyrimidines holds significance and promise in the field of cancer treatment2. The treatment of cancer still remains complicated even with the rapid advances and developments happening in the field of science and medicine. The chemotherapeutic resistance may be due to the varying physiology of tumors, the different physiology of the affected individuals, their genetic patterns, the accurate reachability of drug to the tumor site, blood supply to the affected site etc. The response to treatment is different for varying types of cancer and it also depends upon the physiology of individuals affected by it. The tumor cell migration to different parts of the body, metastasis is also a threat to the effective therapeutic response. So there is a need to develop drugs which suits the effective treatment pattern for each individuals is being the most challenging aspect in the cancer chemotherapy. Thienopyrimidine derivatives holds a promise in the development of new targeted drugs which can be effective for specific tumors. The derivatives acts by various molecular mechanisms. Some of the analogues inhibit the cyclin dependent kinases, epidermal growth factor receptors(EGFR), vascular endothelial growth factor receptors(VEGFR) etc. The substituent attachments to the thienopyrimidine decides its interaction to the various receptors. This study focuses on the anticancer potential of a novel thienopyrimidine derivative considering its increased binding affinity to the EGFR3.
MATERIALS AND METHODS
EGFR ELISA COLORIMETRIC ASSAY
Epidermal growth factor receptor belongs to the class of protein kinase family. The ligand epidermal growth factor bind to the receptor and promote cell growth and proliferation. Mutations to the genes coding this receptor will lead to different types of cancer like lung cancer, breast cancer, head and neck cancer, endometrial cancer etc. The dose-dependent activation and inhibition of EGFR in cells when different types of drugs are given are determined by EGFR In-cell ELISA Colorimetric assay. It is a spectrophotometric estimation to find out the degree of activation and inhibition of the receptor by different drugs.
1. MCF-7 cell lines were plated in a 96 well plate (10000 cells/well).
2. Cells are treated with AV79 in the order of increasing concentrations.
3. Gefitinib was added as standard in increasing concentrations.
4. Incubate plates overnight at 37oC in 5% CO2.
5. Media was removed and add 100?L of 4% formaldehyde to each well inorder
to fix the cells. Incubate the plate in fume hood at room temperature for 15
minutes.
6. Remove formaldehyde. Wash plate twice with 100?L/well of 1X TBS.
7. Remove 1X TBS and add 100?L/well of 1X Permeabilization buffer. Incubate
for 15 minutes at room temperature.
8. Remove Permeabilization buffer and wash plate once with 100?L/well of IX
TBS.
9. Remove IX TBS and add 100?L/well of Quenching solution. Incubate at room
temperature for 30 minutes.
10. Remove quenching solution and wash plate once with 100?L/well of IX TBS.
11. Remove 1X TBS and add 100?L/well of blocking buffer. Incubate at room
temperature for 30 minutes.
12. Remove blocking buffer. Add 100?L/well of primary antibody. Apply a plate
sealer and incubate overnight at 4oC.
13. Remove antibody and wash plate thrice with 100?L/well of 1X wash buffer.
14. Remove wash buffer. Add 100?L/well of diluted HRP conjugate. Incubate at
room temperature for 30minutes.
15. Remove the wash buffer and add diluted HRP conjugate. Incubate at room
temperature for 30 minutes.
16. Remove diluted HRP conjugate. Wash plate thrice with 200?L/well of 1X
wash buffer.
17. Remove wash buffer. Add 100?L/well of TMB substrate. Incubate at room
temperature protected from light.
18. Stop the reaction within 15 minutes or when blue colour is appeared.
19. Add 100?L/well of TMB stop solution. Measure the absorbance at 450nm
with 30 minutes of stopping the reaction.
MTT Assay
This assay detects the cytotoxic activity of the drugs and is considered as the preliminary in vitro test for anticancer drugs. It is first described by Tim Mosmann. The reduction of a yellow coloured salt of tetrazolium; 3-(4,5-dimethylthiazol-2-yl)-2,5-diphenyltetrazolium bromide is used to merasure the cell viability of the treated cells. NAD(P)H- dependent oxidoreductase enzymes are only present in the viable cells which actually reduce the MTT to a purple coloured insoluble crystalline compound named formazan. MCF-7 cells were maintained in the DMEM medium and the cells were counted using a haemocytometer and adjusted to a number of 20,000 cells per ml. 200 ?L cell suspension was seeded into each well of 96 well plate in triplicate5,6. Drug treatment was given at concentrations of 10,20,30,40 and 50 ?g/ml in DMEM with 2?S. Standard drug Gefitinib was given at the same concentrations. The absorbance were taken using a plate reader.
Neutral Red Uptake Assay
The cell viability or cytotoxicity can be assayed using neutral red uptake estimation method. It the number of viable cells in the culture is estimated quantitatively. The principle of this method is the incorporation of neutral red dye into the lysosome of the cell. Neutral red belongs to the class of cationic dyes and it will get permeated into the cell lysosome via non-ionic diffusion and binds to the phosphate groups of the lysosome through hydrogen bonding. For this assay also MCF-7 cells were used. The cells were counted and 200 microlitres of cell suspension were given in each well plates. AV79 was given in 10,20,30,40 and 50 ?g/ml in DMEM with 2?S. Gefitinib was employed as the standard drug in the same concentrations7.
Apoptosis Assay by Acridine Orange and Ethidium Bromide Double Staining
Double staining by Acridine Orange and Ethidium Bromide is a marker for apoptosis. Both are DNA binding dyes which are used to examine the apoptotic and necrotic cells morphologically. The viable and non-viable cells take up the acridine orange stain and emit green fluorescence. This stain gets intercalated into the DNA of both these cells. But ethidium bromide is only taken up by non viable apoptotic cells. This emits red fluorescence8. Living cells shows green nucleus. Early apoptotic cells with condensed chromatin have a bright green nucleus on staining. Late apoptotic cells with chromatin condensation show orange-stained nuclei. Necrotic cells are identified by orange to pink -stained cell nuclei. Drug treatment was given at concentration of 50 ?g/ml when the MCF-7 cells were confluent. Cells were stained with a mixture of AO (100 ?g/ml) and EB (100 ?g/ml) at room temperature for 10min. Cells are observed in a fluorescence microscope in blue filter (Olympus CKX41 with Optika Pro5 camera).
Transwell Migration Assay
Cells are migrated from one area to another in response to certain chemical signals for achieving processes like cellular differentiation, repair, development and metastasis. Cell migration is one of the reason for tumor metastasis. This particular assay is used to detect the migratory potential of cells in response to inducers or inhibitors. Transwell migration assay is also known as the Boyden or modified Boyden chamber assay. For this assay MCF-7 cell lines were cultured in DMEM supplemented with 10?S. This system uses a hollow plastic chamber sealed at one end with a porous membrane. This is suspended overa chamber containing chemoattractants. Cells are placed inside the chamber and through the pores to the other side of the membrane cells are allowed to migrate. Staining of the migrated cells are done using crystal violet. View underneath an inverted microscope and count the number of cells in different fields of view to get an average sum of cells that have migrated through the membrane toward the chemo-attractant and attached on the underside of the membrane. Here the drug is given in the concentration of 50 ?g/ml. The standard drug Gefitinib was also given in the same concentration9.
DAPI Staining
4?,6-diamidino-2-phenylindole (DAPI) stains the double stranded DNA. On binding with the AT clusters of double stranded DNA it emits blue fluorescence. Both live and fixed cells can be stained using this. This staining method is used to determine the number of nucleus of cancer cells, their cellular morphology can be determined and is a major tool to study nuclear fragmentations. 300 ?L of 300 nM DAPI stain solution was added to each well without direct exposure to light and incubated for 10 minutes. The cells were washed three times with PBS to remove excess stain. The cells were imagined using fluorescence microscope and photographs were taken at DAPI filter. Absorption wavelength is 358nm and emission wavelength is 461nm10.
RESULTS AND DISCUSSION
EGFR ELISA COLORIMETRIC ASSAY
The EGFR In-Cell ELISA Colorimetric Assay for AV79 is performed. Gefitinib was used as the standard.The absorbance values and % EGFR inhibition values produced by various concentrations of Gefitinib and AV79 are noted. The value is expressed as Mean±SEM.
Table 1: Percentage EGFR inhibition of various concentrations of AV79 and Gefitinib by EGFR In-cell ELISA Colorimetric assay
|
Treatment |
Concentration(?g/) |
Percentage EGFR inhibition |
|
AV79 |
10 |
60.87±0.2478 |
|
20 |
68.60±0.6914 |
|
|
30 |
70.61±0.3307 |
|
|
40 |
75.54±0.2745 |
|
|
50 |
76.46±0.1676 |
|
|
GEF |
10 |
80.74±0.2667 |
|
20 |
82.06±0.3298 |
|
|
30 |
85.53±0.9142 |
|
|
40 |
86.91±0.3553 |
|
|
50 |
87.87±0.1676 |
N=3, Values are expressed as Mean ± SEM; Data were analysed by One-way ANOVA followed by Bonferroni’s Multiple Comparison Test.

Figure 1: Percentage EGFR inhibition of various concentrations of AV79 and Gefitinib by ELISA Colorimetric Assay
The percentage of EGFR inhibition was found out from the absorbance data sets. It was found that Gefitinib has got significant inhibition even in low concentrations. At 10µg/ml Gefitinib produced 80.74±0.2667% inhibition. At high concentration Gefitinib has got 87.87±0.1676% EGFR inhibitory activity. AV79 at low concentration, 10µg/ml showed 60.87±0.2478% inhibition. At high concentration, 50µg/ml AV79 produced 76.46±0.1676 inhibition. Gefitinib has got greater EGFR inhibitory activity compared to AV79. Since AV79 has got almost 70?ove inhibition in all the concentrations, it is clear AV79 is a good candidate in inhibiting the EGFR receptor signaling.
MTT Assay
Table 2: Percentage viability of MCF-7 cells after 24hour treatment with AV79 by MTT assay
|
Treatment |
concentration(?g/ml) |
Percentage viability after 24 hour treatment |
|
Untreated control |
- |
100 |
|
DMSO control |
- |
93.50 ±1.90 a* |
|
AV79 |
10 |
82.72±0.9492 a,a*,b |
|
20 |
71.94±1.135 a,a*,b |
|
|
30 |
53.70±1.1299 a,a*,b |
|
|
40 |
24.26±0.8804 a,a*,b |
|
|
50 |
18.16±0.7040 a,a*,b |
|
|
GEF |
10 |
61.19±2.408 a,a* |
|
20 |
44.37±1.946 a,a* |
|
|
30 |
34.68±0.9144 a,a* |
|
|
40 |
18.80±0.7236 a,a* |
|
|
50 |
14.62±0.9574 a,a* |
N=3, Values are expressed as Mean ± SEM; Data were analysed by One-way ANOVA
followed by Bonferroni's Multiple Comparison Test. F value – 6.045, R2 – 0.9946
a,a*: p< 0>
a*, a*,b : p< 0>
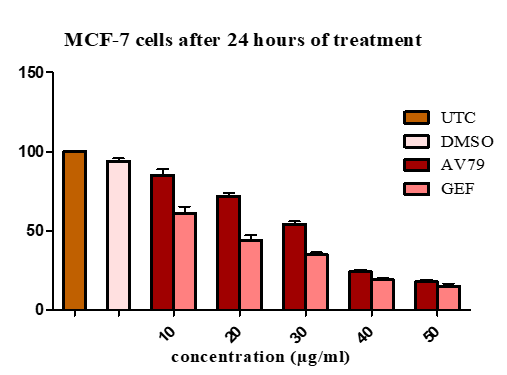
Figure 2: Percentage viability of MCF7 cells after 24 hour treatment by MTT assay
Neutral Red Uptake Assay
The percentage viability of MCF-7 shows a dose-dependent decrease in the case of AV79 treament and Gefitinib treatment. Greater percentage viability is observed in the case of lower dose, 10µg/ml in both AV79 and GEF treated cells. Highest cytotoxicity i.e. lowest percentage viability is observed in the dose of 50µg/ml in both the treatment. The minimum percentage viability in MCF-7 cells was found to be 20.52±0.60 in AV79 treatment and 14.62 ± 0.9574 in GEF treated cells.
Table 3: Percentage viability of MCF-7 cells after 24hour treatment with AV79 by Neutral red assay
|
Treatment |
concentration(?g/ml) |
Percentage viability after 24 hour treatment |
|
Untreated control |
- |
100 |
|
DMSO control |
- |
93.50 ±1.90 a* |
|
AV79 |
10 |
82.55±0.56 a,a*,b |
|
20 |
82.55±0.56 a,a*,b |
|
|
30 |
54.51±0.68 a,a*,b |
|
|
40 |
26.72±0.95 a,a*,b |
|
|
50 |
20.52±0.60 a,a*,b |
|
|
GEF |
10 |
61.19±2.408 a,a* |
|
20 |
44.37±1.946 a,a* |
|
|
30 |
34.68±0.9144 a,a* |
|
|
40 |
18.80±0.7236 a,a* |
|
|
50 |
14.62±0.9574 a,a* |
N=3, Values are expressed as Mean ± SEM; Data were analysed by One-way ANOVA
followed by Bonferroni's Multiple Comparison Test.
a,a*: p< 0>
a*, a*,b : p< 0>

Figure 3: Percentage viability of MCF-7 cells after 24 hour treatment by neutral red assay
Apoptosis Assay By Acridine Orange And Ethidium Bromide Double Staining
DMSO treated MCF-7 cells showed green fluorescence indicating the living cells with normal green nucleus. MCF-7 cells treated with 50µg/ml of AV79 emitted red-orange fluorescence with condensed or fragmented chromatin. This indicates the late apoptotic stage. So it is clear that the mechanism by which AV79 inducing cytotoxicity is Apoptosis. In early apoptotic stage, cells will show bright green nucleus with condensed or fragmented chromatin and in case of necrotic cells it will show uniformly orange to pink -stained cell nuclei.

Figure 4: MCF-7 cells stained by AO and EtBr
A: MCF-7 cells, DMSO control
B: MCF-7 cells, AV79 50µg/ml
Transwell Migration Assay
The migratory potential of AV79 was examined by transwell migration assay. MCF-7 cells were used to perform this assay. The migratory response of DMSO Control group and AV79 (50µg/ml) were evaluated.

Figure 5: Crystal violet stained images of the migrated cells in the transwell chamber
A - Control, B – AV79 50µg/ml
|
Sample |
No: of cells |
Sample |
|
Control Insert |
608.0 ±29.51 |
Control Insert |
|
Sample Insert |
312±41.92 |
Sample Insert |

Figure 6: Migration of MCF-7 cells after 24 hour treatment
The number of cells migrated to the lower surface of the membrane was stained and counted. The number of cells migrated in the DMSO control was found to be 608±29.51. AV79 treated cells showed significant reduction in the migratory response when compared to control. The number of cells migrated after 24 hours of AV79 treatment was found to be 312±41.92. The results suggest that the drug candidate has got significant effect in inhibiting the migration of tumor cells.
DAPI Staining
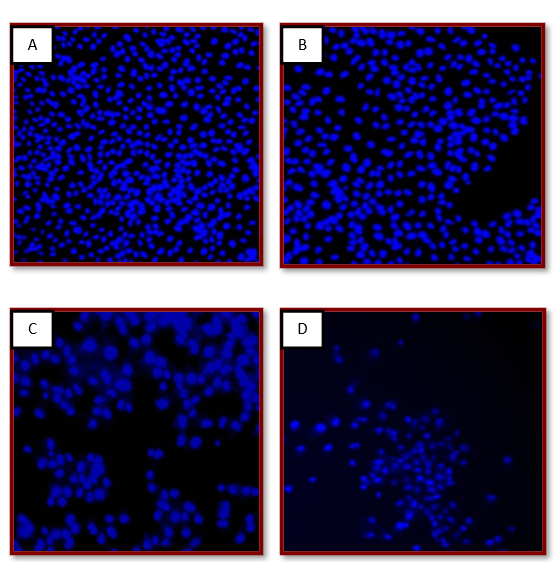
Figure 7: Representative image of the analysis of nuclear fragmentation and condensation of MCF-7 by DAPI staining
A: Untreated MCF-7 cells B: MCF-7 cells; DMSO control
C: MCF-7 cells treated with 10 ?g/ml AV79 D: MCF-7 cells treated with 50?g/ml AV79
In the case of untreated control and DMSO control nuclei was appeared normal. In the case of drug treated cells the nuclear condensations and fragmentation was evident. There is dose-dependent increase in the fragmentation of the AV79 treated nuclei.
CONCLUSION
The thienopyrimidine derivative Ethyl 4-(chlorophenyl amino)-5 methyl thieno[2,3-d]pyrimidine-6-carboxylate i.e. AV79 is evaluated for its anticancer potential. The drug showed significant activity against cancer in the in-vitro cell culture medium when the results of MTT assay, neutral red assay, DAPI staining, transwell migration and acridine orange-ethidium orange double staining are analysed.
ACKNOWLEDGEMENT: Nil
Conflict Of Interest : The authors declare that there are no conflicts of interest.
REFERENCES


Vismaya Babu K. K.*, Roopesh P. T., Sivaranjini S., Evaluation of Ethyl 4-(Chlorophenyl Amino)-5 Methyl Thieno[2,3-D] Pyrimidine-6-Carboxylate for Its Anticancer Activity Focusing on EGFR Inhibition, Int. J. of Pharm. Sci., 2024, Vol 2, Issue 12, 2588-2596. https://doi.org/10.5281/zenodo.14535564
 10.5281/zenodo.14535564
