Abstract
The main objective of this study was to formulate a transdermal patch of ketoprofen to enhance patient compliance and avoid first-pass effects, thereby improving its bioavailability. To develop a suitable transdermal patch of ketoprofen, it was quantified by UV spectroscopy at a ?max of 258 nm, using polymers with different ratios (Ethyl Cellulose and HPMC E5) with PEG400 as the plasticizer, oleic acid as the permeation enhancer, and methanol and chloroform as the solvent system. Transdermal patches containing ketoprofen were prepared using a solvent-casting technique. Formulations F1, F2, F3, F4, and F5 were composed of a drug and polymer in a ratio of 4:2. Evaluation parameters of the transdermal patch, such as thickness, weight variation, moisture content, drug content, folding endurance, and in vitro diffusion study. Drug-polymer interaction studies carried out using FTIR showed that there were no incompatibilities between the drug and the other excipients.
Keywords
Transdermal, Drug, Delivery, Evaluation
Introduction
Transdermal drug delivery has developed over the past two decades into an alluring and well-accepted technology because it minimizes and avoids the drawbacks associated with conventional and parenteral drug administration, such as speak and valerian phenomena, which show fluctuations in plasma drug concentration levels, injections, and both routes’ limited controlled release options. Dermal drug delivery systems are topically applied medications in the form of patches that release their systemic effects at a set and regulated rate. Transdermal drug delivery systems (TDDSs) make it possible for therapeutic doses of pharmacological compounds to be administered through the skin and into the bloodstream for systemic effects. Stoughton introduced the concept of chemical material absorption through the skin using silicone oils for the first time in 1965. In December 1979, the U.S. Food and Drug Administration approved the first scopolamine transdermal patch for motion sickness, marking a significant advancement in transdermal drug delivery. There is a developing understanding that continuous medication delivery into the systemic circulation can be achieved using the intact skin as the port of drug administration, closely duplicating the advantages of intravenous infusion without any of its risks This is referred to as transdermal administration, and the drug delivery methods are referred to as “transdermal therapeutic systems” or more commonly as “transdermal patches." A transdermal patch, also known as a skin patch, is an adhesive patch that is applied to the skin and contains medication that is intended to be absorbed into the bloodstream through the skin. Transdermal therapy systems are defined as self-contained dosage forms that deliver drugs to the bloodstream at a controlled rate through the skin. Transdermal drug delivery systems administer a set amount of medication at a controlled pace to the surface of healthy skin through adhesive drug-containing devices with a specific surface area. Transdermal drug delivery systems offer advantages over oral dosing by ensuring consistent medication delivery, enhancing product stability, improving bioavailability, and avoiding the fluctuations associated with pulse dosing, maintaining a steady rate for an extended period.1 Ketoprofen is chemically 2-(3-benzoylphenyl)-propionic acid, the structure of ketoprofen shown in Fig. 1.

Fig.1: Structure of Ketoprofen
It belongs to a class of non-steroidal anti-inflammatory drugs (NSAIDs). It is used as an analgesic and an anti-inflammatory drug. Ketoprofen specifically reduces inflammation by blocking cylooxygenase-2 (COX-2), an enzyme that is essential for prostaglandin synthesis via the arachidonic acid pathway. Pain, fever, and inflammation are thus reduced as a result of the decrease in prostaglandin contents.2
Merits and Demerits of TDDS: 3
Merits of TDDS
- Reduced dose frequency owing to improved bioavailability and longer duration of action.
- Consistent blood drug levels are made possible by steady drug penetration into the skin, which is frequently an objective of therapy.
- Lessened side effects and toxicity from transdermal medicine can be mitigated by removing the patch.
- Topical patches are an easy, non-invasive approach for obtaining drugs into the body.
- This method of drug delivery is efficient for medications that are extensively destroyed by the liver, poorly absorbed from the gut, or broken down by stomach acids.
- For those who cannot or do not want to take drugs or vitamins orally, transdermal patches are an alternative.
- This is quite helpful for individuals who are quiet or unconscious.
- Topical patches are practical and affordable; one aspect of particular note in some patches is that they need to be applied only once a week. Patient adherence to pharmacological therapy can be facilitated using a straightforward dose schedule. Transdermal patches have been effective inminimizing first-pass drug degradation effects and creating novel therapeutic applications for currently available medications.
Demerits as well as limitations of TDDS: 3
- Many medications, especially those with hydrophilic components that penetrate the skin too slowly, may not work as intended.
- Local erythema, itching, and edema can be induced by medication, adhesive, or any excipients in the patch formulation.
- Ionic medicines cannot be delivered using TDDS.
- TDDS cannot achieve high drug concentrations in the plasma or blood.
- Drugs with large molecular sizes cannot be created using TDDS.
- Pulsatile medication delivery is not possible with TDDS.
- If a medicine or formulation irritates the skin, TDDS cannot be established.
- According to Latheeshjlal et al. (2011), the barrier function of the skin varies from one place to another in the same individual, from person to person, and with age.
MATERIALS AND METHODS:
Chemicals:
Ketoprofen was purchased from BLD pharma tech (India) Pvt. HPMC E5 was purchased from Prayogina laboratories, Ethyl Cellulose and Eudragit RL 100 were purchased from Yarrow chem. product. Dialysis membrane was purchased from Hi-Media Laboratories Ltd., Mumbai, India. All other laboratory chemicals and reagents used in the study were of either pharmaceutical analytical grade.
EXPERIMENTAL WORK:
Preformulation studies
- Color, odor, taste, and appearance.
The color, odor, and appearance of the drug samples were evaluated.
- Determination of solubility.
The solubility of ketoprofen was evaluated by dissolving excess quantities of the drug in the solvent.
- Determination of the melting point
A melting apparatus was used to determine the melting point of the drug sample using the capillary method. A small quantity of drug was placed in a capillary tube (fused at one end) and placed in a melting point apparatus, and the melting temperature was recorded.
- Fourier Transform Infrared (FTIR):
Before formulating the drug substance into a transdermal patch (dosage form), preformulation studies were carried out to establish the physicochemical characteristics of the drug (TPM) and its compatibility with different excipients. Compatibility study of drug with the excipients was determined by Fourier transform infrared (FTIR) spectroscopy.4
- Calibration curve of Ketoprofen:
Approximately 20 mg of the drug was dissolved in 100 ml of phosphate buffer (pH 7.4) to prepare a 100 µg/ml solution. From this solution, 1 ml was withdrawn, and the volume was made up to 100 ml with phosphate buffer (pH 7.4) to prepare the stock solution. The solution containing 2 ?g/ml ketoprofen was scanned over the wavelength range of 200–400 nm using a UV-Vis spectrophotometer to determine the wavelength of maximum absorbance.
- Dose Calculation of Ketoprofen for Transdermal Patch: 5
Diameter of the Petridish = 7.7 cm
Radius = Diameter/2 = 7.7/2 = 3.85 cm.
Area of Petridish A= ?r2 =3.14 X 3.85 X 3.85 = 46.54 cm2
Now, Dose is 10 mg and cut the pieces in 2 cm X 2 cm = 4 cm2
4 cm2 contain 10 mg drug,
So, 46.54cm2 contain (?)
Amount of Drug ~ 116.35 mg each batch
Formulation of Transdermal Patches:
Transdermal Patches containing Ketoprofen were prepared by solvent casting technique. All ingredients were mixed with suitable solvents until all ingredients were dissolved. Ketoprofen was added and stirred well in magnetic stirrer (20 min), until a homogeneous solution was obtained. The prepared solution was cast into a petri dish and dried at room temperature for 24 h. The evaporation rate was controlled by inverting the cut funnel over a Petri dish. Membranes were taken out, cut into 2cm x 2cm, stored in desiccators until further use.6 The compositions of the transdermal patches were shown in Table no-1 & 2
Table no-1: (A) Composition of Transdermal Patches
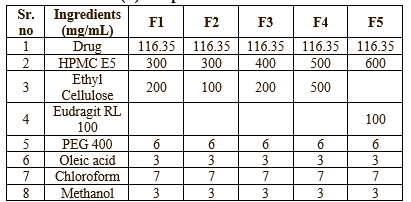
Table no-2 (B) Composition of Transdermal Patches
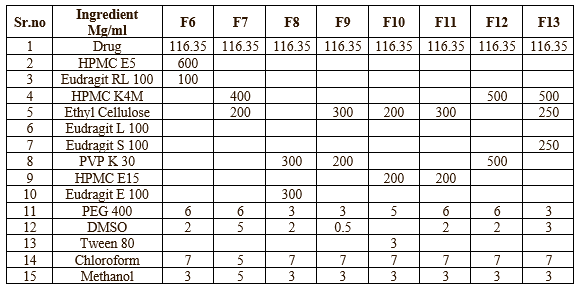
Evaluation of Transdermal Patch:
- Physical Appearance:
Formulated patches were assessed for their physical attributes, homogeneity, lack of air bubbles, or drug precipitation, which in large part influences whether or not a patient will accept the patch and its therapeutic effectiveness.7
2. Measurement of Weight and Thickness of the Prepared Patches: 8
Three patches of uniform shape and size were randomly selected from the prepared formulation, and the weight of each formulation was measured individually using digital balance9. Average weights were calculated. Similarly, three patches from each formulation were taken, the patch thickness was measured using a screw gauge at three different locations, and the mean value was calculated to be 10. The process was repeated for all prepared batches.
3. Folding endurance
The number of times that a particular portion of the film may be folded without tearing is what is meant by the term "folding endurance." The film was edited to an even size throughout (2X3 cm2). It was folded in half lengthwise at the center of the longer side between the thumb and finger, and then opened back up. This is referred to as the first fold. This was maintained until cracks started to develop on the fold, and the number of folds determined how durable the fold would be.11
4. Drug content uniformity
To measure the amount of drug entrapped in the transdermal patch, a 2 cm × 2 cm section of the patch was dissolved in 100 mL of phosphate buffer solution (pH 7.4). The patch and buffer solutions were placed on a shaker for 24 h to ensure complete dissolution of the patch. The solution was filtered to remove any undissolved debris. The drug concentration in the filtered solution was determined using a spectrophotometer at 258 nm wavelength. The drug content in the patch was calculated from the concentration and volume of the solution .12
5. Percentage of moisture loss:
The percentage of moisture loss was determined to check the integrity of the patch under dry conditions. This was performed as follows: The patches were weighed accurately and stored in desiccators containing anhydrous calcium chloride. After 3 days, the patches were removed and weighed.
Percentage of moisture loss formula
Percentage of moisture loss= initial weight-final weight/initial weight x 100
6. Percent moisture absorption
The patches were accurately weighed and placed in desiccators at 80-90% is maintained by using a saturated solution of potassium chloride. The patches were kept until a uniform weight was obtained, and then removed and weighed. The percentage moisture uptake was calculated as the difference between final weight (W2) and initial weight (W1) with respect to initial weight.6
The percent moisture absorption formula is as follows:
Percent moisture absorption= (W2-W1) / W1 X 100
7. Moisture vapor transmission (MVT) :
To determine the moisture vapor transmission rate (MVT), one gram of calcium chloride was weighed and placed in a dried, empty vial. The transdermal patch was placed over the vial opening and sealed in place with silicone adhesive grease. The adhesive was allowed to settle for 5 minutes. The vial was placed in a chamber maintained at 68% relative humidity.
The MVT was calculated using the following formula:
MVT = w ST
Where, w = change in weight,
S = area of the patch exposed in square centimetres, and
T = time of exposure in hours
8. In vitro diffusion studies:
In vitro drug diffusion studies were performed using a 25 ml Franz diffusion cell. A synthetic membrane was used to prepare the skin samples. The membrane was stabilized before mounting to remove the soluble components. The membrane was mounted between donor and receptor compartments. The receptor compartment was filled with 25 ml of phosphate buffer (pH 7.4), which was maintained at 37± ± 0.2 oC, and hydrodynamics were maintained using a magnetic stirrer. One patch (2 cm × 2 cm) was moistened with a few drops of phosphate buffer (pH 7.4) and placed in the donor compartment. Samples (3 ml) from the receptor compartment were withdrawn at suitable time intervals of 1, 2, 3, 4, 6, and 8 h and then replaced with 3 ml of phosphate buffer (pH 7.4). The percentage of drug permeated was determined by measuring the absorbance in a UV-visible spectrophotometer at a ?max of 258 nm.
RESULT & DISCUSSION
1. Preformulation Study
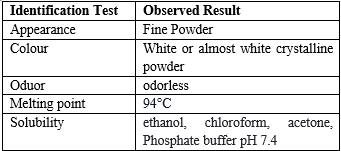
Table- 3 Organoleptic characterization of drug:
-
Standard Calibration Curve:
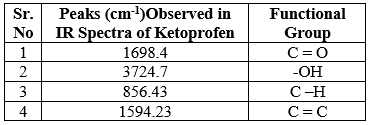
Table 4: Absorbance of Ketoprofen
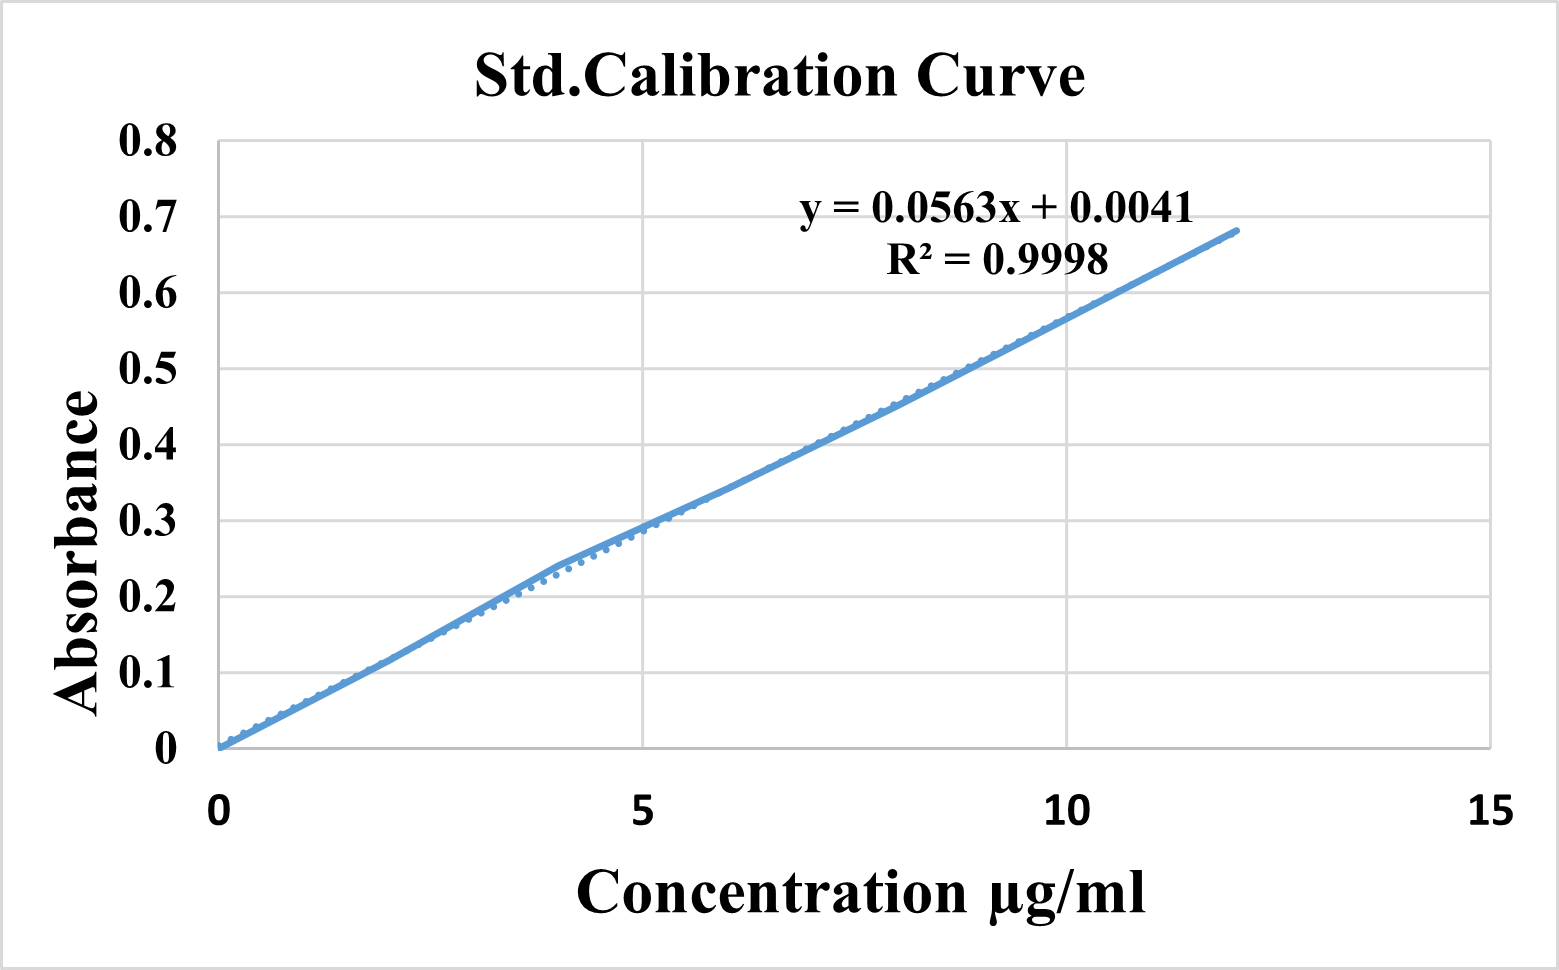
Fig 2: Standard calibration curve for Ketoprofen
Fourier Transform Infrared (FTIR):

Fig 3: IR spectra of Pure Drug Ketoprofen

Table No. 5: IR interpretation of Ketoprofen

Fig no: 4 FTIR spectra of optimised formulation
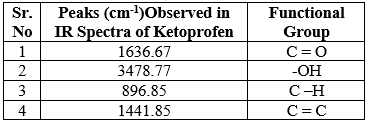
Table No. 6: IR interpretation of optimised formulation
Evaluation Parameters:
Table No.7: Result of Evaluation Parameters:

In vitro diffusion release study
In vitro release profile of Ketoprofen transdermal patch of batches F1 to F5 ie. Batch A shown in table respectively and cumulative % release data for its recorded in table respectively. The obtained result indicates that the rate and extent of drug release decreased as concentration of polymer increased in the formulation. The difference in the cumulative present release of different formulation was found to be significant. Batch F3 shows highest drug release which may be due to decrease in the concentration of polymer.
Table No.8: In vitro Diffusion release study

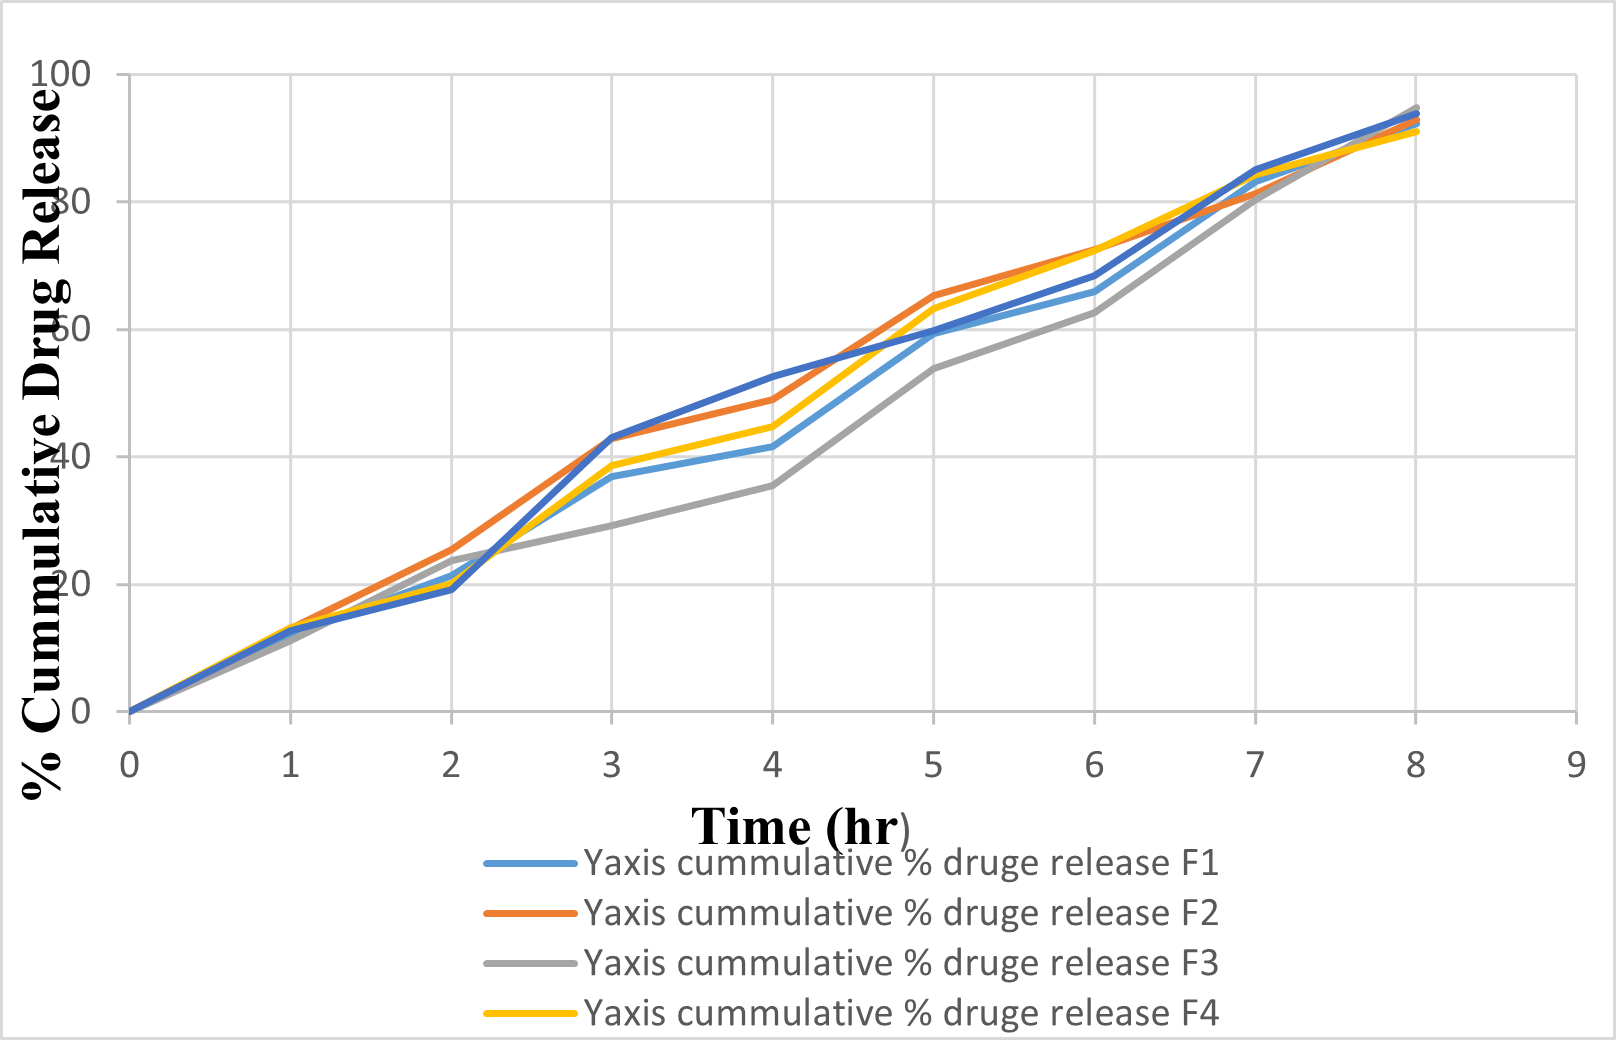
Fig 5 : % Cumulative drug diffusion profile of Batch F1 to F5
Drug diffusion release kinetic Study
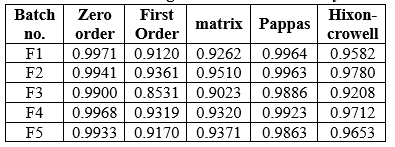
The kinetic models and fixed equations used to explain the release kinetics of the Ketoprofen transdermal patch varied for all formulations. The tables below display the regression coefficients (R) calculated for the different kinetic models. The R values were considered for both first-order and zero-order models. It was observed that the R values for the zero-order models were higher for formulation F3 compared to the first-order models. Consequently, it is evident that the drug release from the optimized batch F3 formulation followed zero-order kinetics.
Table No.9: Drug Diffusion kinetic Study
Stability study:
A stability study was carried out at 40 °C (75% RH) for one month. 2x2 cm2 patch from the optimized formulation was packed in butter paper, followed by aluminium foil. After 1 month, the patches were evaluated for their physical appearance, drug content and diffusion study. All the test were found to be in limits. Hence the formulation were stable under stated storage condition.
CONCLUSION:
There were total 14 batches of different polymers with different concentration were prepared. Out of 14 batches, 9 batches were found to be unstable and unsuitable for further development, where as the remaining five batches were stable, and so drugs were added to these five batches, and then these batches were evaluated for folding endurance thickness, drug content, weight uniformity, and moisture absorption studies, Moisture loss studies, stability studies, and in vitro diffusion studies.
On the basis of In vitro drug diffusion study and all other parameters, batch F3 was selected as optimized batch. F3 batch containing drug and polymer HPMC E5 and Ethyl cellulose in the ratio of 4:2 respectively. It showed satisfactory percent drug diffuse that is 94.74% and also better result of other evaluation parameter like Drug content was 93.64, folding endurance test 143.It follows Zero order release kinetic model .Hence on the basis of these evaluation parameter batch F3 was optimized
REFERENCES
- Yelamanda Jagadeeshetal. FutureJ.Pharm.Health.Sci.2023; 3(3):346-355.
- Trivedi and Goyal / International Journal of Pharmaceutical Chemistry and Analysis 2020;7(2):87–97
- Jajoo VS, Shrirame DS, Sawale AV, Atram SC, Formulation and evaluation of Transdermal Patc h for the treatment of Migraine, Journal of Drug Delivery and Therapeutics. 2023; 13(5):47-52
- Cherukuri S, Batchu UR, Mandava K, Cherukuri V, Ganapuram KR. Formulation and evaluation of transdermal drug delivery of topiramate. Int J Pharma Investig 2017; 7:10-7.
- Int. J. Pharm. Sci. Rev. Res., 69(2), July - August 2021; Article No. 11, Pages: 69-74.
- Ananthalakshmi D, Sravya E, Rakesh K, Aishwarya P, Sivaparvathi S, Prasanna VK, Satyanarayana T. formulation and evaluation of transdermal patches of metoprolol succinate.
- Narkhede Sachin B, Maisuria P, Kuvavala Fiza A, Lad Raj N, Maheta Meet K, Mistry Harsh S. formulation and evaluation of glycerogelatin based meloxicam transdermal patch. epra International Journal of Research and Development (IJRD). 2023 Aug 15;8(8):81-5.
- Baishya D, Choudhury A, Yakin J, Deka H, Dey BK. Formulation and Evaluation of Oxyphenbutazone Transdermal Patches.
- V. B. Kanabar, V. P. Patel, and S. M. Doshi, “Formulation and evaluation of transdermal patch of cefdinir with various polymers,” The Pharma Innovation, vol. 4, no. 6, Part B, p. 74, 2015.
- U. Nautiyal and D. Singh, “Formulation and characterization of transdermal patches of losartan,” Ind. J. Pharmaceut. Biol. Res, vol. 1, no. 1, 2013.
- Chaudhari VK, Bhargava V. Study on the formulation of transdermal patches of zolpidem tartrate therapy.
- Valeveti Sk, pashikanti s. design, development, and evaluation of transdermal patches containing memantine hydrochloride. Int J App Pharm. 2023;15(5):181-97.


 Vaishali A. Dhurve*
 M. A. Channawar


 10.5281/zenodo.11380925