1 Sudhakarrao Naik Institute of Pharmacy, Pusad- 445204,
2 Sant Gadage Baba Amravati University.
With a biological half-life of two hours and antifungal action, clotrimazole has numerous gastrointestinal adverse effects when taken orally. Three polymers—Eudragit RS-100, Hydroxymethyl Propyl Cellulose (HPMC), and Ethyl Cellulose (EC)—were used in the solvent casting procedure to create the transdermal patch with clotrimazole in order to overcome these negative effects. Propylene glycol was used as a plasticizer and penetration enhancer, and methanol and dichloromethane were used as solvents at the same concentration. The FTIR spectrophotometer was used to analyse the compatibility study for each produced patch. The produced patches were assessed for their drug concentration, thickness, folding endurance, weight change, moisture content, and in-vitro permeation testing. Further prepared patches characterized for scanning electron microscopy. According to the results, the combination of three polymers exhibits favourable physical characteristics, and formulation F3 exhibits more drug release than formulations with two polymers.
Transdermal drug delivery offers several advantages over conventional routes, including enhanced bioavailability, reduced dosing frequency, improved patient adherence, and the avoidance of first-pass metabolism. Moreover, this method reduces gastrointestinal side effects, making it an attractive alternative for patients with digestive disorders or difficulty swallowing pills. However, despite these benefits, transdermal delivery faces challenges such as limited drug permeability, variability in skin absorption among individuals, and the potential for skin irritation. [1] A transdermal patch is used to deliver a specific dose of medication through the skin and into bloodstream. The FDA initially approved transdermal patches in 1981.[2] In the current era of pharmaceutical dosage forms, transdermal drug delivery formulations have left a noticeable mark. In the field of innovative drug delivery systems, it has shown to be one of the most effective. Understanding these innovative new drug delivery methods requires a solid understanding of physiology and the fundamentals of new technology. There is a lot of potential in using the dermal layer as a drug administration site for both systemic and local effects. The skin is a very effective barrier to medication penetration; hence enhanced techniques are frequently required. Additionally, topical use minimizes drug systemic inactivation, reduces gastrointestinal incompatibility and severe toxicological risk. When transdermal patches are applied to the skin, polymeric preparations distribute the medication across the dermis by a predefined amount to produce a generalized systemic effect.[3]
ADVANTAGES OF TRANSDERMAL DRUG DELIVERY SYSTEM[4-6]
DISADVANTAGES OF TRANSDERMAL PATCHES[7-10]
METHODOLOGY
2.1 Materials [15-18]
Clotrimazole was Purchased from Dhamtec Pharma, Mumbai Eudragit RS-100, HPMC, Ethyl cellulose, Propylene glycol, DCM, Methanol was purchased from Central Drug House Pvt. Ltd.
2.2 Method [19-21]
Preparation of Clotrimazole transdermal patches
The solvent casting process was utilized to create the clotrimazole-loaded transdermal patch. Film-forming polymers such as Eudragit RS-100 were combined with hydroxy propyl methylcellulose (HPMC), ethyl cellulose, plasticizer, and penetration enhancer propylene glycol. The polymers eudragit RS-100, HPMC, and ethyl cellulose were first precisely weighed and then dispersed separately in a solution of dichloromethane (DCM) and methanol (1:1). After the medication was distributed throughout the polymeric solution, propylene glycol was added as a plasticizer and penetration booster. A magnetic stirrer was used to mix the solution. The entire solution was then carefully poured into the glass petri dish, and an inverted funnel was set over the dish to prevent abrupt evaporation. For a whole day, this solution was allowed to dry at room temperature. The processed film was then split and stored in desiccators until the evaluation tests were completed in self-sealing plastic envelopes.
EXPERIMENTAL WORK:
Procurement of Drug:
Pre-formulation study of Drug: [22-24]
Pre-formulation research is a crucial step before developing any kind of medication delivery system. It provides the details required to identify whether the drug release is due to diffusion or dissolution. Therefore, pre-formulation analyses, such as solubility analysis, melting point determination, and FTIR examination of the drug, are performed on the resulting drug sample for identification. ?-max determination, calibration curve creation, and assay.
Physical appearance and melting point determination: [25-27]
The melting point determination of the obtained sample was done as it is a good first indication of the purity of the sample.
FTIR Study of Drug: [19]
FTIR study is another identification test for drug. The FTIR spectra of pure Moxifloxacin hydrochloride and its mixture with polymer were determined.
Determination of Wavelength: [20]
A stock solution (1mg/ml) of clotrimazole was prepared in buffer. This solution was appropriately diluted with buffer to obtain a suitable concentration. Then scan the in-spectrum mode in range of 200-400 nm on UV- spectrophotometer to determine the maximum wave length of the drug.
Calibration Curve of Clotrimazole in Buffer Solution (pH 7.4) [21]
The stock solution was prepared by dissolving 100 mg of drug in 100 ml of buffer to get 1 mg/ml concentration solution. From the above solution, adequate aliquots were removed and diluted suitably to acquire final concentration from 1 to 10 g/ml. All the solutions were scanned through UV Spectrophotometer and absorbances were taken against a blank of STF at max of 264 nm.
Preparation of Transdermal patches: [22]
Table : composition of transdermal patches
|
Ingredient(mg)/ml |
F1 |
F2 |
F3 |
F4 |
F5 |
F6 |
F7 |
F8 |
F9 |
|
Drug |
60 |
60 |
60 |
60 |
60 |
60 |
60 |
60 |
60 |
|
Eudragit RS-100 |
100 |
100 |
150 |
150 |
175 |
200 |
200 |
250 |
250 |
|
HPMC K4M |
200 |
100 |
150 |
175 |
200 |
200 |
- |
250 |
300 |
|
Ethyl Cellulose |
100 |
200 |
100 |
50 |
50 |
100 |
200 |
50 |
- |
|
Polyvinyl glycol |
00.25 |
0.25 |
0.25 |
0.25 |
0.25 |
0.25 |
0.25 |
0.25 |
0.25 |
|
Dichloromethane (DCM) |
5 |
5 |
5 |
5 |
5 |
5 |
5 |
5 |
5 |
|
Methanol |
5 |
5 |
5 |
5 |
5 |
5 |
5 |
5 |
5 |
Evaluation of Transdermal patches:
Physical appearance: [23]
Prepared transdermal patches were inspected visually for clarity, uniformity, flexibility and smoothness.
Weight Uniformity Studies: [24]
Weight uniformity of patch was determined by taking weight of ten patches of sizes 2 cm² diameter from every batch and weigh individually on electronic balance. The average weights were then calculated.
Folding endurance: [25]
Folding endurance of prepared patches was determined by repeatedly folding a selected patch from the same place until it break. The number of times a film could be folded from the same place without braking gives the value of folding endurance.
Drug Content uniformity: [26]
Drug content study was performed in triplicate for each formulation. Drug content uniformity was determined by dissolving the patch (2 cm square in diameter) from each batch by homogenization in 100 ml of an isotonic phosphate buffer (pH 7.4) under stirring. The 2 ml solution was taken and diluted with isotonic phosphate buffer pH 7.4 up 10 ml, and the resulting solution was filtered through a 0.45 mm Whatman filter paper. The drug content was then determined after proper dilution using UV spectrophotometer.
In-Vitro permeation Release Study: [27-31]
In-vitro permeation studies of clotrimazole transdermal patches were carried out by using Static Franz diffusion cell with a receptor compartment capacity of 15 ml. The formulated patch of surface area of 2 cm² was placed in between the donor compartment and receptor compartment of diffusion cell over a cellulose acetate membrane of pore size 0.3µ The receptor compartment of diffusion cell was filled with phosphate buffer saline pH 7.4. The whole assembly was fixed on a magnetic stirrer and the solution in the receptor compartment was constantly and continuously stirred magnetic beads at 50 rpm; the temperature was maintained at 37±0.5°C. The 1 ml aliquots were withdrawal at different time intervals (0, 1, 2, 3, 4, 5, 6 ) hr analysed the drug content by UV spectrophotometer at 289 nm. The receptor phase was replenished with an equal volume of phosphate buffer (37°C) at each sample withdrawal, the cumulative amount of drug permeated per square centimetre of patches were plotted against time.
RESULT AND DISCUSSION
PRE – FORMULATION STUDIES:
Organoleptic characterization:
|
Sr.no. |
Characters |
Inference |
|
1 |
Nature |
White powder |
|
2 |
Colour |
White colour |
Solubility analysis:
|
Sr.no. |
Solvent |
Solubility |
|
1 |
Methanol |
Soluble |
|
2 |
Phosphate buffer |
Soluble |
Melting point determination:
|
Sr.no. |
Drug name |
Melting point |
|
1 |
Clotrimazole |
147-149°C |
The organoleptic characters and melting point was found to be as per standard drug, so drug used in the formulation was found to be pure according to 1. P. specifications.
DETERMINATION OF FTIR STUDIES:
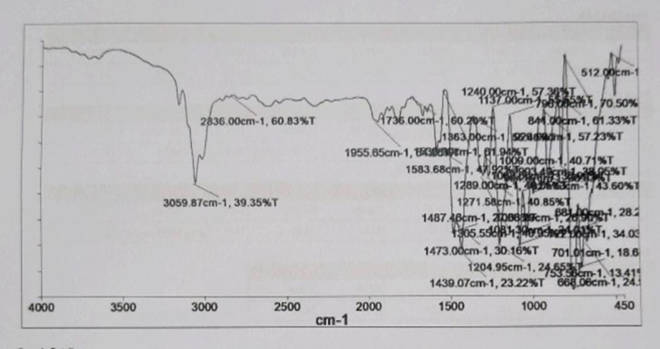
Fig.: FTIR of Drug clotrimazole

Fig.: FTIR of HPMCK4M
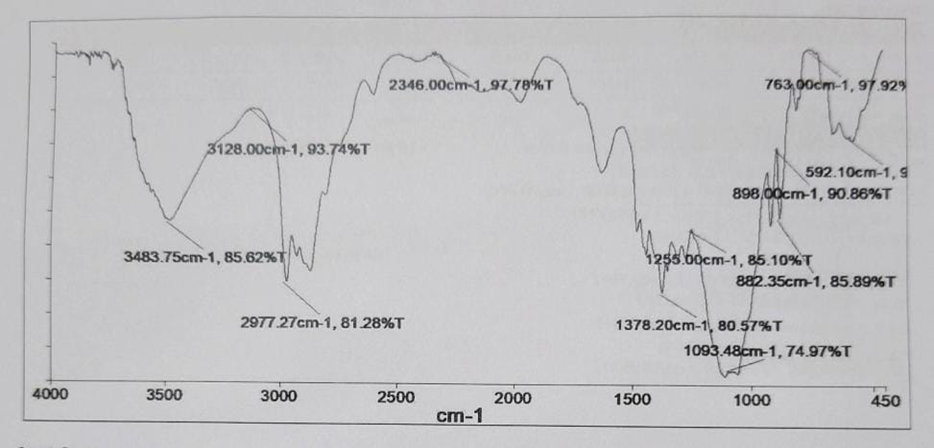
Fig.: FTIR of Eudragit RS-100
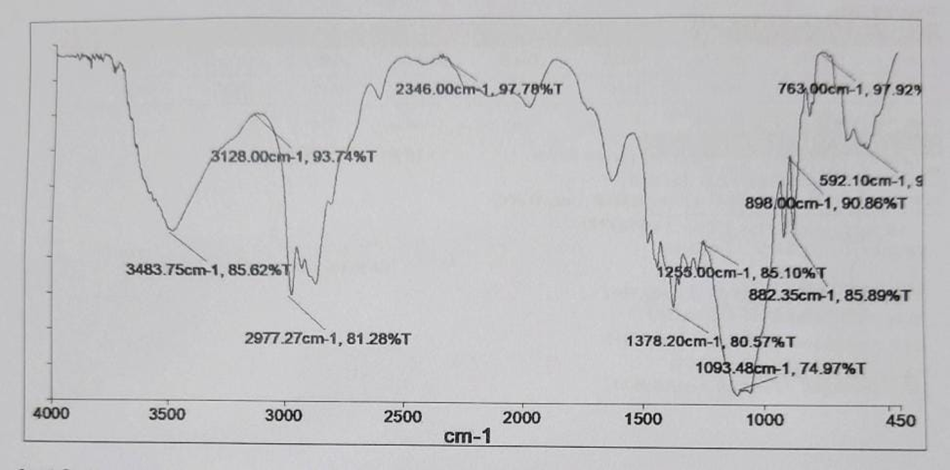
Fig. : FTIR OF ETHYL CELLULOSE
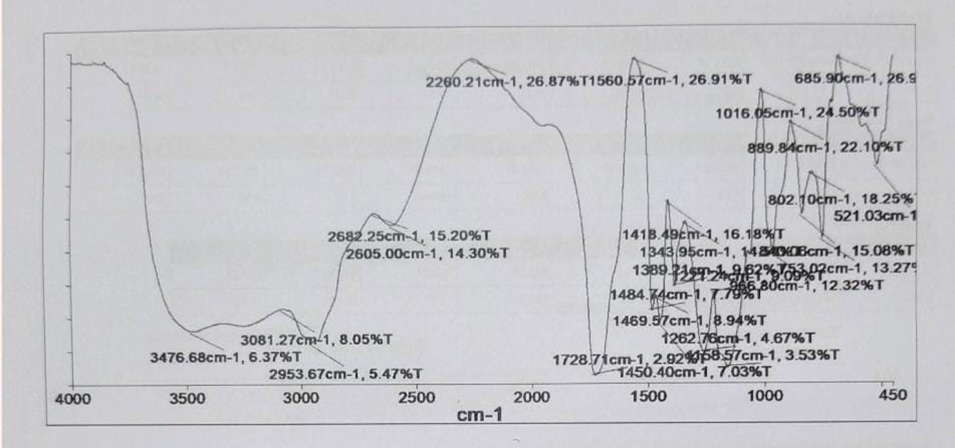
Fig.: FTIR of CLOTRIMAZOLE+ HPMCK4M+ ETHYL CELLULOSE +EUDRAGIT RS-100
FTIR spectrum of pure drug and mixture of drug and polymers are shown in figure as above. From the spectral study it was observed that there were no significant changes found in the peaks of pure drug and drug polymer mixture. Hence, no specific interaction was observed between the drug and the polymers used in the formulations.
DETERMINATION OF ? MAX:
Clotrimazole showed the maximum wavelength at 261nm, with matches with the standard. Hence drug used in formulation was found to be pure according to I.P. specification.
|
Sr.no. |
concentration(mg/ml) |
absorbance(nm) |
|
1 |
2 |
0.065 |
|
2 |
4 |
0.101 |
|
3 |
6 |
0.141 |
|
4 |
8 |
0.159 |
|
5 |
10 |
0.221 |
STANDARD CALIBRATION CURVE OF CLOTRIMAZOLE
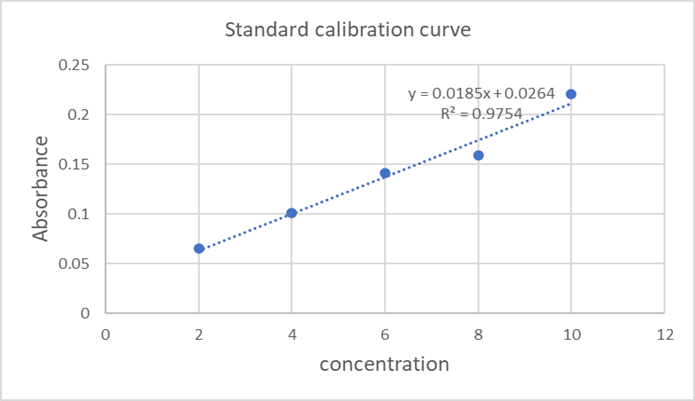
Fig.: Calibration curve of clotrimazole in buffer solution at 261 nm
EVOLUTION OF TRANSDERMAL PATCH:
The visual appearance and clarity of prepared formulations were shown in table as below. The appearances of all formulations were light yellow in Colour and clarity of all formulations were clear.
Table: Evolution of Transdermal patches
|
Formulation |
Weight Variation(mg) |
Folding Endurance |
% Moisture Absorbance |
% Moisture Loss |
Swelling Index (%) |
|
F1 |
29.5 ± 5.1 |
50 ±1.6 |
1.02±0.23 |
1.38±1.23 |
11.33±2.33 |
|
F2 |
24.5± 3.21 |
75±1.2 |
2.5±1.88 |
1.63±2.43 |
7.36±1.63 |
|
F3 |
27± 4.02 |
89±1.6 |
0.74±1 |
0.7±1.34 |
10.55±0.45 |
|
F4 |
25.7± 6.4 |
87±3.2 |
1.6±1.4 |
1.97±4.31 |
9.36±1.28 |
|
F5 |
27.96± 4.21 |
84±4.2 |
1.79±2.1 |
2.55±3.11 |
7.75±0.23 |
|
F6 |
28.5±3.2 |
74±3.2 |
1.19±0.46 |
2.20±1.64 |
11±3.4 |
|
F7 |
29.32±6.2 |
79±1.6 |
2.24±0.82 |
3.63±2.01 |
12.83±1.98 |
|
F8 |
26.24±8.4 |
67±1.8 |
3.67±0.71 |
4.31±1.89 |
9.83±4.6 |
|
F9 |
28.42±2.3 |
83±2.4 |
4.28±1.3 |
2.68±0.18 |
11.8±2.8 |
DRUG CONTENT DETERMINATION
Table : Drug content determination
|
Sr.no. |
Formulation |
Drug content (%) |
|
1 |
F1 |
89.01 |
|
2 |
F2 |
91.78 |
|
3 |
F3 |
94.37 |
|
4 |
F4 |
80.18 |
|
5 |
F5 |
90.61 |
|
6 |
F6 |
83.45 |
|
7 |
F7 |
87.87 |
|
8 |
F8 |
90.68 |
|
9 |
F9 |
96.09 |
In vitro drug release study of formulation:
All formulations exhibited this release at 12 hr and they exhibited sustained release effects and this could be due to increase in Carbopol concentration.
Table.: Determination of % drug release
|
Time (min) |
F1 |
F2 |
F3 |
F4 |
F5 |
F6 |
F7 |
F8 |
F9 |
|
60 |
9.08 |
15.89 |
18.32 |
11.61 |
14.77 |
9.17 |
12.49 |
10.87 |
14.04 |
|
120 |
15.08 |
22.62 |
25.54 |
16.20 |
20.76 |
15.3 |
18.01 |
15.38 |
17.11 |
|
180 |
21.16 |
29.27 |
32.7 |
20.61 |
25.22 |
20.61 |
21.27 |
21.59 |
21.42 |
|
240 |
27.08 |
36.0 |
40.13 |
27.77 |
31.9 |
25.34 |
28.95 |
28.50 |
27.77 |
|
300 |
33.08 |
43.13 |
47.18 |
32.19 |
36.32 |
31.38 |
32.42 |
33.43 |
34.14 |
|
360 |
34.37 |
49.86 |
54.56 |
39.08 |
40.05 |
35.0 |
38.4 |
40.3 |
41.03 |
|
420 |
43.54 |
44.27 |
61.78 |
41.53 |
48.40 |
40.48 |
42.65 |
47.52 |
48.02 |
|
480 |
52.70 |
56.67 |
69 |
56.20 |
53.91 |
48.09 |
54.78 |
54.17 |
55.39 |
|
540 |
61.94 |
70.45 |
76.21 |
59.91 |
60.32 |
59.9 |
60.55 |
60.69 |
63.96 |
|
600 |
71.02 |
77.27 |
83.43 |
70.55 |
71.02 |
70.55 |
68.93 |
68.61 |
72.17 |
|
660 |
80.18 |
84.34 |
89.8 |
80.42 |
80.18 |
76.37 |
75.57 |
79.35 |
82.85 |
|
720 |
89.35 |
91.37 |
94.29 |
88.57 |
90.16 |
84.51 |
87.72 |
90.08 |
92.62 |
The % drug release for formulation F3 was found to be between 18.32 % to 94.27%.
CUMULATIVE DRUG RELEASE

Fig.: % Cumulative drug release of F1 to F3
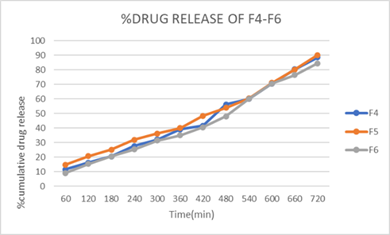
Fig.: %cumulative drug release of F4-F6

Fig.: %Cumulative drug release of F7-F9
KINETIC MODELLING DATA OF OPTIMISED BATCH F3:
|
R2 |
||||
|
Zero order |
First order |
Hixon Crowell |
Kores Meyer Peppas model |
Higuchi Plot |
|
0.6128 |
0.9604 |
0.8978 |
0.6018 |
0.9873 |
REFERENCES


Anuradha Kacharde, Dr. A. A. Harsulkar, Design, Development and Characterization of Transdermal Patches by Using Different Polymer, Vol 3, Issue 6, 3039-3049. https://doi.org/10.5281/zenodo.15715749
 10.5281/zenodo.15715749
