Department Of Pharmaceutical Quality Assurance Department Rajgad Dnyanpeeth College Of Pharmacy Bhor,Pune
A associate of the novel class of hypoglycemia medications known as dipeptidylpeptidase-4 (DPP-4) inhibitors is the oral medication vildagliptin.1 It is used to manage type II diabetes mellitus, a condition in which insulinotropic effects and GLP-1 emission are compromised.3 Glucagon-like peptide 1 (GLP-1) and glucose-subordinate insulinotropic polypeptide (GIP), incretin molecules that promote insulin release and regulate blood glucose levels, are degraded by vildagliptin through the suppression of DPP-4.The methods described in this article include high-performance liquid chromatography. High-performance liquid chromatography techniques have been widely employed, as may be observed. As a result, this study will assist in the selection and development of appropriate analytical approaches to estimate vidagliptin and produce satisfactory outcomes. Researchers occupied in the field of Vildagliptin analytical research may find the investigatory review to be a useful resource for detailed information on different analytical techniques such as Capillary Electrophoresis, Uv Spectrophotometer, RP HPLC, HPTLC and their experimental conditions.
Vildagliptin belongs to a class of pancreatic islet stimulators that elevation the glucose sensitivity of pancreatic ~ and } cells while specifically inhibiting the enzyme type 4 dipeptidylpeptidase (DPP-4). Vildagliptin lowers hepatic glucose synthesis by raising the insulin:glucagon ratio, which lowers plasma glucose levels [1].By preventing DPP-4 from inactivating GLP1 and GIP, vildagliptin enables GLP-1 and GIP to increase insulin production in beta cells and decrease glucagon release by alpha cells of the pancreatic islets of Langerhans.[2].In people with type 2 diabetes, vildagliptin has been demonstrated to lower hyperglycemia. A review of the literature showed that Vildagliptin is estimated using a limited number of analytical techniques.[3,4,5].
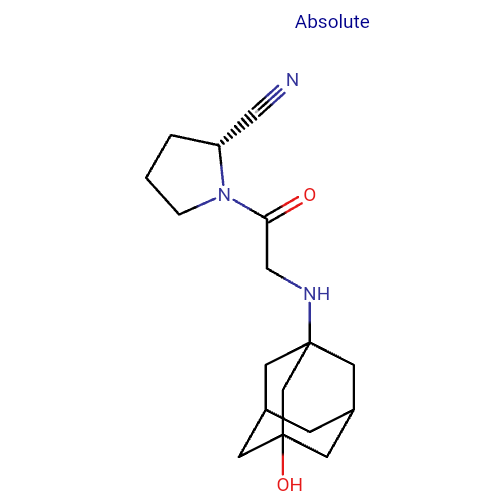
STRUCTURE OF VIDAGLIPTIN
DRUG PROFILE AND PHYSICOCHEMICAL PROPERTY OF VIDAGLIPTIN :
Generic Name – Vildagliptin and IUPAC Name- (2S)-1-[2-[(3-hydroxy-1-adamantyl)amino]acetyl]pyrrolidine-2-carbonitrile. The vildagliptin Molecular weight 303.399 g/mol .Molecular Formula - C17H25N3O2 [9]
The vildagliptin pKa : 14.71,pKa :9.03,pKa:7.6
Isomerism property: 1 Chiral Center And Isomerism Type S Isomerism And Category - Anti-diabetic drug and Solubility – 1. Soluble in water 2.Soluble in organic solvents like ethanol .Melting point- 148-1520C .the vildagliptin Side Effects- Nausea, vomiting, fever, loss of appetite, Shortness of breath.[6]
Method for analysis of vidagliptin:
Various author represent the different analytical techniques like hplc hplc uv hplc and other modern analytical techniques. So in this article see the various analytical techniques and there parameters:Therefore Following Techniques Used For Estimations Of Vidagliptin
1) Capillary Electrophoresis
The vildagliptin assay using capillary electrophoresis is described in the literature. The assay made use of fused quartz capillaries with a positive polarity potential of 25 kV. With a detection wavelength of 207 nm, the supporting electrolyte was 25 mM potassium phosphate pH 8.0. The electrophoretic separation was linear in the concentration range of 50–200 g/ml and took 6 minutes to complete [7]. After precipitating the plasma protein with acetonitrile, the author M.Attimarad has studied and concluded that of measured vildagliptin in rat plasma using sitagliptin as an internal reference. Flamed quartz capillaries with a supporting electrolyte of 0.25 mM ammonium formate were used to isolate vildagliptin from plasma components. It was discovered using mass spectrometry. [8]
2) Estimation Of Vidagliptin By Uv Spectrophotometer
UV spectrophotometric methods utilized for these purposes are numerous. But the most used method among all of these is actinic ray spectrophotometry. The fundamental idea of actinic ray spectroscopy is that visible and actinic ray radiation (200–400 rim) is absorbed and is thought to excite electrons in all atoms and molecules from lower to higher energy levels. Because matter's energy levels are a unit of measurement, a completely light weight combined with the right amount of energy can trigger transitions from one level to another or aspire to be absorbed.[10] There are no distinct and noticeable absorption peaks in the vildagliptin molecule's UV spectra because it lacks a conjugated double-bond system. There is a peak in the spectrum at about 200 nm. A confirmed spectrophotometric technique for the detection of vildagliptin at an analytical wavelength of 266 nm, with a test solution concentration of 200 g/ml and water as the solvent, was nevertheless proposed in the work reported in [11]. 244 nm was suggested as the analytical wavelength in Report of Dr.safila has been studied method development and validation of vildagliptin by uv spectrophotometer. [12]. It has been reported to have a wavelength of 202.5 nm in 0.5 M HCl with a vildagliptin test solution concentration of 25 g/ml [20]. As with the assay of vildagliptin, a spectrophotometric technique for comparing it to metformin hydrochloride utilizing first derivative spectra has been reported [13].
3) Estimation Of Vidagliptin By RP HPLC
Kumaraswamy Gandla et al The precise and accurate RP-HPLC method has been developed for the purpose of validating Vildagliptin in both its pure form and tablet dosage form. Chromatography was performed on a Phenomenex C18 (4.6 x 250 mm, 5 µ) column with a mobile phase consisting of a 70:30 v/v water:methanol combination at a flow rate of 1.0 mL/min. The detection was performed at 265 nm. Vildagliptin had a 3.5-minute retention period. In the concentration range of 10–50 µg/ml of Vildagliptin, the approach yields linear results. Less than 2.0% RSD was the technique precision for the assay determination. Pharmaceutical formulations and bulk quality control benefit from the technique.[14]
4) Vildagliptin and Dapagliflozin
Rasapelly Ramesh Kumar studied that offers a novel method for measuring Vildagliptin and Dapagliflozin in tablet form simultaneously. Using a Discovery C18 column (4.6 x 150 mm, 5µm), the chromatogram was examined. A 70:30 mixture of acetonitrile and Na2HPO4 was used to create the mobile phase ratio was transferred at a flow rate of 0.8 millilitres per minute down the column. The remedy used in this method is a phosphate buffer, and 0.1% Formic is added to change the pH to 5.2. acid. A steady temperature of 30°C was maintained. 220 was the chosen optimal wavelength. nm. Vildagliptin and dapagliflozin were found to have retention durations of 2.307 minutes and
2.865 minutes, in that order. Dapagliflozin's relative standard deviation (RSD) and The values for vildagliptin were found to be 0.9 and 0.7, respectively. Dapagliflozin and Vildagliptin showed recovery rates of 100.41% and 99.94%, respectively. The regression's limit of quantification (LOQ) and limit of detection (LOD) values Dapagliflozin's and Vildagliptin's respective equations were 0.02, 0.07, 0.24, and 0.72. Dapagliflozin's regression equation is given as follows: y = 42540x + 1488.4. Additionally, Vildagliptin's equation is y = 38485x + 2186.5. By cutting down on run and retention times, When used in routine quality control tests, the new method proved to be simple and economical. in sectors.[15]
5) Vildagliptin And Linagliptin
The sujan banik has been method developed and validation of uv spectrometry method for determination of Vildagliptin and the results was Developing a spectrophotometric technique for identifying vildagliptin and linagliptin in pharmaceutical dosage forms was the goal of the current work. The UV-spectrophotometric approach for the assay of vildagliptin and linagliptin in bulk and commercial tablet dosage forms is straightforward, quick, accurate, and exact. The The suggested method was validated in accordance with ICH requirements on linearity, accuracy, precision, specificity, detection limit, and quantification limit. Curves of calibration were acquired in the vildagliptin concentration range of 8–32 µg/ml and linagliptin concentration range of 5–25 µg/ml with strong correlation coefficients(r = 0.999). For both medications, the new method's precision was below the FDA, ICH, and USP maximum permitted level (%RSD < 2.0). As a result, the technique was determined to be sensitive, accurate, and repeatable for analysing linagliptin and vildagliptin in pharmaceutical dosage forms. [16]
REPORTED METHOD FOR VILDAGLIPTIN- HPLC, UV SPECTROSCOPY, HPTLC, RP-UPLC
1) Dayyih et al., 2018 In this research article author has been concluded that Vildagliptin and metformin, two anti-diabetic medications, are frequently used to confirm their effectiveness in diabetic patients. In order to analyse both medications concurrently in their conventional pharmaceutical dose forms, we provide a novel and straightforward chromatographic technique. An Xterra C18 column (250 mmL × 4.6 mm I.D × 5µ) was used in a reverse phase-high performance liquid chromatography (RP-HPLC) separation procedure. The mobile phase consisted of acetonitrile, phosphate buffer (pH 6.0), and water (65: 20:15 v/v/v) at a flow rate of 1.0 ml/min. Utilising an ultraviolet detector set to λ = 239 nm, these medications were quantified using this technique.This RP-HPLC approach yielded a limit of detection (LOD) of 0.025 µg/ml for metformin and 0.0040 µg/ml for vildagliptin. For both metformin and vildagliptin, linear calibration curves were obtained in concentration ranges of 8–54 µg/ml and 4-34 µg/ml, respectively. The results were statistically examined in accordance with the International Conference on Harmonization's (ICH) recommendations after the created approach was validated for concentration linearity, robustness, accuracy, and precision. The invention of a straightforward, quick, accurate, and precise RP-HPLC technique for the prompt detection and validation of vildagliptin and metformin in their pharmaceutical dosage forms was demonstrated by the findings in this paper.[17]
2) A. Shakoor et al.2018 Author has been concluded that in his research article the goal of the current study was to create and verify a straightforward, quick, sensitive, accurate, and exact technique for determining metformin hydrochloride and vildagliptin in tablet and biological samples simultaneously. 20 μL was injected into a Thermo Hypersil ODS C18 column (5 μm, 4.6 mm× 250 mm) at 35 °C to perform isocratic elution of both analytes, at a flow rate of 0.8 mL/min. Methanol, acetonitrile, and phosphate buffer (5:30:65, v/v, pH 3.5) made up the mobile phase, and 212 nm was used as the wavelength. Each sample had a total run duration of 7.0 minutes, and the retention times for vildagliptin and metformin hydrochloride were 3.36 and 5.41 minutes, respectively. With a coefficient of determination (R2) < 0.9919, the calibration curve was linear for metformin and vildagliptin, ranging from 10–140 μg/mL and 1–14 μg/mL, respectively. The repeatability and reproducibility, as measured by relative standard deviation, were less than 1.13 and 0.97%. A high level of technique specificity was demonstrated by force degradation tests, which showed that the analytes were completely separated in the presence of their breakdown products. The suggested reversed-phase high-performance liquid chromatography (RP-HPLC) approach was shown to be quick and easy to use for determining the presence of vildagliptin and metformin hydrochloride in biological samples and commercially available tablets, with recoveries ranging from 100.13 to 100.29%.[19]
3) Bhavesh H. Patel et al,2024 Author has been declared that in his research article Drugs called dapagliflozin and vildagliptin are used to treat diabetes.Developing and validating analytical techniques for the simultaneous measurement of dapagliflozin and vildagliptin in pharmaceutical dosage forms was the main goal of the proposed study. To guarantee the durability of pharmaceutical items, both medications were put through a force degradation process.The HPLC technique was developed using a C18 column (250 x 4.6 mm, particle size of 5 µm). Using an isocratic mode and a mobile phase consisting of a 95:05 % v/v combination of methanol and 0.01% trifluoroacetic acid (pH-2.78), the chromatographic separation was accomplished. The chosen wavelength for estimate was 210 nm, and the flow rate was maintained at 0.8 ml/min. Acid, alkaline, oxidative, and thermal degradation stress tests were conducted.Vildagliptin and dapagliflozin were shown to have retention times of 2.282 and 4.070 minutes, respectively. Vildagliptin and dapagliflozin showed a linear response, with a correlation coefficient value of about 0.999 and a linearity range of 10 to 60 µg/ml. According to research, the recoveries for dapagliflozin and vildagliptin were 100.17% and 99.78%, respectively. The approach demonstrated sensitivity because the LOD and LOQ were determined to be lower. The method was verified in accordance with ICH guideline Q2(R1). In oxidative conditions, the drugs exhibited greater degradation (10.62%) for vildagliptin and 13.52% for dapagliflozin. Vildagliptin and dapagliflozin stability indication, impurity separation, and qualitative and quantitative estimate in pharmaceutical dosage forms and process quality control analysis would all benefit from the effective use of the suggested technique.[18]
4) Butle et al.2015Author has been declared that in research article For the estimation of Vildagliptin in tablet dose form, a novel, straightforward, accurate, exact, and selective stability-indicating high performance thin layer chromatographic (HPTLC) approach has been created and verified. UV detection at 217 nm and a mobile phase of ethyl acetate: methanol (8.5:1.5, v/v) were used to accomplish the chromatographic separation. Vildagliptin was shown to have a retention factor of 0.37 ± 0.003. The technique was verified in accordance with ICH requirements for linearity, accuracy, precision, and robustness. The medication underwent oxidation, photolysis, thermal degradation, and hydrolysis (acid, base) under stress conditions. The concentration range of 200–1000 ng band-1 showed linear results. The approach has been used well for drug analysis in pharmaceutical development.[20]
5)Syed Mastan Ali. et al.2021 For the first time, this study describes a stability confirming the use of the RP-UPLC method for the simultaneous separation of vildagliptin and remogliflozin etabonate. TheThe Acquity® UPLC BEH C18 was used to achieve separation. stationary phase (2.1 × 50 mm, 1.7 μm) column, 0.1Methanol in the proportion and M acetate buffer at pH 5.7of 25:75 (v/v) at a flow rate of 0.3 mL/min and PDA detection at 215 nm. Under these circumstances, the settlement of the 12.57 compounds were found, with a retention period of Vildagliptin takes 3.84 minutes, and remogliflozin takes 2.67 minutes.The accuracy, specificity, stability, robustness, range of analysis, and system applicability of the approach were all validated.An exposure-based forced deterioration study was conducted. of the analytes under five distinct stressors, and in Considering every degradation situation, the percentage of degradation was extremely little, and the technique can distinguish and calculate Remogliflozin and vildagliptin in pharmaceutical formulations Simulations. Therefore, it was discovered that the developed method be appropriate for the simultaneous quantification and separation of validation of remogliflozin with vildagliptin in bulk and compositions of pharmaceuticals.[24]
6)Hitesh P. Inamdar . et al.2013 To determine anti-diabetic medications simultaneously, a straightforward, accurate, and stability-indicating HPLC approach was created and validated. The ACE 3 150mm*4.6mm, 3.5µm column was used to achieve the separation with gradient flow. At a flow rate of 1.5 mL min−1, the mobile phase was made up of 10 mM potassium and 10 mM sodium hexane sulphonate monohydrate gradient of methanol and acetonitrile in a dihydrogen phosphate buffer proportion. At 210 nm, the UV detection was done. The technique was satisfactorily verified in compliance with ICH regulations. Additionally, the verified the approach was used for pharmaceutical dose forms that are sold commercially. [25]
REPORTED METHOD FOR VILDAGLIPTIN- HPLC, UV SPECTROSCOPY
Table.1
|
AUTHOR |
DESCRIPTION |
REFERENCE |
|
W. Abu dayyih et,al 2018 (RP-HPLC) (Vildagliptin And Metformin HCL)
|
Column- Xterra C18 column (250 mm×4.6 mm I.D × 5µ) Mobile phase-Acetonitrile: Phosphate buffer (pH 6.0): water (65: 20:15v/v/v) Flow rate - 1mL/min Wavelength- 239nm |
[17] |
|
Thangabalan boovizhikannan et,al 2013 (RP-HPLC) (Vildagliptin)
|
Column- Agilent XDB C18(150 mm×4.6 mm I.D × 5µ) Mobile phase- 0.1 M Phosphate buffer : acetonitrile ( 85:15% v/v) Flow rate -1mL/min Wavelength- 210nm Retention time – 3.04 min Wavelength-252nm |
[21] |
|
Rasapelly Ramesh Kumaret,al 2024 (RP-HPLC ) (Dapagliflozin and Vildagliptin )
|
Column-Discovery C18 column (5 μm, 4.6 mm× 150 mm) Mobile phase-Acetonitrile and Na2hpo4 prepared in a 70:30ratio Flow rate-1mL/min Retention time – 2.307 and 2.865 min Wavelength-220nm |
[15] |
|
Usharani Gundala et,al 2013 (UV Spectrophotometry) (Vildagliptin and Metformin)
|
Retention time- 0.859min Wavelength-217 & 234nm The % recovery -98- 102% LOD and LOQ -0.023 μg / ml and 0.225 μg / ml for Vildagliptin and 0.44 μg / ml and 1.35 μg / ml for Metformin respectively |
[22] |
|
Drashti A. Mandale. et,al 2021 (RP-HPLC) (Remogliflozin and Vildagliptin)
|
Column:Waters C18 column (4.6×150mm, 5µ) Mobile phase- Acetate buffer (pH 5.6) and methanol in the ratio of 30:70v/v Wavelength-265nm Flow Rate-1.0 mL/min Retention time -4.881 and 6.334 min |
[23] |
|
AUTHOR |
DESCRIPTION |
REFERENCE |
|
Kumaraswamy Gandla et,al 2022 (RP-HPLC) (Vildagliptin) |
Column:Phenomenex C18 (4.6×250mm, 5µ) Mobile phase- Water: Methanol (70: 30 v/v) Wavelength-265nm Flow Rate-1.0 mL/min Retention time of the Vildagliptin was 3.5 min |
[14] |
|
Sujan Banik et,al 2022 (UV-Spectrophotometric) (Vildagliptin and Linagliptin)
|
Calibration curves were obtained in the concentration range of 8-32 μg/ml for vildagliptin and 5-25 μg/ml for linagliptin LOD -0.247μg/ml and 0.734 μg/ml LOQ-0.748 μg/ml and 2.224 μg/ml |
[16] |
|
AUTHOR |
DESCRIPTION |
REFERENCE |
|
Ebru Uet,al 2015 (GC-MS) (Vildagliptin)
|
Using N-Methyl-N(trimethylsilyl) trifluoroacetamide (MSTFA), ammonium iodide, β-mercaptoethanol, and 600 for 30 minutes (100:2:6 v/v/v), the sample was derivatised.A 30m*0.25mm, I.P-025µm capillary column containing 5% phenyl methylpolysiloxane is utilised.utilised a 2000–3000 C temo, holding it at 3000 C for two minutes. LOD -1.5μg/ml LOQ-3.5 μg/ml |
[26] |
|
Hanumantha Rao K et,al 2014 (HPLC) (Vildagliptin)
|
Acetonitrile (72:28v/v) and a diluted orthophosphoric acid solution (pH 2.6) are employed as a buffer in the M-phase of an Altima C18 column with an internal diameter of 5µm and dimensions of 150 x 4.6 mm. Mode of isocratic flow, 1.0 ml/min Retention duration: 3.25 minutes At 266 nm( λmax) LOD was 0.06µg/ml and the LOQ was 0.21µg/ml |
[27] |
|
Aparajita Malakar et,al 2012 (RP-HPLC ) (Vildagliptin )
|
Xterra® waters C18 column (150mm x 4.6m) in S-phase M-phase: a blend of the organic phase (methanol) and aqueous phase (1 millilitre of 25%NH4OH made with a 9.5 50% phosphoric acid solution) in a 60:40 v/v ratio 1.0 millilitres per minute Holding time: 6.3 minutes LOD was measured at 210 nm and was 1.47 µg/ml. A linearity range of 5-200 µg/ml was observed, with a LOQ of 4.90 µg/ml. |
[28] |
|
Shirode A. R et,al 2014 ( RP-HPLC and HPTLC) (Vildagliptin and Metformin)
|
The HiQsil C18 (4.6mm*250mm) S-phase column for analysis M-phase: include methanol: acetonitrile (50:30:20v/v/v) and phosphate buffer (pH calibrated to 6 using 3M KOH). 0.8 ml/min is the flow rate. LOD was 1.70µg/ml and the LOQ was 5.15µg/ml |
[29] |
|
Raju D. et,al 2019 (RP-HPLC) ( Metformin Hydrochloride and Vildagliptin)
|
Chromosil C18 column (250 x 4.6 x 5 µ) Included in the M-phase is K2HPO4: methanol (60:40v/v). pH -9.2 Holding time: 5.32 minutes At 258 nm( λmax) |
[30] |
CONCLUSION
The many analytical techniques used to evaluate Vildagliptin were included in the current review. Numerous analyses, including as HPLC, HPTLC, UV/Vis-Spectroscopy, LC-MS, etc., have been carried out to assess Vildagliptinin in bulk and in combination with other medications from pharmaceutical formulations.. Basic UV spectrophotometric techniques were created that may be applied to routine Vildagliptin analysis.
REFERENCES


Dinesh Gaikwad*, Dr. Prasanna Datar, Dr. Rajkumar Shete, A Simple Review of Analytical Techniques for Determination of Vildagliptin, Int. J. of Pharm. Sci., 2025, Vol 3, Issue 4, 2722-2731. https://doi.org/10.5281/zenodo.15264828
 10.5281/zenodo.15264828
