Pharmaceutical Quality Assurance, R. G. Sapkal college of Pharmacy, Nashik
A simple, economical, rapid, accurate, precise method for simultaneous estimation was developed and validated. UV Spectrophotometric estimation of Aspirin and Ticlopidine HCL of the bulk and tablet formulation is done in which distilled water was used as a solvent and methanol is used as a co-solvent. Method used is- Simultaneous Equation Method which was carried out at the wavelength of 275 nm and 214 nm for Aspirin and Ticlopidine HCL respectively. The linearity range was found to be 25-125 µg/ml and 5-25 µg/ml. The recovery studies were performed and percent recoveries were found to be 99.66±0.3932 % and 99.72± 0.2535 % for Aspirin and Ticlopidine HCL. So proposed method was found to be simple, accurate, linear and specifc.
The number of drugs introduced into the Market increasing every year. Very often there is a time lag from the date introduction of into the market of the date of its inclusion in pharmalopacias. This happens because of the possible uncertainties in the reports continuous and wider usage of these drugs, of new toxicities. Under these Conditions, standards and analytical procedures for these drugs may not be available in the pharmacopoeias. Therefore, it becomes necessary, to develop newer analytical method for such drug. Method Validation is the process used to confirm that the analytical procedure employed for a specific test suitable for its intended use. Results from method validation Can be used to judge the quality, reliability and consistency of analytical results. . It is process of defining an analytical requirement and confirm that method under consideration has performance Capabilities consistent with what the application requires. Method validation evolves from method development and So the two activities are often closely tied with the validation study employing the techniques and steps in analysis’s defined by method.
Analytical methods need to be validated or revalidated:
Analytical chemistry
“Pharmaceutical analytical chemistry may be defined as the branch of practical chemistry which deals with the resolution, separation, identification, determination and purification of given sample of medicine or pharmaceutical. Analytical chemistry may be defined as the art of determining the components of material in terms of the element or compound contained. Its application extended to all parts of an industrial society. It can be splits into two main types as
UV Visible Spectrophotometry
Principle
UV spectroscope has received electromagnetic radiation. The wavelength and intensity of the electromagnetic radiation molecules absorb energy and this energy can bring about translational. Rotational or vibration motion or ionization of the molecules depending upon the frequency of the electromagnetic radiation they receive Excited molecules are unstable and quickly drop down to ground state again giving off the energy they absorbed or emitted can be recorded to get a spectrum. Spectral analysis yields qualitative and quantitative information about the matter under study.
An UV Visible spectrophotometer measures the intensity of light passing through sample (P) and compress it to the intensity of light before it passes through the sample (P0) expressed in absorbance (A) or transmittance (T). It uses light over the ultraviolet range (185 to 400 nm) and visible range (400 to 800 nm) of electromagnetic spectrum.
A= -logT=log P0 /P =ebc
Beer – Lambert Law
Lambert's Law: It states that when a beam of monochromatic radiation passes through a homogeneous absorbing medium, the rate of decrease of intensity of radiation with thickness of absorbing medium is proportional to the intensity of the incident radiation.
Beer's Law: This law states that when a beam of monochromatic radiation is passed through a solution of an absorbing substance, the rate of decrease of intensity of radiation with thickness of the absorbing solution is proportional to the intensity of incident radiation as well as the concentration of the solution.
Types of Spectrophotometers:
Single Beam Instrument
It consists of a tungsten or deuterium lamp, a filter or a monochromator for wavelength selection, matched cells that can be placed alternately in the radiation beam, transducer, an amplifier, and a readout device. Normally, a single-beam Instrument requires a stabilized voltage supply to avoid errors resulting from changes in the beam intensity during the time required to make the 100% measurement and determine %T for the analyte.
Double-Beam Instrument
Many modern photometers and spectrophotometers are based on a double-beam design. Figure b) illustrates a double- beam-in-space instrument in which two beams are formed in space by a V-shape mirror called a beam splitter. One beam passes through the reference solution to a photodetector, and the second simultaneously traverses the sample to a second, matched detector. The two outputs are amplified, and their ratio is determined electronically or by a computer and displayed by the readout device.
Instrumentation:
A spectrophotometer consist of 2 devices, a spectrometer and a photometer. A spectrophotometer is a device that produces, typically disperses and measures light. A photometer indicates the photoelectric detector that measures the intensity of light.

Figure no. 1: a) single beam instrument b) double beam instrument
Spectrophotometric Methods
Following Spectrophotometric methods are used for the analysis of a combination sample-
1. Simultaneous equation method
2. Absorbance ratio method (Q- Absorbance method)
3. Derivative Spectrophotometric method
4. Difference spectrophotometry
5. Solvent extraction method
6. Absorbance correction for interference
7. Ratio derivative spectra method
8. Orthogonal polynomial method
9. Multi-variate method
10. Area Under Curve
Simultaneous Equation Method
If a sample contains two absorbing drugs (x and y) each of which absorbs at the ?max of the other, then it may be possible to determine both drugs by the technique of simultaneous equation (Vierordt's method) provided that certain apply.
The information required is: The absorptivity of x at ?1and ?2, ax1 and ax2 respectively. The absorptivity of y at ?1, and ?2, ay1 and ay2 respectively. The absorbance of the diluted samples at ?1, and ?2, A1 and A2 respectively.
Let Cx and Cy be the concentrations of x and y respectively in the diluted samples. Two equations are constructed based upon the fact that at ?1, the absorbance of the mixture is the sum of the individual absorbance of x and y.
Cx = A2ay1 - A1ay2/ax2ay1-ax1ay2
Cy =A1ax2-A2ax1/ax2ay1-ax1ay2
Validation of Analytical Method:
Before their introduction into routine use
The International Conference of Harmonization (ICH) has developed a consensus text on validation of analytical procedures: The document include definition for eight characteristics.
4. Linearity
5. Range
6. Robustness
7. Ruggedness
8. System Suitability Testing
Characteristics of Validation
1. Specificity
Specificity is the ability to assess unequivocally the analytes in the presence of components, which may be expected to be present. Typically, these might include impurities, degradants. Matrix etc.
2.Accuracy
The accuracy of an analytical procedure expresses the closeness of an agreement between the value, which is accepted either as a conventional true value or an accepted reference value and the value found. This is sometimes termed as trueness,
% Bias - (Measure value - True value / True value) x100
3.Precision
The precision of analytical procedure expresses closeness of agreement (degree of scatter)between a series of measurements obtained from multiple sampling of the same homogenous sample under prescribed conditions. It may be considered at three levels: it is expressed as standard deviation or coefficient of variation.
%RSD = (standard deviation / mean) x100
Repeatability expresses the precision under the same operating conditions over a small interval of time. Repeatability is also termed intra-assay precision.
Intermediate precision expresses within-laboratories variations: different days, different analyst, different equipment etc.
Reproducibility expresses the precision between laboratories.
The detection limit of an individual analytical procedure is the lowest amount of analyte in a sample which can be detected but not necessarily quantitated as an exact value. Several approaches for determining the detection limit are possible, depending on whether the procedure is a non-instrumental or instrumental.
4.1 Based on Signal to Noise Ratio
A signal to noise ratio between 3 or 2:1 is generally considered acceptable for estimating in the detection limit
4.2 Based on the Standard Deviation of the Response and the Slope
Detection Limit (DL) = 3.3 ? / S
Where ?= the standard deviation of the response
S= the slope of the calibration curve
The slope S may be estimated from the calibration curve of the analyte. The estimate of ? may be carried out in a variety of ways, for example :
4.2.1 Based on the Standard Deviation of the Blank
Measurement of the magnitude of analytical background response is performed by analysing an appropriate number of blank samples and calculating the standard deviation of these responses.
4.2.2 Based on the Calibration Curve
A specific calibration curve should be studied using samples containing an analyte in the range of DL. The residual standard deviation of a regression line or the standard deviation of y-intercepts of regression lines may be used as the standard deviation.
4.3 Based on Visual Evaluation
It may be used for non–instrumental methods but may also be used with instrumental methods.
5. Quantitation Limit
The quantitation limit of an individual analytical procedure is the lowest amount of analyte in a sample which can be quantitatively determined with suitable precision and accuracy. The quantitation limit is a parameter of quantitative assays for low levels of compounds in sample matrices and is used particularly for the determination of impurities and/or degradation products.
5.1. Based on Signal to Noise Approach
This approach can only be applied to analytical procedures that exhibit baseline noise. Determination of the signal to noise ratio is performed by comparing measured signals from samples with known low concentrations of analyte with those of blank samples and by establishing the minimum concentration at which the analyte can be reliably quantified. A typical signal to noise ratio is 10:1.
5.2. Based on the Standard Deviation of the Response and the Slope
Quantitation Limit (QL) = 10 ?/S
Where, ?= the standard deviation of the response
S= the slope of the calibration curve
Slope S may be estimated from the calibration curve of the analyte.
5.2.1. Based on Standard Deviation of the Blank
Measurement of the magnitude of analytical background response is performed by analysing an appropriate number of blank samples and calculating the standard deviation of these responses.
5.2.2. Based on the Calibration Curve
A specific calibration curve should be studied using samples, containing an analyte in the range of QL. The residual standard deviation of a regression line or the standard deviation of y-intercepts of regression lines may be used as the standard deviation.
Linearity And Range
The linearity of an analytical procedure is the ability (within a given range) to obtain test results, which are directly proportional to the concentration of an analytes in the sample. The range of an analytical procedure is the interval between the upper and lower concentration of analytes in the sample for which it has been demonstrated that the analytical procedure has a suitable level of precision, accuracy and linearity.
Robustness
The robustness of an analytical procedure is a measured of its capacity to remain unaffected by small, but deliberate variations in method parameters and provides an indication of its reliability during normal usage.
Ruggedness
The Ruggedness of an analytical procedure is the reproducibility of test result obtained by the analysis of the same sample under variety of condition, such as different laboratories, different analyst, different assay temperature, different
System Suitability Testing:
System Suitability is an integral part of many analytical procedure. The tests are based on the concept that the equipment, electronics, analytical operation, and sample to be analysed constitute an integral system that can be evaluated as such.
ICH Guidelines
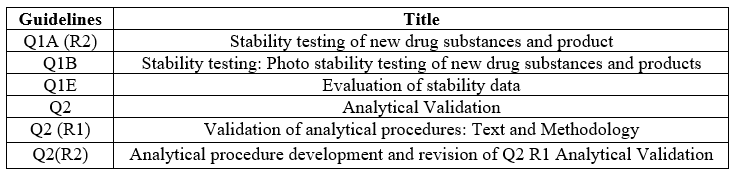
Table no 1: ICH Guidelines for Method Development and Validation
Drug Profile:
Aspirin:
Structure
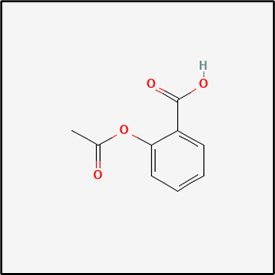
IUPAC Name: 2-(Acetyloxy)benzoic acid
Molecular formula - C9H8O4
Molecular Weight - 180.16 g/mole
Solubility: 1 gm dissolves in 300 ml H2O at 25oC (Slightly soluble)
1 gm dissolves in 100 ml H2O at 37oC (Sparingly soluble)
1 gm dissolves in 5ml alcohol (Freely soluble)
1 gm dissolves in 17 ml chloroform (Soluble)
1 gm dissolves in 10-15 ml ether (Soluble)
Decomposition by boiling H2O or when dissolved in solution of alkali hydroxides and carbonates, inorganic salts soluble in H2O (especially Calcium salts) but decomposed quickly.
Mechanism of action – It acetylates the enzyme COX1 and TX synthase- inactivating them irreversibly. TXA2 activates platelets to change shape and release mediator rich granules which promote aggregational it inhibits the release of ADP from platelets and their sticking to each other.
LD50 orally in mice, rats, 1.1,1.5/kg
pK(25o) - 3.4 g
UV max - (0.1 NH2SO4) 229 nm; (CHCl3) 277 nm
Ticlopidine HCl
Structure
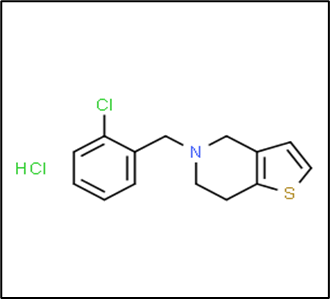
IUPAC Name : 5-[(2-Chlorophenyl 1)-methyl]-4,5,6,-tetrahydrothieno[3,2-C]Pyridine
Molecular Formula- C14H14ClNS.HCl
Molecular Weight- 300.25 g/mole
Solubility Almost Soluble in H2O (Sparingly)
Soluble in 95% alcohol,methanol,chloroform
Insoluble in ether
Mechanism of action – First thienopyridine drug that acts by blocking the P2Y12 type of purinergic receptors on the surface of platelets and inhibits ADP – induced aggregation.
LD50 in mice (mg/kg/24 hrs) 55 iv;>300 orally
pKa - 7.64
UV max- H2O: 214,268,295 nm (A1cm 303.8, 13.14,2 respectively)
MATERIALS AND EQUIPMENT:
In the present work a simple ,selective, rapid, Precise, UV Spectrophotometric method for estimation of Aspirin and Ticlopidine HCL has been developed and validated.
Materials
Active Pharmaceutical Ingredients

Table no 2: API and Supplier
Marketed Formulation: Lab Mixture
Reagents
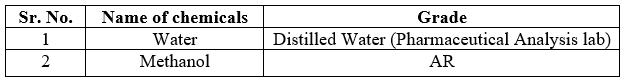
Table no.3 List of Chemicals/Reagents
Instruments
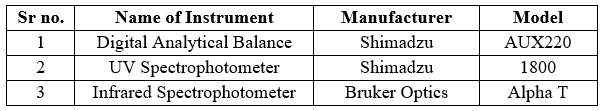
Table no 4: List of Instruments/Equipment’s
RESULTS AND DISCUSSION:
Physical characteristics:
Solubility of Drug:
Solubility profiling of Aspirin and Ticlopidine HCL was done by using different solvents such as
Water and Methanol and examined using UV spectroscopy.

Table no 5: Solubility of Drug in different solvent
FTIR Spectroscopy
The FTIR spectroscopy uses infrared radiation which is a type of molecular absorption spectroscopy. In this a spectrum of % Transmittance v/s Wavenumber is obtained. An IR spectrum of the Aspirin and Ticlopidine HCL was obtained using ATR technique.
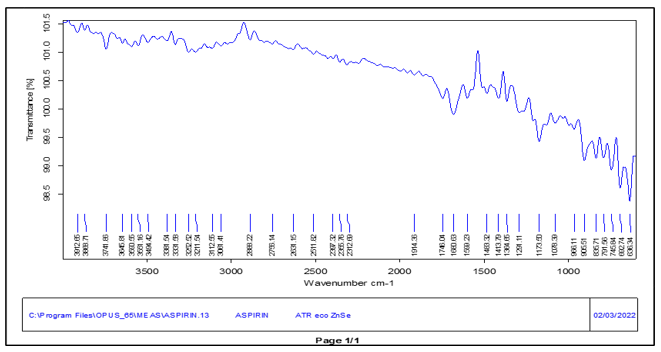
Fig no. 2 FTIR spectrum of Aspirin
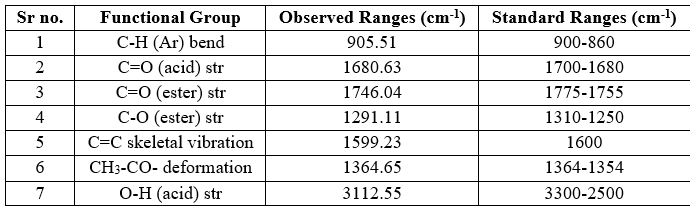
Table no 6: IR Frequencies of Aspirin
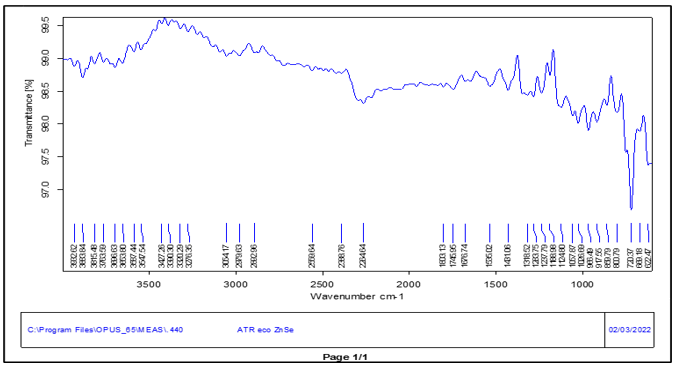
Fig no.3 FTIR Spectrum of Ticlopidine HCL
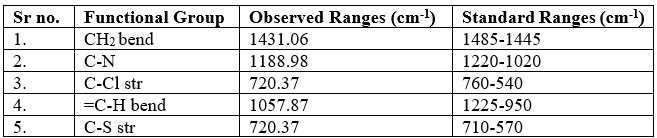
Table no 7: IR Frequencies of Ticlopidine HCL
UV spectrophotometric method
Selection of wavelength
Different concentration of solution of both the drugs was prepared. These solutions are scanned between 200-400 nm using distilled water as a reference solvent. In UV spectrophotometer214 nm and 275 nm were selected for the determination of simultaneous equation method of Ticlopidine HCL and Aspirin.
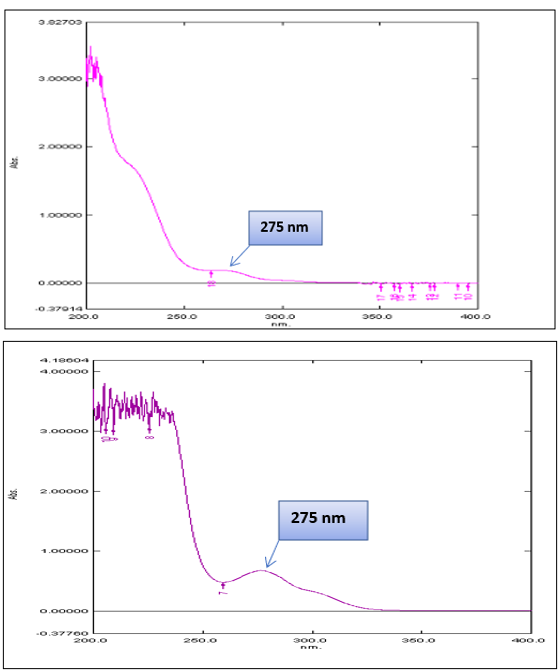
Fig no 4: UV spectrum of aspirin

Fig. 5 Overlay Spectra of Aspirin and Ticlopidine HCL

Fig no 6: UV spectrum of Ticlopidine HCL
Absorptivity coefficient for the two drugs were determine at both the selected wavelengths. The value obtained as a mean of three independent determinations were used for forming the simultaneous equation. The concentration of drugs x (Ticlopidine HCL) and y ( Aspirin) in sample solution were determined using the following formula
Cx = A2ay1 - A1ay2/ax2ay1-ax1ay2
Cy =A1ax2-A2ax1/ax2ay1-ax1ay2
Where Cx and Cy are the concentration of Ticlopidine HCL and Aspirin. A1 and A2 are the absorbance of sample solution at 214 nm and 275 nm respectively, ax1 and ax2 are the absorptivity of Ticlopidine HCL at 214 nm and 275 nm, ay1 and ay2 are the absorptivity of Aspirin at 214 nm and 275 nm.
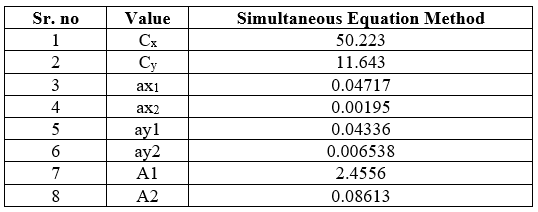
Table no 8: Result of Simultaneous Equation Method
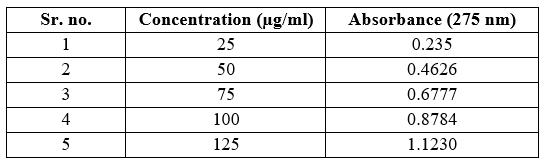
Table no 9 Linearity data of Aspirin

Fig no 7 Calibration curve of Aspirin
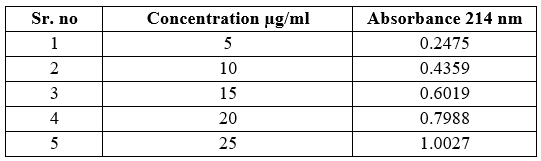
Table no 10 Linearity data of Ticlopidine HCL
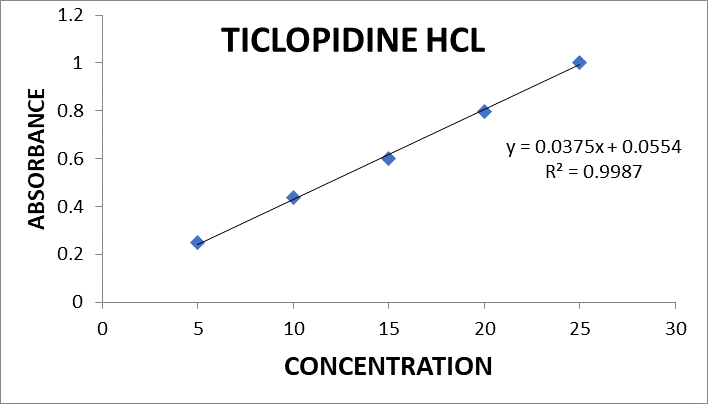
Fig no 8 Calibration curve of Ticlopidine HCL
Method Validation
Validation of analytical method is a process to established that the performance characteristic of developed method meet the requirement of the analytical application.
Linearity: Linearity study was performed by preparing solutions of 25-125 µg/ml for Aspirin and 5-25 µg/ml For Ticlopidine HCL. The calibration curve was plotted for each drug with concentration versus absorbance separate.
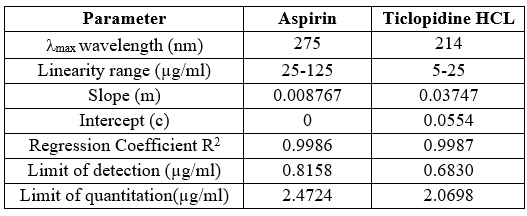
Table no 11 Optical characteristics and another parameter
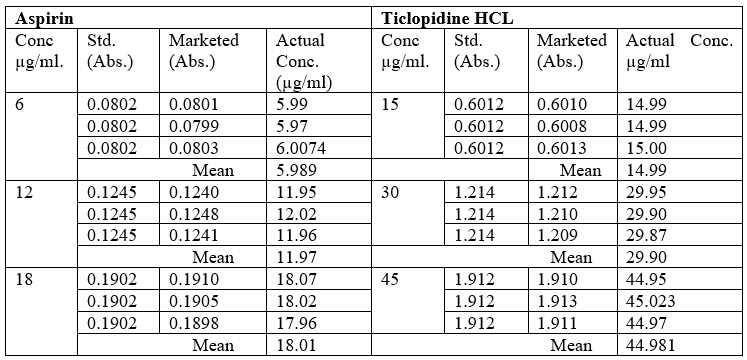
Table no 12 Pre-analysis Study
The Precision of the method was evaluated by intraday and interday variation studies. In intraday studies working solutions of standard and sample were analysed thrice in a day and the percentage of relative standard deviation (%RSD) was calculated. In case of variation the working solutions of standard and sample were analysed on three consecutive days and the percentage of relative standard deviation (%RSD) was calculated.
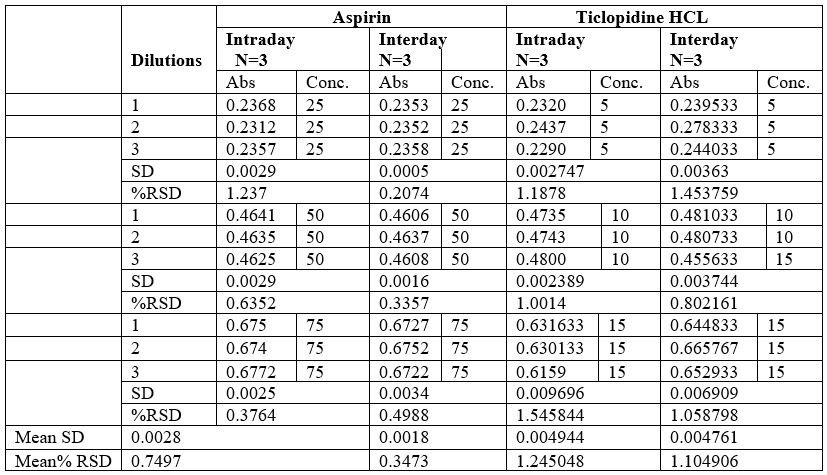
Table no 13 Intraday – Interday Precision data
To confirm the accuracy of proposed method, Recovery studies were carried at 3 different levels (50%,100%,150%) as per US FDA .The amount of Aspirin and Ticlopidine HCL were estimated by developed method.
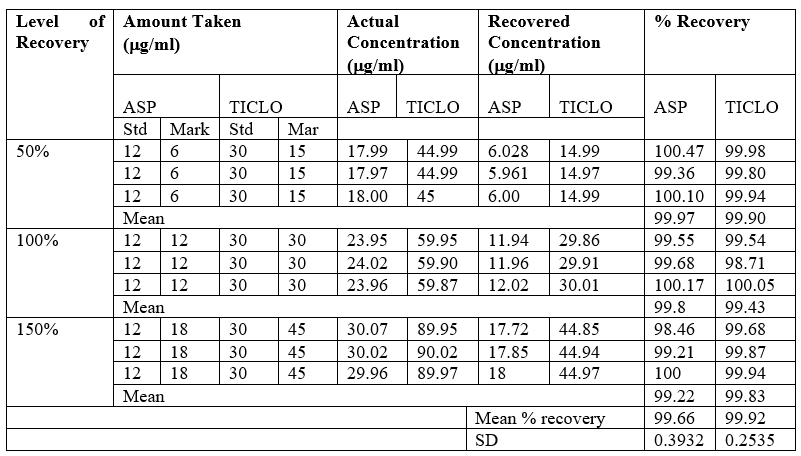
Table no 14 Result of Recovery study
LOD and LOQ:
ICH guideline describes several approaches to determine the detection and quantitation limits. These include visual evaluation, signal to noise ratio and the use of standard deviation of the response and the slope of the calibration curve.In the present study, the LOD and LOQ based on the third approach and calculated with the following equations:
LOD = 3.3?/S
LOQ = 10?/S,
where ?= the standard deviation of response
S= the slope of the corresponding calibration curve.
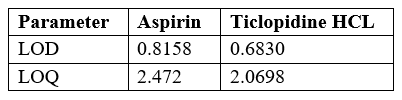
Table no 15 LOD and LOQ
Ruggedness
Ruggedness is a measure of reproducibility of test results under the variation in conditions normally expected from lab to lab and analyst to analyst.
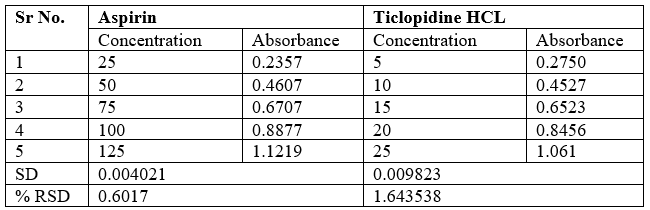
Table no 16 Ruggedness data
Robustness tests examine the effect operational parameters have on the analysis results. If the influence of the parameter is within a previously specified tolerance the parameter is said to be within the methods robustness range.
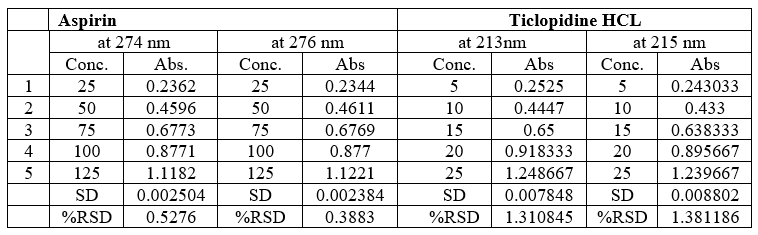
Table no 17 Robustness data
The proposed methods are simple, precise, accurate, economic and rapid for the determination of ASP and TIC in combine tablet dosage form. Maximum recovery obtain by this developed method and the percent RSD for each component is not more than 2%. For the Precision, Robustness, Ruggedness and accuracy, the percent RSD is not more than 2%. Hence proposed UV method is cost effective precise and accurate for the simultaneous determination of Aspirin and Ticlopidine HCL in combine dosage form & is suitable for analysis of pharmaceutical preparations.
REFERENCE


Shubhangi Bhalerao*, Dr. Rishikesh. S. Bachhav, Netra Adhav, Method Development and Validation for simultaneous Estimation of Aspirin and Ticlopidine HCL in Bulk and Tablet Formulation by using UV Spectrophotometer, Int. J. of Pharm. Sci., 2024, Vol 2, Issue 7, 563-578. https://doi.org/ 10.5281/zenodo.12699350
 10.5281/zenodo.12699350
