Viswanadha Institute of Pharmaceutical Sciences, Mindivanipalem, Visakhapatnam, Andhra Pradesh.
This study investigates the development of Nifedipine transdermal patches utilizing varying ratios of Hydroxypropyl Methylcellulose K100 (HPMC K100) and Eudragit L100. The formulations were subjected to rigorous evaluation encompassing physicochemical properties, ex vivo permeation studies, and in vitro iontophoresis assessments. The findings indicate that iontophoresis significantly enhanced drug release compared to the chemical method employing Dimethyl Sulfoxide (DMSO) as a penetration enhancer. The transdermal patches exhibited the requisite flux and suitable mechanical properties, suggesting their potential for effective antihypertensive therapy. The combination of HPMC K100 and Eudragit L100 polymers provides a matrix conducive to controlled drug release. The incorporation of PEG as a plasticizer enhances the mechanical properties of the patches, while DMSO and iontophoresis serve as effective permeation enhancers. The iontophoresis technique offers a non-invasive means to augment drug delivery, potentially improving therapeutic outcomes in hypertensive patients.The study successfully developed Nifedipine transdermal patches with optimal physicochemical properties and enhanced drug release profiles. The iontophoresis-enhanced formulations demonstrated superior performance compared to chemical enhancement methods. These findings underscore the potential of iontophoresis in advancing transdermal drug delivery systems for antihypertensive therapy.
Transdermal therapeutic systems are defined as self-contained discrete dosage forms which, when applied to the intact skin, deliver the drug(s) through the skin at controlled rate to the systemic circulation. A transdermal drug delivery device, which may be of an active or a passive design, is a device which provides an alternative route for administering medication. A drug is applied in a relatively high dosage to the inside of a patch, which is worn on the skin for an extended period of time. Through a diffusion process, the drug enters the blood stream directly through the skin. Since there is high concentration on the patch and low concentration in the blood, the drug will keep diffusing into the blood for a long period of time, maintaining the constant concentration of drug in the blood flow.(1)
Materials: Drug Profile
NIFEDIPINE (2-8):
IUPAC NAME: 3,5-dimethyl 2,6-dimethyl-4-(2-nitrophenyl)-1,4-dihydropyridine-3,5-dicarboxylate

Structure Of Nifedipine
Mode of action:
Nifedipine decreases arterial smooth muscle contractility and subsequent vasoconstriction by inhibiting the influx of calcium ions through L-type calcium channels. Calcium ions entering the cell through these channels bind to calmodulin. Calcium-bound calmodulin then binds to and activates myosin light chain kinase (MLCK). Activated MLCK catalyses the phosphorylation of the regulatory light chain subunit of myosin, a key step in muscle contraction. Signal amplification is achieved by calcium-induced calcium release from the sarcoplasmic reticulum through ryanodine receptors. Inhibition of the initial influx of calcium inhibits the contractile processes of smooth muscle cells, causing dilation of the coronary and systemic arteries, increased oxygen delivery to the myocardial tissue, decreased total peripheral resistance, decreased systemic blood pressure, and decreased after load. The vasodilatory effects of Nifedipine results in an overall decrease in blood pressure.
EXCIPIENTS PROFILE
Methodology:
Construction of standard calibration curve of Nifedipine
Preparation of Nifedipine Transdermal Films (12-15)
Composition of Nifedipine Transdermal Patches
|
Formulation code |
Drug (mg) |
HPMC K100 (mg) |
Eudragit L100 (mg) |
DMSO (ml) |
|
F1 |
50 |
500 |
- |
- |
|
F2 |
50 |
350 |
150 |
- |
|
F3 |
50 |
300 |
200 |
- |
|
F4 |
50 |
280 |
220 |
- |
|
F5 |
50 |
260 |
240 |
- |
|
F6 |
50 |
250 |
250 |
- |
|
F7 |
50 |
500 |
- |
0.03 |
|
F8 |
50 |
350 |
150 |
0.03 |
|
F9 |
50 |
300 |
200 |
0.03 |
|
F10 |
50 |
280 |
220 |
0.03 |
|
F11 |
50 |
260 |
240 |
0.03 |
|
F12 |
50 |
250 |
250 |
0.03 |
15% v/w polyethylene glycol - plasticizer.
5% v/w DMSO - penetration enhancer
Each patch 4.9 cm2contains 3.67 mg of Nifedipine
Characterization of Nifedipine Transdermal Films
Physicochemical properties,Weight variation, Thickness,Folding endurance.Estimation of drug content in polymeric films,Moisture Absorption Studies,Moisture Content Determination of Mechanical properties, Ex-vivo Permeation Studies and In vitro release studies through Iontophoresis:
RESULTS AND DISCUSSIONS
Pre-formulation study:
Preformulation studies are primarily done to investigate the physicochemical properties of drug and to establish its compatibility with other excipients.
FTIR Compatibility Studies:
In the FTIR spectra of pure drug and formulation with other ingredients (different polymers) it is observed that the peaks of major functional groups of Nifedipine, which are present in spectrum of pure drug are observed. It means there are no interactions between drug and other ingredients in a physical mixture and drug is compatible with other ingredients.
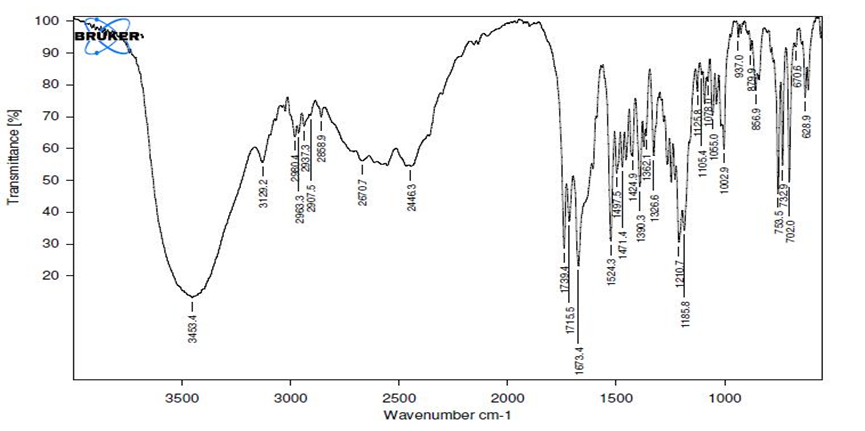
FTIR spectra of Nifedipine
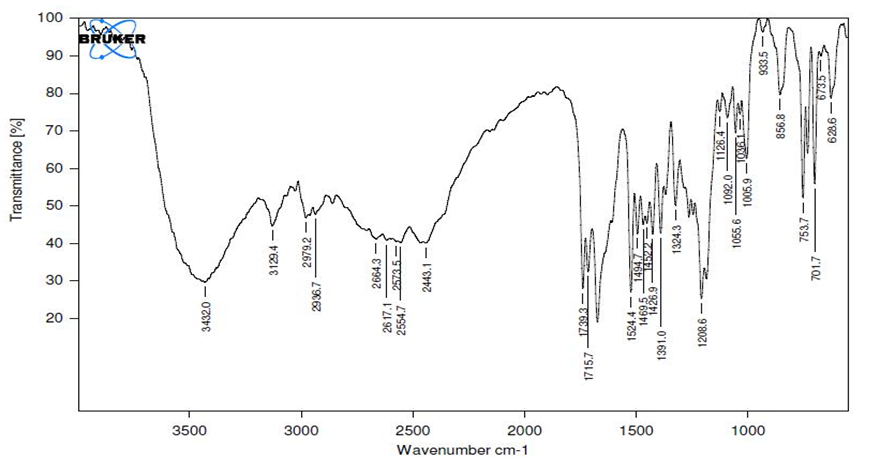
FTIR spectra of Nifedipine and Excipients
Construction of Calibration Curve of Nifedipine
Standard Calibration Curve of Nifedipine in methanol
|
Concentration(μg/ml) |
Absorbance |
|
0 10 20 30 40 50 |
0 0.241 0.521 0.811 1.112 1.328 |
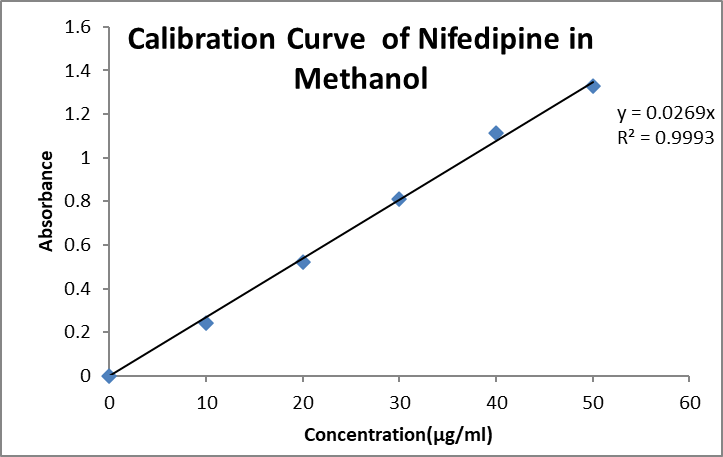
Fig: Standard Calibration Curve of Nifedipine in Methanol
Standard Calibration Curve of Nifedipine pH 7.4 phosphate buffer
|
Concentration(μg/ml) |
Absorbance |
|
0 10 20 30 40 50 60 70 |
0 0.134 0.278 0.415 0.642 0.781 0.924 0.965 |
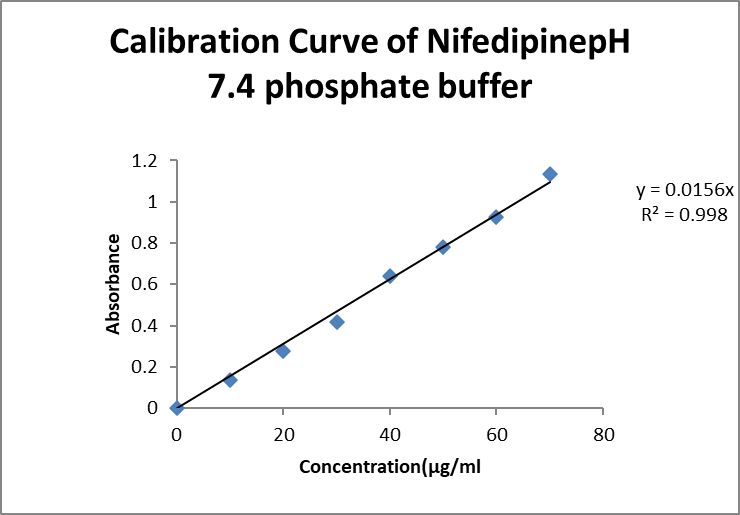
Standard gr Calibration Curve of Nifedipine in pH 7.4 phosphate buffer
Weight variation, thickness and folding endurance of Nifedipine transdermal patches
|
Formulation |
Weight variation (mg) |
Thickness (mm) |
Folding endurance |
|
F1 |
48.02±1.8 |
0.826±0.263 |
564.61±0.576 |
|
F2 |
34.87±1.24 |
1.306±0.223 |
437.28±1.426 |
|
F3 |
39.37±0.86 |
0.986±0.233 |
491.73±0.796 |
|
F4 |
43.52±1.53 |
0.866±0.243 |
552.93±0.976 |
|
F5 |
46.86±1.05 |
0.596±0.253 |
561.14±0.926 |
|
F6 |
33.48±0.76 |
1.576±0.203 |
434.64±0.686 |
|
F7 |
48.66±0.82 |
0.706±0.273 |
569.08±1.336 |
|
F8 |
36.56±1.39 |
1.016±0.213 |
456.26±1.066 |
|
F9 |
40.73±1.7 |
1.416±0.223 |
492.86±0.786 |
|
F10 |
41.89±1.16 |
1.296±0.253 |
560.73±0.666 |
|
F11 |
44.62±1.22 |
0.616±0.263 |
565.62±1.186 |
|
F12 |
34.36±0.94 |
0.666±0.223 |
472.95±1.136 |
Drug content, % Moisture absorbed, %Moisture content of Nifedipine transdermal patches
|
Formulation |
Drug content (mg) |
%Moisture absorbed |
%Moisture Content |
|
F1 |
2.38±0.99 |
11.23±1.5 |
9.76±0.88 |
|
F2 |
2.95±1.32 |
8.39±1.66 |
4.95±0.88 |
|
F3 |
2.18±0.87 |
10.23±0.88 |
7.3±1.2 |
|
F4 |
2.39±1.21 |
7.95±1.5 |
9.78±1.35 |
|
F5 |
2.42±1.07 |
11.01±0.87 |
9.78±1.88 |
|
F6 |
2.85±0.58 |
7.99±1.28 |
5.01±0.8 |
|
F7 |
2.55±1.3 |
13.01±1.07 |
9.78±0.86 |
|
F8 |
3.12±0.95 |
7.91±0.72 |
6.64±0.58 |
|
F9 |
2.29±0.78 |
8.23±0.68 |
6.75±0.81 |
|
F10 |
2.35±1.58 |
9.91±0.52 |
8.98±0.85 |
|
F11 |
2.41±1.3 |
11.03±1.22 |
9.55±0.86 |
|
F12 |
2.89±0.89 |
8.01±1.47 |
7.31±1.9 |
Mechanical properties of optimized formulations
|
Formulation code |
Tensile strength(kg/m2) |
Elongation at break (%mm 2) |
|
F4 F9 F10 |
1.31±0.15 0.79±0.39 1.50±0.84 |
25.31±0.34 40.46±0.98 22.46±0.87 |
Permeation Studies of Nifedipine from transdermal patches
|
Time |
Cumulative amount of drug permeated (μg/cm2) |
|||
|
(h) |
F1 |
F2 |
F3 |
F4 |
|
0 |
0 |
0 |
0 |
0 |
|
1 |
225.856±7.9 |
230.61±6.415 |
242.04±8.84 |
269.57±0.471 |
|
2 |
248.566±10.3 |
4490.21±0.415 |
482.5±1.1 |
403.61±6.471 |
|
3 |
447.94610.3 |
601.93±2.255 |
482.7±9.32 |
483.99±8.271 |
|
4 |
622.906±11.7 |
669.77±6.855 |
602.72±2.88 |
641.81±8.871 |
|
5 |
803.606±7.96 |
867.93±0.235 |
846.04±9.04 |
842.19±6.471 |
|
6 |
868.166±12.76 |
6.41±8.475 |
44.12±9.24 |
44.39±8.891 |
|
7 |
1162.946±17.94 |
204.57±0.415 |
208.06±9.04 |
242.23±8.311 |
|
8 |
1268.566±19.94 |
409.99±2.235 |
408.46±7.04 |
445.57±2.531 |
|
9 |
1414.346±14.16 |
670.37±2.415 |
628.64±1.04 |
664.17±4.471 |
|
10 |
1688.546±10.34 |
866.19±0.415 |
822.06±6.86 |
2001.81±8.551 |
|
12 |
1809.966±13.58 |
2046.57±4.415 |
2244.12±0.84 |
2243.83±2.091 |
|
24 |
2247.946±19.94 |
2422.39±8.215 |
2646.28±8.64 |
2895.19±4.271 |
|
Flux Jss |
26.066±2.54 |
29.53±0.905 |
30.53±1.33 |
33.36±1.421 |
Permeation of Nifedipine from transdermal patches
|
Time |
Cumulative amount of drug permeated (μg/cm2) |
|||
|
(h) |
F5 |
F6 |
F7 |
F8 |
|
0 |
0 |
0 |
0 |
0 |
|
1 |
199.61±5.564 |
260.75±7.547 |
292.7±12.446 |
502.64±6.014 |
|
2 |
320.72±3.864 |
347.73±6.607 |
446.47±5.576 |
610.22±7.594 |
|
3 |
453.95±9.264 |
555.82±5.927 |
570.15±3.866 |
769.87±10.514 |
|
4 |
564.04±4.564 |
750.33±2.617 |
728.33±9.566 |
942.87±8.644 |
|
5 |
714.51±12.564 |
927.59±7.677 |
866.68±7.346 |
1059.8±9.404 |
|
6 |
888.1±10.564 |
1087.97±7.587 |
1081.75±7.886 |
1228.62±6.644 |
|
7 |
1081.51±3.664 |
1279.91±10.597 |
1274.05±5.346 |
1395.23±11.514 |
|
8 |
1260.24±4.764 |
1438.82±3.067 |
1489.12±2.726 |
1529.56±4.894 |
|
9 |
1453.28±8.564 |
1613.88±5.007 |
1691.67±4.766 |
1682.6±13.614 |
|
10 |
1656.6±2.564 |
1836.65±9.827 |
1818.32±8.396 |
1940.6±2.794 |
|
12 |
1907.26±3.964 |
2066.39±12.907 |
2065.27±6.746 |
2208.51±8.994 |
|
24 |
2240.78±6.764 |
2439.47±8.417 |
2599.31±10.546 |
2697.19±7.794 |
|
Flux Jss |
26.9±0.914 |
29.97±0.737 |
30.82±1.586 |
32.78±1.224 |
Permeation Studies of Nifedipine from transdermal patches
|
Time |
Cumulative amount of drug permeated (μg/cm2) |
|||
|
(h) |
F9 |
F10 |
F11 |
F12 |
|
0 |
0 |
0 |
0 |
0 |
|
1 |
423.68±7.27 |
278.03±4.215 |
244.77±10.551 |
336.52±9.23 |
|
2 |
531.21±12.06 |
449.42±10.565 |
309.07±2.871 |
468.64±5.65 |
|
3 |
616.72±14.14 |
640.26±7.945 |
544.61±6.841 |
567.73±10.25 |
|
4 |
779.67±10.11 |
823.76±2.965 |
658.38±4.801 |
725.54±3.1 |
|
5 |
931.24±11.23 |
998.81±8.535 |
850.32±9.581 |
921.51±5.36 |
|
6 |
1144.1±4.83 |
1222.68±3.795 |
1055.75±13.891 |
1127.25±6.32 |
|
7 |
1364.3±6.14 |
1407.28±6.465 |
1295.85±12.561 |
1333.55±7.79 |
|
8 |
1568.72±6.91 |
1587.08±12.575 |
1520.15±9.571 |
1550.85±9.01 |
|
9 |
1777.91±9.98 |
1776.78±9.715 |
1698.05±10.251 |
1730.15±9.84 |
|
10 |
1988.2±11.01 |
1988.78±10.705 |
1863.15±8.961 |
1963.85±3.88 |
|
12 |
2286.57±7.91 |
2360.38±5.395 |
2023.05±6.541 |
2254.15±12.12 |
|
24 |
2965.17±3.7 |
3229.38±6.755 |
2412.75±9.271 |
2601.85±11.62 |
|
Flux Jss |
33.23±1.02 |
35.08±0.985 |
29.69±1.301 |
31.65±1.85 |
Permeation of Nifedipine from transdermal patches using iontophoresis (F1i to F6i)
|
Time |
Cumulative amount of drug permeated(μg/cm2) |
||
|
(h) |
F1i |
F2i |
F3i |
|
0 |
0 |
0 |
0 |
|
1 |
377.87±5.725 |
450.81±12.407 |
478.47±8.828 |
|
2 |
637.69±15.745 |
756.88±4.637 |
781.98±7.748 |
|
3 |
892.86±6.595 |
1035.27±10.397 |
1080.15±3.648 |
|
4 |
1191.78±9.375 |
1337.77±7.947 |
1374.95±9.888 |
|
5 |
1373.08±10.585 |
1522.77±9.817 |
1533.85±10.318 |
|
6 |
1585.98±8.815 |
1711.07±12.657 |
1799.65±5.648 |
|
7 |
1781.58±7.575 |
1912.87±10.797 |
1993.45±2.898 |
|
8 |
1951.18±12.355 |
2122.07±9.007 |
2242.95±13.548 |
|
9 |
2129.08±10.975 |
2287.27±7.517 |
2429.75±12.668 |
|
10 |
2254.98±9.245 |
2439.77±6.297 |
2593.45±5.048 |
|
12 |
2413.88±8.485 |
2629.67±6.657 |
2815.45±11.348 |
|
24 |
2757.78±14.545 |
3076.47±8.617 |
3247.75±8.918 |
|
Flux Jss |
36.82±1.445 |
40.54±0.607 |
42.08±1.038 |
Permeation of Nifedipine from transdermal patches
|
Time |
Cumulative amount of drug permeated (µg/cm2) |
||
|
(h) |
F4i |
F5i |
F6i |
|
0 |
0 |
0 |
0 |
|
1 |
604.55±6.517 |
328.13±7.855 |
410.34±9.727 |
|
2 |
963.11±10.617 |
592.37±4.695 |
662.48±4.617 |
|
3 |
1229.97±14.587 |
854.04±9.585 |
964.51±13.517 |
|
4 |
1531.37±11.187 |
1112.4±8.975 |
1178.47±2.517 |
|
5 |
1846.47±7.357 |
1260.6±6.525 |
1402.67±5.957 |
|
6 |
2015.87±5.557 |
1406.6±5.365 |
1583.57±7.707 |
|
7 |
2161.77±9.647 |
1572.1±2.905 |
1777.57±8.987 |
|
8 |
2405.07±8.607 |
1725.4±6.255 |
1993.97±10.897 |
|
9 |
2618.67±8.287 |
1938±10.685 |
2177.07±12.537 |
|
10 |
2773.07±5.957 |
2072.3±9.795 |
2329.67±5.667 |
|
12 |
2984.17±12.447 |
2282.2±8.355 |
2552.37±11.477 |
|
24 |
3571.37±9.887 |
2687.9±7.555 |
3027.67±12.597 |
|
Flux Jss |
46.03±0.797 |
34.3±1.315 |
38.85±0.987 |
Comparative study of Nifedipine permeation
|
Time |
Cumulative amount of drug permeated (µg/cm2) |
||
|
(h) |
F4 |
F10 |
F4i |
|
0 |
0 |
0 |
0 |
|
1 |
270.7±11.18 |
277.62±4.87 |
604.66±6.519 |
|
2 |
413.83±8.18 |
449.01±11.22 |
963.22±10.619 |
|
3 |
585.22±9.98 |
639.85±8.6 |
1230.02±14.589 |
|
4 |
752.93±9.58 |
823.35±3.62 |
1531.48±11.189 |
|
5 |
942.31±8.18 |
998.4±9.19 |
1846.58±7.359 |
|
6 |
1144.99±10.6 |
1222.37±4.45 |
2015.98±5.559 |
|
7 |
1353.29±10.03 |
1406.37±7.12 |
2161.88±9.649 |
|
8 |
1547.39±14.24 |
1586.67±13.23 |
2405.48±8.609 |
|
9 |
1774.79±15.18 |
1776.97±10.37 |
2618.78±8.289 |
|
10 |
2003.19±10.26 |
1988.67±11.36 |
2773.18±5.959 |
|
12 |
2254.39±12.8 |
2359.97±6.05 |
2984.28±12.449 |
|
24 |
3063.99±14.88 |
3229.07±7.41 |
3571.08±9.889 |
|
Flux Jss |
34.51±2.04 |
34.67±1.64 |
46.14±0.799 |
|
Time |
Cumulative amount of drug permeated (µg/cm2) |
||
|
(h) |
F4 |
F10 |
F4i |
|
0 |
0 |
0 |
0 |
|
1 |
2.646 |
2.7146 |
5.9192 |
|
2 |
4.0474 |
4.4002 |
9.4374 |
|
3 |
5.733 |
6.2622 |
12.054 |
|
4 |
7.3696 |
8.0654 |
15.0038 |
|
5 |
9.2316 |
9.7804 |
18.0908 |
|
6 |
11.2112 |
11.9854 |
19.747 |
|
7 |
13.2594 |
13.7788 |
21.1778 |
|
8 |
15.1606 |
15.5428 |
23.569 |
|
9 |
17.3852 |
17.4048 |
25.6564 |
|
10 |
19.6294 |
19.4824 |
27.1754 |
|
12 |
22.0892 |
23.1182 |
29.2432 |
|
24 |
30.0174 |
31.6442 |
34.9958 |
Zero order plot-F4, b- first order plot-F4, C-Higuchi plot-F4
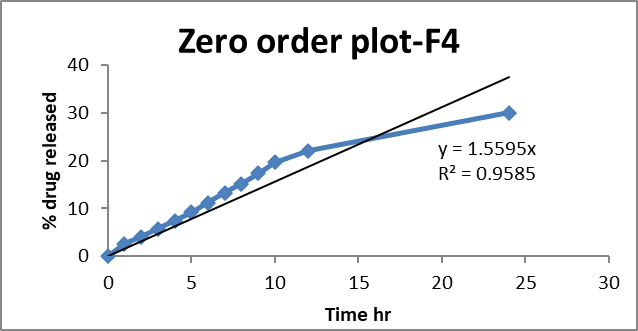
Zero order plot-F4
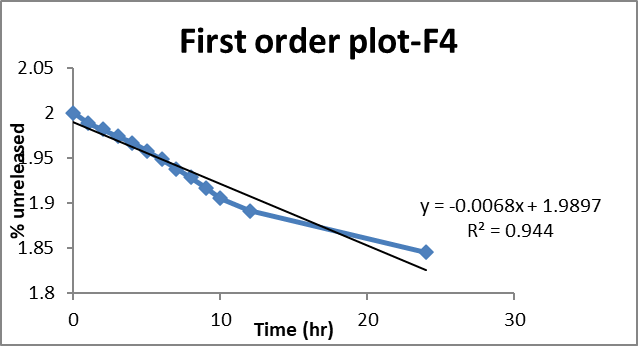
First order plot-F4
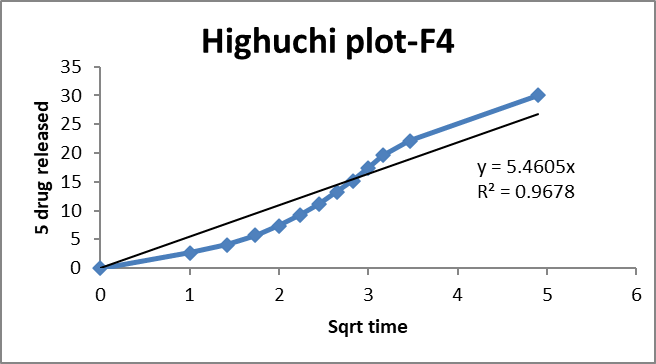
Higuchi plot-F4
Zero order plot-F10, b- first order plot-10, C-Higuchi plot-10

Zero order plot-F10
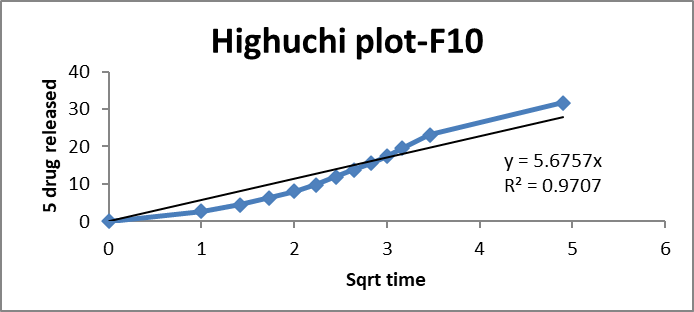
Higuchi plot-F 10
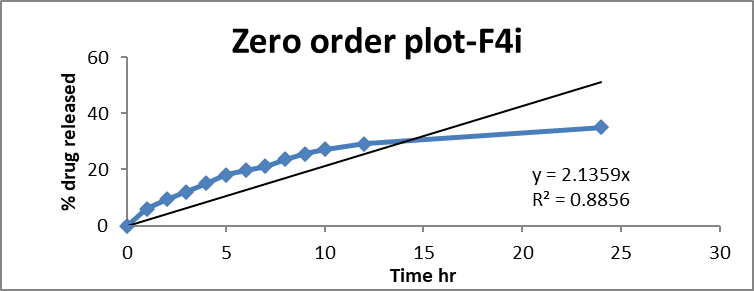
Zero order plot-F4i
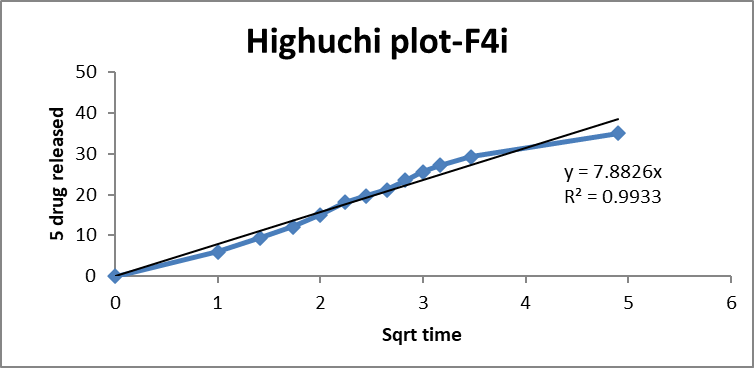
Higuchi plot-4i
Development of Nifedipine Transdermal Films
The ex vivo permeation studies conducted on rat abdominal skin using Nifedipine-loaded transdermal patches have provided valuable insights into the factors influencing drug delivery. Formulations containing HPMC K100 and Eudragit L100F4 and F10 exhibited the highest cumulative drug permeation over 24 hours, with values of 3232.38 ± 6.755 µg/cm² and 2895.19 ± 4.271 µg/cm², respectively. These formulations demonstrated a significant increase in drug flux compared to others, indicating the importance of polymer composition in enhancing skin penetration. Increasing the HPMC concentration in these formulations further enhanced drug penetration, suggesting that HPMC plays a crucial role in improving skin permeation. However, despite the increased permeation, the required flux was not achieved with these compositions, highlighting the need for additional strategies to enhance drug delivery. The inclusion of Dimethyl Sulfoxide (DMSO) as a penetration enhancer in formulations F7 to F12 significantly improved the ex vivo skin permeation of Nifedipine. DMSO is known for its ability to disrupt the stratum corneum, facilitating enhanced drug diffusion through the skin barrier. Iontophoresis was conducted for 2 hours at a current of 0.5 mA, followed by 24 hours of passive diffusion.Iontophoresis facilitates drug transport through the skin by applying a low electrical current, which enhances the movement of charged drug molecules via electrorepulsion and electroosmosis. This technique has been shown to significantly increase the transdermal delivery of various drugs, including Nifedipine he successful permeation of Nifedipine through rat abdominal skin suggests that similar formulations may be effective for human skin, considering the similarities between rat and human skin permeability profiles. However, further studies are necessary to confirm the efficacy and safety of these formulations in human subjects. The combination of optimized polymer matrices, penetration enhancers like DMSO, and iontophoresis presents a promising approach to enhance the transdermal delivery of Nifedipine. These strategies not only improve drug permeation but also ensure that the required therapeutic flux is achieved, paving the way for the development of effective transdermal therapeutic systems for Nifedipine.
CONCLUSION:
In the present study, an attempt was made to formulate an anti-hypertensive drug Nifedipine in the form of transdermal patches using different ratios of HPMC K100 and Eudragit L100. These were evaluated for physico-chemical properties, ex vivo permeation and in vitro iontophoresis studies and were found to meet the required flux. From the results obtained, iontophoresis enhanced the drug release from the Nifedipine transdermal patches compared with the chemical method using penetration enhancer DMSO. The transdermal patches of Nifedipine with required flux could be prepared with suitable mechanical properties; further studies are recommended to find their therapeutic utility in humans by pharmacokinetic and pharmacodynamic studies.
REFERENCES


Kolluru Lavanya, Dr. B. Nagamani, B. Renuka, Dr. P. Umadevi, Formulation and Evaluation of Nifedipine Transdermal Drug Delivery Systems, Int. J. of Pharm. Sci., 2025, Vol 3, Issue 6, 5158-5168. https://doi.org/10.5281/zenodo.15753454
 10.5281/zenodo.15753454
