1Research Scholar, S.G.S.P.S Institute of Pharmacy, Kaulkhed, Akola-444001
2Department of Pharmaceutics, S.G.S.P.S Institute of Pharmacy, Kaulkhed, Akola-444001
3Principal, S.G.S.P.S Institute of Pharmacy, Kaulkhed, Akola-444001
The objective of the present study was to formulate and evaluate oral microspheres of Glipizide to achieve sustained drug release and improve patient compliance in the treatment of type 2 diabetes mellitus. Microspheres offer numerous advantages including controlled drug delivery, reduced dosing frequency, and improved therapeutic efficacy. In this work, Glipizide-loaded microspheres were prepared using the solvent evaporation technique, employing sodium alginate and ethyl cellulose as polymeric carriers. A factorial design was utilized to optimize formulation parameters, including drug-to-polymer ratio and emulsification conditions. The prepared microspheres were characterized for particle size, entrapment efficiency, micromeritic properties, and in-vitro drug release. Scanning Electron Microscopy (SEM) revealed uniform, spherical particles with smooth surfaces. FTIR studies confirmed drug-polymer compatibility with no significant interaction. The optimized batch demonstrated high drug entrapment and sustained release of Glipizide over a 12-hour period, following a controlled-release kinetic model. Stability studies conducted under accelerated conditions showed no significant changes in physical appearance, drug content, or release profile. The results suggest that oral microspheres of Glipizide can serve as a potential drug delivery system offering prolonged therapeutic effect and better glycemic control. This study highlights the successful application of microsphere technology in developing effective sustained-release oral formulations.
Oral drug delivery remains the most preferred route of administration due to its ease, patient compliance, and cost-effectiveness [1-3]. However, certain drugs with a short biological half-life and narrow absorption window in the upper gastrointestinal tract present significant challenges for maintaining therapeutic plasma levels through conventional dosage forms. Glipizide, a second-generation sulfonylurea used in the treatment of type 2 diabetes mellitus, is one such drug that undergoes extensive hepatic metabolism and requires frequent dosing, potentially leading to poor patient adherence [4-7].
To address these limitations, controlled-release drug delivery systems such as microspheres have gained considerable attention [8-9]. Microspheres are free-flowing, multiparticulate carriers that can encapsulate active pharmaceutical ingredients and release them in a controlled manner over an extended period [10]. Various polymers like hydroxypropyl methylcellulose (HPMC), ethyl cellulose, and sodium alginate are commonly employed in their formulation due to their biocompatibility and ability to modulate drug release [11-12].
Several studies have demonstrated the effectiveness of microsphere systems in enhancing the bioavailability and therapeutic efficacy of drugs like Glipizide. However, formulation variables, polymer selection, and entrapment efficiency remain critical parameters that influence the overall performance of the microspheres [13-15].
The objective of the present study is to formulate and evaluate oral microspheres of Glipizide using suitable polymers to achieve sustained drug release, improve therapeutic efficacy, and enhance patient compliance [16-19].
MATERIALS AND METHOD:
Materials
Glipizide (gifted by IPCA Labs), HPMC, Ethyl cellulose, Sodium alginate, and other analytical-grade reagents were used [20].
Methods
Glipizide oral Microspheres were prepared by ionotropic gelation method using different proportion of polymers as shown in table 1 [21]. Sodium alginate solution was added to weighed amount of ethyl cellulose dissolved in required quantity of ethanol. Weighed quantity of drug and polymer was triturated to form fine powder then added to above solution [22-25]. Sodium Bicarbonate, a gas forming agent was added to this mixture and the resulting solution was stirred uniformly using a 26 gauge syringe needle the above solution was dropped into 100 ml of gently agitated calcium chloride 4% w/v solution to obtain microspheres. The solution containing microspheres was stirred slowly using magnetic bead for 10 min [26-28]. the microspheres were further allowed to remain in the same solution for 20 minutes to improve mechanical strength. The formed microspheres were filtered, washed with distilled water air dried at room temperature and stored in desiccators.
Table 1: Microspheres Formulation Chart
|
Formulation Code |
Glipizide (mg) |
NaCMC (gm) |
EC (gm) |
NaHCO3 (mg) |
Na-Alg (gm) |
CaCl2 (%w/v) |
|
F1 |
300 |
0.750 |
0.500 |
150 |
1.50 |
4 |
|
F2 |
300 |
1 .00 |
1.00 |
50 |
1.50 |
4 |
|
F3 |
300 |
0.500 |
0.750 |
200 |
1.50 |
4 |
|
F4 |
300 |
1.00 |
1.50 |
100 |
1.50 |
4 |
|
F5 |
300 |
0.750 |
0.500 |
250 |
1.50 |
4 |
|
F6 |
300 |
0.750 |
1.00 |
250 |
1.50 |
4 |
|
F7 |
300 |
1.00 |
0.750 |
500 |
1.50 |
4 |
|
F8 |
300 |
1.50 |
0.500 |
125 |
1.50 |
4 |
|
F9 |
300 |
1.00 |
1.500 |
50 |
1.50 |
4 |
|
F10 |
300 |
2.25 |
0.750 |
100 |
1.50 |
4 |
Evaluation Parameters
Preformulation Studies:
The preformulation studies, which were performed include:
Identification Test for Drug- Determination of melting Point:
Test from U V spectrophotometer:
Standard stock solution was determined by dissolving Glipizide in phosphate buffer pH 7.4 to make the final concentration of 1 mg /ml. Different aliquots were taken from stock solution and diluted with phosphate buffer pH 7.4 respectively to prepared the series of concentration & the lmax was measured between 200-400 nm [29].
Preparation of phosphate buffer pH 7.4:
Accurately weighed 1.44gm of disodium hydrogen phosphate (Na2 HPO4),0.24 gm potassium dihydrogen phosphate (KH2PO4), 8.0 gm sodium chloride (NaCl) and 0.20 gm potassium chloride (KCl) and dissolve in sufficient distilled water to produce 1000 ml.
Preparation of stock solution:
Glipizide (10 mg) as accurately weighed and transferred in a 100 ml volumetric flask and dissolved in small amount of phosphate buffer pH 7.4 by shaking gently and volume was made up to 100 ml with phosphate buffer pH 7.4. A working standard stock solution (10 µg/ ml) was obtained by diluting 10 ml of this solution to 100 ml by phosphate buffer pH 7.4 in volumetric flask [30].
Determination of λmax:
The λmax of drug sample was determined by scanning 10 µg/ml standard stock solution in range from 200 to 400 nm using shimadzu 1700 UV spectrophotometer.
Preparation of Calibration Curve:
Calibration curve of Glipizide was obtained by preparing the standard solution by dissolving 10 mg of Glipizide in phosphate buffer pH 7.4 in 100 ml volumetric flasks separately from the standard solution. A series of dilution of Glipizide was obtained. max 222 nm forlAbsorbance was taken for each dilution from UV spectrophotometer at phosphate buffer pH 7.4.
FT-IR spectra study:
The IR absorbance spectrum of Glipizide was recorded using FTIR 8400S spectrometer (Shimadzu) over range of 4000 to 400 cm-1. The IR spectroscopy theory utilizes the concept that molecules tend to absorb specific frequencies of light that are characteristic of the corresponding structure of the molecules. The energies are reliant on the shape of the molecular surfaces, the associated vibronic coupling, and the mass corresponding to the atoms.
The IR absorbance spectrum of Glipizide was recorded using FTIR 8400S spectrometer (Shimadzu) over range of 4000 to 400 cm-1.
Solubility Study:
Solubility of the drug was determined by dissolving in ratio of 1 mg of the drug in 1 ml of different solvents and buffer solutions. An excess amount of drug was suspended in 20 mL of each solvent measured into glass vessel fitted with glass stoppers (e.g. centrifuge tubes, flasks), and the vessels were tightly Stoppard. The closed vessels were then stirred for 24 h at the test temperature (A stirring device capable of operating at constant temperature was used, e.g. magnetic stirring in a thermostatically controlled water bath) and kept at rest for 1 h to attain equilibrium. The contents of the vessel were then centrifuged. The supernatant solutions were then filtered through a Whatman filter paper (No. 1) to ensure that they were free of particulate matter before sampling and then after suitable dilution with the appropriate aqueous/buffer solution the solubility of drug was determined at λ, 222 nm using UV spectrophotometer. Solubility of ibuprofen in different aqueous media was determined. Different aqueous media were maintained.
Polymers Identification:
Infrared spectroscopy of Drug and sodium alginate was performed using FTIR Spectrophotometer the spectrum was recorded in the wave length region of 400-4000 cm-1
Loss on Drying:
This method is used to determine the moisture content of by measuring the weight loss after drying of sample.
Evaluation of Prepared Microspheres:
In-vitro Dissolution Studies:
The release rate of microspheres was determined in a United States Pharmacopoeia Standard basket type dissolution apparatus. A weighed amount of microspheres equivalent to required amount of drug was filled into a hard gelatin capsule size ‘0’ number and placed in the basket of dissolution rate apparatus containing dissolution medium. The dissolution fluid was maintained at 37 ± 1° and rotation speed at a 50 rpm. Perfect sink conditions prevailed during the drug release study. 5ml samples were withdrawn at each time interval, passed through a 0.25 µm membrane filter (Millipore), and analyzed using UV Spectrophotometer to determine the concentration present in the dissolution medium. The initial volume of the dissolution fluid was maintained by adding 5 ml of fresh dissolution fluid after each withdrawal.
Stability Studies of Microspheres:
Stability Studies were performed according to ICH guidelines. Optimized formulation was packed in a glass vial sealed with aluminum foil and rubber cap and kept for three months at 25±50C and 75% RH & 40±50C and 75% RH in stability chamber. At the end of studies microsphere were evaluated for % drug release, % Drug Content.
RESULTS AND DISCUSSION:
Identification Test for Drug:
Physical Appearance: The drug substances colour was recorded as subjective description, white or almost white, crystalline powder.
Melting Point Determination: Melting point of the Glipizide was found 2080 C as reported in literature and drug profile this is indicated the drugs purity. The melting point of the drug was determined using Digital Melting Point Apparatus.
Solubility: Solubility study is done by 1 mg/ml ratio as seen there is different solvents are taken Water, Alcohol, Ether and Acetone are taken in which drug is insoluble & Alcohol and sparingly soluble in Acetone and soluble in dichloromethane and dilute solutions of alkali hydroxides. Solubility studies were carried out in water, Simulated Gastric Fluid and Simulated Intestinal Fluid. Saturated solutions were prepared in screw capped tubes by adding excess drug to the solvents and shaking for 24 hours at 25±0.5°C. The solutions were then filtered, diluted and analyzed.
Table 2: Solubility of Glipizide
|
Sr. No. |
Solvents |
Result |
|
1 |
Water |
Insoluble |
|
2 |
Alcohol |
Insoluble |
|
3 |
Dichloromethane |
Soluble |
|
4 |
Dilute solutions of alkali hydroxides. |
Soluble |
|
4 |
Acetone |
Sparingly Soluble |
UV- Spectrophotometery:
UV Spectrophotometery studies were carried out in media phosphate buffer pH 7.4. in the max obtained was recorded was 222nm, inlscanning range 200 nm to 400 nm. The phosphate buffer pH 7.4.
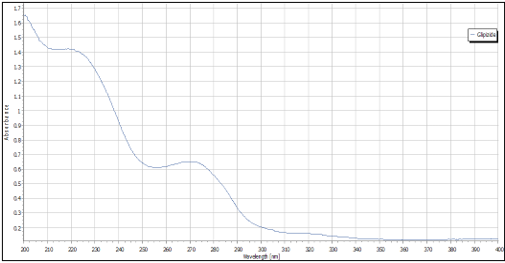
Figure 1: lmax Scan for Glipizide at 222nm in phosphate buffer pH 7.4
FTIR Spectra of Pure Drug:
FTIR spectra of pure Glipizide sample recorded by FTIR spectrum is shown in below figure, which was compared with standard functional group.
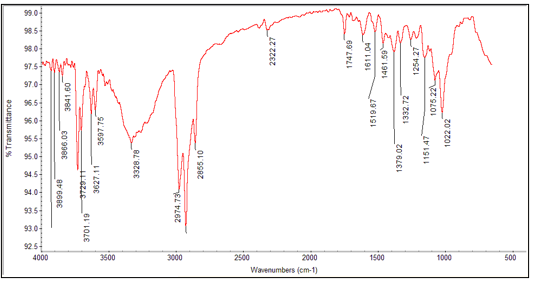
Figure 2: FTIR Spectra of Glipizide
Table 3: IR Frequencies of Glipizide
|
Functional Group |
Observed frequencies(cm-1) |
|
NH Stretching |
3597.75 |
|
C-H Stretching |
2974.73 |
|
C=O Stretching |
1611.04 |
|
CONH Stretching |
1747.69 |
|
S=O |
1151.47 |
Compatibility studies between drug and excipient:
The drug excipients compatibility studies, the sample which was kept at various accelerated conditions were withdrawn and carried out physical characteristics evaluate like color changed at different intervals. The drug polymer interaction study was carried out by IR spectroscopy. The IR spectrum of combination of drug and various polymers to be used in the formulation was obtained using FTIR spectrophotometer and compared with the individual spectra of drug and polymer to investigate any interactions.
Table 4: FTIR Spectra of Drug + Excipients
|
Sr. No. |
Functional Groups |
Observed frequencies (cm-1) |
|
1 |
NH-stretching |
3328.78 |
|
2 |
C-H-stretching |
2974.73 |
|
3 |
CONH stretching |
1606.67 |
|
4 |
C=O stretching |
1688.38 |
|
5 |
S=O stretching |
1023.47 |
Preparation of calibration curve for estimation of drug:
There is the dilution of drug in phosphate buffer 10µg/ml and by the using of spectrophotometer lmax run then lmax come on 222 nm.
Calibration curve:
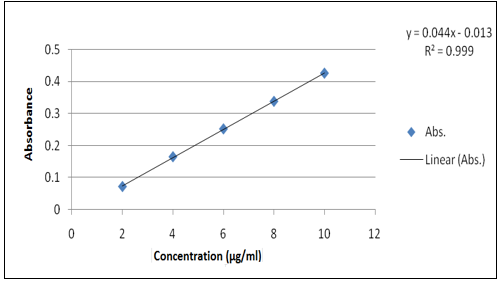
Figure 3: Calibration Curve of Glipizide in Phosphate Buffer 7.4
Loss on drying:
Loss on drying is measured by taking weighed amount (300 mg) of drug in Petridish and kept in hot air oven at 105°C until the Wight reduction stopped in definite time interval.
Evaluation of Prepared Microspheres:
Particle size measurement: The particle size analysis was carried out using optical microscope for all the formulations. F1 showed the smallest particle size and highest Particle size was observed in F5 formulation. The average particle size was observed between 41.04 to 89.63μm.
Surface morphology microspheres (SEM): The surface morphology of the Glipizide microspheres was studied by SEM. SEM photograph of the Formulation F5 was shown in the Fig7.5. Surface smoothness of the microspheres was increased with the increase in the polymer concentration, which was confirmed by SEM. At lower polymer conc. Surface was rough and crumpled and at higher polymer conc. the microspheres with smooth surface were obtained.
In-vitro Drug release studies:
In-vitro drug release of prepared microsphere were carried out in 900 ml of Phosphate buffer pH 7.4 using USP Standard eight stage basket type dissolution rate test apparatus. Temp of the dissolution medium was maintained at 37±0.5 ?C a rotating speed of 50 rpm the further information shows as following.
Table No. 5: In-vitro Drug release profile of Glipizide microspheres
|
Time (Hr) |
F1 |
F2 |
F3 |
F4 |
F5 |
F6 |
F7 |
F8 |
F9 |
F10 |
|
0 |
0 |
0 |
0 |
0 |
0 |
0 |
0 |
0 |
0 |
0 |
|
1.5 |
21.63 |
15.14 |
25.52 |
19.47 |
22.71 |
16.44 |
20.55 |
24.66 |
17.74 |
22.50 |
|
3 |
27.69 |
24.87 |
31.37 |
28.55 |
30.28 |
24.87 |
29.85 |
30.28 |
26.61 |
29.85 |
|
4.5 |
35.91 |
36.34 |
38.50 |
36.34 |
38.50 |
33.53 |
41.32 |
37.21 |
35.91 |
36.77 |
|
6 |
46.94 |
47.59 |
49.32 |
44.35 |
49.75 |
39.80 |
51.49 |
46.73 |
44.56 |
42.18 |
|
7.5 |
53.65 |
53.22 |
59.90 |
56.46 |
54.95 |
49.11 |
59.49 |
55.60 |
51.27 |
52.35 |
|
9 |
67.28 |
64.25 |
64.25 |
63.17 |
64.25 |
58.84 |
63.60 |
63.17 |
59.49 |
61.87 |
|
10.5 |
72.25 |
69.87 |
70.31 |
69.44 |
72.25 |
65.58 |
67.50 |
71.39 |
66.63 |
68.58 |
|
12 |
80.26 |
77.01 |
80.77 |
79.18 |
81.77 |
74.85 |
78.31 |
81.02 |
76.58 |
79.39 |
Values are mean of 3reading ± SD
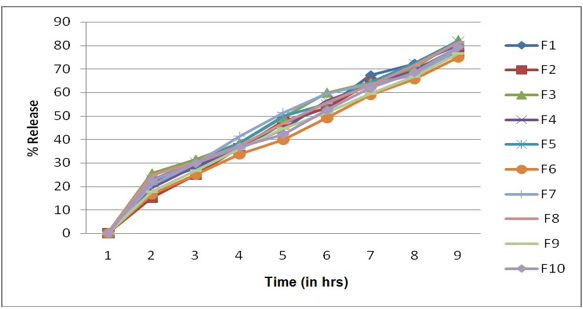
Figure No. 4: 6 % Drug Release versus time graph of each formulation
Accelerated Stability Studies:
Stability of preparation is an important factor to estimate the quality of the dosage forms. Thus accelerating testing was carried out to study on stability of optimized Glipizide loaded microspheres. The results showed no marked change in physical properties (color, surface morphology and particle flow) and no significant difference in was observed Drug release and drug content in comparison with the Glipizide loaded microspheres before storage in stability chamber.
Table 6: Accelerated stability study for optimized formulation
|
Temperature & Humidity |
Items |
Days |
||||
|
0 |
30 |
60 |
Colour |
|||
|
25±5°C& 75%RH |
%Drug release |
F5 |
81.77±0.17 |
80.61±0.15 |
79.82±0.19 |
Light Brown Yellow |
|
Drug content (%) |
99.15±0.12 |
98.75±0.27 |
97.95±0.37 |
|||
|
40±5°C& 75%RH |
%Drug release |
F5 |
81.77±0.37 |
80.32±0.12 |
79.44±0.52 |
Light Brown Yellow |
|
Drug content (%) |
99.15±0.15 |
98.10±0.13 |
97.15±0.10 |
|||
CONCLUSION
Oral microspheres of Glipizide showed potential for sustained release, improved bioavailability, and enhanced patient compliance. Further in-vivo studies and scale-up trials are suggested for commercial development.
ACKNOWLEDGEMENT
The authors gratefully acknowledge the support of SGSPS Institute of Pharmacy, Kaulkhed, Akola, the management, respected principal, and all faculty members. Special thanks to family and friends for their encouragement throughout this work.
REFERENCES


Anjali Sukoshe*, S. R. Fulmali, Nitin Bhajipale, Formulation And Evaluation of Oral Microspheres, Int. J. of Pharm. Sci., 2025, Vol 3, Issue 6, 3912-3921. https://doi.org/10.5281/zenodo.15730029
 10.5281/zenodo.15730029
