Department of Pharmaceutics, Centre for Pharmaceutical Sciences, UCESTH, Jawaharlal Nehru Technological University, Hyderabad, Kukatpally, Telangana, India. 500085
Crystal engineering of pharmaceutical cocrystals has emerged as a promising technique to enhance the solid-state behaviour of drugs, especially in cases where the solubility of the active pharmaceutical ingredient (API) is inadequate. Cocrystals are defined as crystalline materials composed of an API and a coformer in a fixed stoichiometric ratio, held together by non-covalent forces like hydrogen bonding. These systems can improve drug performance by modifying properties such as solubility, stability, and dissolution rate without altering the drug's chemical structure. In this work, cocrystals of telmisartan (TEL) and candesartan (CAN), both commonly used antihypertensive agents, were developed using ascorbic acid (AA) as a coformer. The preparation of TEL–AA and CAN–AA cocrystals was carried out via solvent evaporation. Initial evaluation involved solubility measurements, melting point analysis, and Fourier-transform infrared (FTIR) spectroscopy. Powder X-ray diffraction (PXRD) analysis revealed unique patterns for the cocrystals, distinct from those of the pure drugs and coformer, confirming the formation of new crystalline structures. The cocrystals exhibited enhanced solubility and intrinsic dissolution rates compared to the individual APIs. These results suggest that cocrystallization is a viable strategy for improving the solubility and dissolution profile of poorly water-soluble drugs, potentially leading to better bioavailability and therapeutic outcomes.
One of the primary objectives in solid-state pharmaceutical development is to enhance the solubility of active pharmaceutical ingredients (APIs) while maintaining their stability in solid form. A significant number of pharmaceutical compounds have limited solubility in water, which in turn restricts their ability to be absorbed in the body and diminishes their therapeutic potential. In recent years, cocrystals have gained significant attention as a promising strategy to address this challenge. Pharmaceutical cocrystals are defined as multicomponent crystalline structures composed of an API and a coformer—an inactive but pharmaceutically acceptable compound—combined in a specific stoichiometric ratio through noncovalent interactions such as hydrogen bonding. Importantly, these interactions preserve the molecular integrity of the drug while offering the potential to modify its physicochemical properties.
Cocrystals present a valuable alternative to traditional solid-state modifications such as salts, amorphous forms, and metastable polymorphs. Unlike salt formation, cocrystallization does not require ionizable functional groups and offers greater flexibility in selecting coformers. Furthermore, cocrystals can convert poorly crystallizable or amorphous APIs into stable crystalline forms, improving their handling, shelf-life, and manufacturability. They also provide opportunities to enhance drug solubility, dissolution rate, and bioavailability without altering the covalent structure of the API. Given these advantages, cocrystallization has become an attractive option in formulation science. In this context, the present study focuses on the development of cocrystals for two antihypertensive drugs—telmisartan and candesartan—both known for their poor aqueous solubility. Ascorbic acid, a safe and commonly used coformer, was selected for this purpose. This work focused on improving the solubility and formulation-relevant properties of the selected drugs by forming stable cocrystals with a suitable coformer. By employing crystal engineering techniques, this work explores a rational approach to overcoming solubility limitations and improving the overall performance of telmisartan and candesartan in solid dosage forms.
MATERIALS AND METHODS:
Materials:
Table 1: List of Materials
|
Sr. No. |
Drug and Coformer |
Manufacturer |
|
1. |
Telmisartan |
MSN Pharmachem |
|
2. |
Candesartan |
MSN Pharmachem |
|
3. |
Ascorbic acid |
SRL Chemicals |
|
4. |
Citric acid |
Research Lab |
|
5. |
Nicotinic acid |
Avra Synthesis |
|
6. |
Glycine |
Finar Chemicals |
|
7. |
Fumaric acid |
Avra Synthesis |
|
8. |
Ethanol |
CSS Chemicals |
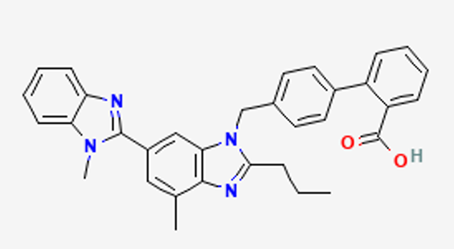
Fig 1: Telmisartan

Fig 2: Candesartan
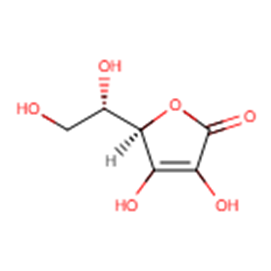
Fig 3: Ascorbic acid
Equipments:
Table 2: List of Equipments
|
Sr. No. |
Name of Equipment |
Supplier |
|
1. |
Weighing Balance |
Essae weighing balance |
|
2. |
Water Bath |
Dwaraka Scientifics |
|
3. |
Mini Rotary Shaker |
Remi RS-12R |
|
4. |
Shaking Incubator |
Labtech Daihan Labtech |
|
5. |
Melting point Apparatus |
Sisco Instruments |
|
6. |
UV Spectrophotometer |
Shimadzu UV-1800 |
|
7. |
Dissolution Apparatus |
Labindia DS 8000 |
|
8. |
FT-IR |
Bruker Alpha T |
Coformer Selection:
Selection of coformer is done using pKa based method. The pKa difference between an acid and base can be used as a predictive tool to determine whether the resulting complex will form a salt or a cocrystal. The ability of certain drugs to be absorbed after oral administration depends on their acid dissociation constant (pKa). Whether a salt or a cocrystal forms between an acid and a base can often be predicted by analysing proton transfer potential, determined by the difference in their pKa values,
ΔpKa = (pKa of the base − pKa of the acid)
If ΔpKa (pKa of base – pKa of acid) is < 0, cocrystal formation is likely. If ΔpKa is > 3, salt formation is favoured. Within the 0–3 interval, both scenarios are feasible, hence practical validation is needed.
Table 3: Drug and Coformer pKa values
|
Drug (pKa) |
Coformer (pKa) |
Difference of pKa |
|
Telmisartan (pka-5.86) |
Citric acid (pKa-3.13) |
2.73 |
|
Ascorbic acid (pKa-4.7) |
1.16 |
|
|
Nicotinic acid (pKa-4.75) |
1.11 |
|
|
Fumaric acid (pKa-3.03) |
2.83 |
|
|
Glycine (pKa-2.37) |
3.49 |
|
|
Candesartan (pKa-4.25) |
Citric acid (pKa-3.13) |
1.12 |
|
Ascorbic acid (pKa-4.7) |
-0.45 |
|
|
Nicotinic acid (pKa-4.75) |
-0.5 |
|
|
Fumaric acid (pKa-3.03) |
1.22 |
|
|
Glycine (pKa-2.37) |
1.88 |
Method:
Solvent Evaporation method:
Telmisartan and Candesartan with coformers at 1:1 stoichiometric ratio was stirred in Ethanol: water (1:1) 10ml for 30 minutes in a china dish and the slurry was evaporated by using water bath at 60°c.
Table 4: Drug and Coformers quantity in formulation
|
Drug (mg) |
Coformers |
Coformers Weight (mg) |
|
Telmisartan (0.001M) 514.6 |
Citric acid |
192.12 |
|
Ascorbic acid |
176.12 |
|
|
Nicotinic acid |
123.11 |
|
|
Fumaric acid |
116.07 |
|
|
Glycine |
75.07 |
|
|
Candesartan (0.003M) 1328.0 |
Citric acid |
576.36 |
|
Ascorbic acid |
528.30 |
|
|
Nicotinic acid |
369.33 |
|
|
Fumaric acid |
348.21 |
|
|
Glycine |
225.20 |
Analytical Method Development:
Phosphate buffer (pH 7.4) was used as solvent for the development of the UV analysis method. The Telmisartan and Candesartan solutions were scanned in the 200-400 nm range in order to obtain the absorption spectrum.
Calibration Curve in phosphate buffer 7.4:
The standard stock solution of Telmisartan and Candesartan was prepared in phosphate buffer 7.4 to produce the concentration of 100µg/ml by dissolving accurately weighed quantity of drug. Series of working solutions were prepared in the range 2-10µg/ml for Telmisartan and 5-25µg/ml for Candesartan by appropriate dilutions of the standard stock solution. The calibration curve was created by recording the absorbance of the working solutions and plotting the absorbance against concentration.
EVALUATION TECHNIQUES:
Solubility studies:
By applying the shake-flask method (24 h), the saturation solubility of Telmisartan and Candesartan along with their cocrystals was evaluated. In this investigation, extra amount of drug and cocrystals was added into vials with 10 ml of water. This was shaken with a mechanical shaker at room temperature for 24 hours. After filtering the mixture, a spectrophotometric analysis at 293 nm for Telmisartan and 252 nm for Candesartan was performed to determine how much amount of drug and cocrystals had been dissolved.
Flow Properties:
Bulk Density:
To determine bulk density, a pre-weighed quantity of powder was introduced into a graduated cylinder, and the volume occupied was measured to calculate the density.
Bulk Density = weight of powder
bulk volume of powder mixed
Tapped Density:
Tapped density was determined by taking powder into a graduated cylinder and tap the cylinder 100 times and measuring its volume and weight.
Tapped density = weight of powder
Tapped volume of powder mixed
Angle of Repose:
The angle of repose was measured by allowing the powder to pass through a funnel onto a flat surface and recording the angle of the resulting pile relative to the horizontal.
Tan θ = Height of the heap
Radius of the heap
Hausner’s Ratio:
It indicates the flow properties of the powder and ratio of tapped density to the bulk density of powder.
Hausner’s Ratio = Tapped density
bulk density
Carr’s index:
The flow property of the material was assessed by calculating Carr’s index, which was derived from the measured bulk density (BD) and tapped density (TD), it is calculated using the formula:
= TD − BD × 100
TD
Determination of Melting point:
Melting point determination using a melting point apparatus is a simple yet effective method in cocrystal studies to indicate the formation of a new crystalline phase. Cocrystals generally show a melting point different from those of the pure API, coformer, and their physical mixture. The melting point was determined by capillary method.
Fourier Transform Infrared Spectroscopy (FTIR):
Infrared spectroscopic analysis was carried out for cocrystal characterization. The samples were scanned using Bruker Alpha T Spectrophotometer.
Powder X-ray diffraction (XRD) studies:
Powder X-ray diffraction (PXRD) was employed to characterize the synthesized cocrystals. The diffraction patterns provided insights into their crystal structure, chemical composition, and physical properties. PXRD analysis, by detecting modifications in the crystal lattice, provides a reliable approach for studying polymorphic transformations, pharmaceutical salts, and co-crystalline systems. The samples were exposed to a copper tube with a 40KV voltage, and the spectra were recorded using a 35mA current. With a step size of 0.020°, total time 38.40secs and a scan range of 10° to 60°.
Intrinsic Dissolution studies:
Utilising the USP paddle method, the dissolving rate investigations were carried out in 900 ml of pH 7.4 phosphate buffer at 75 rpm and 37?c, at regular time intervals 10, 20, 30, 40, 50 and 60 min, 5ml of samples were withdrawn and immediately replaced with an equal volume of fresh dissolution medium. Dissolution equipment Labindia DS 8000 was used for studies. Dissolution profiles of API’s were compared with the cocrystals formed.
RESULTS AND DISCUSSION:
Analytical Method Development:
The analytical method for Telmisartan and Candesartan was developed and validated for the quantification of drug in the bulk. The method was developed in the phosphate buffer pH 7.4.
Telmisartan:
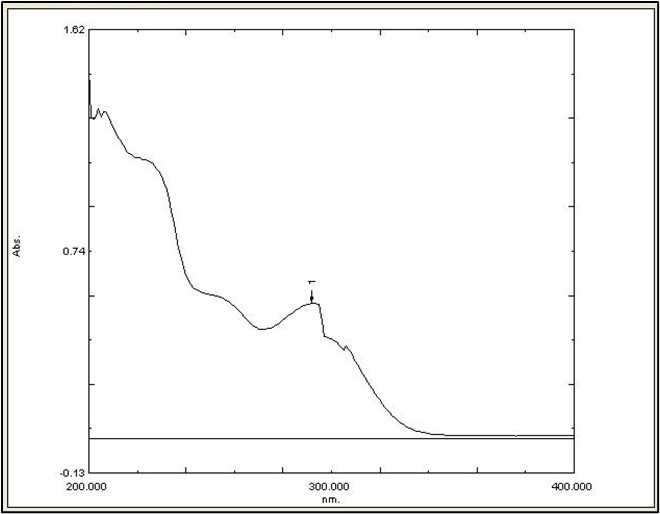
Fig 4: Telmisartan Absorption Spectrum in phosphate buffer 7.4 (λmax-292nm)
Table 5: Concentration and absorbance of Telmisartan in phosphate buffer 7.4 at 292nm.
|
Concentration (µg/ml) |
Absorbance |
|
2 |
0.138 |
|
4 |
0.223 |
|
6 |
0.285 |
|
8 |
0.390 |
|
10 |
0.536 |
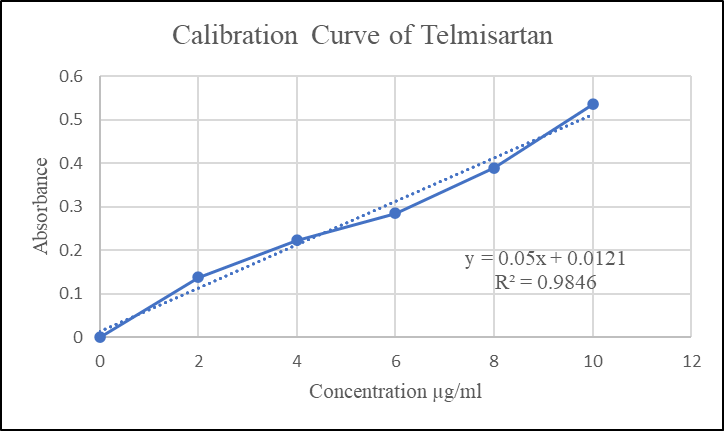
Fig 5: Calibration Curve of Telmisartan in phosphate buffer 7.4
Candesartan:
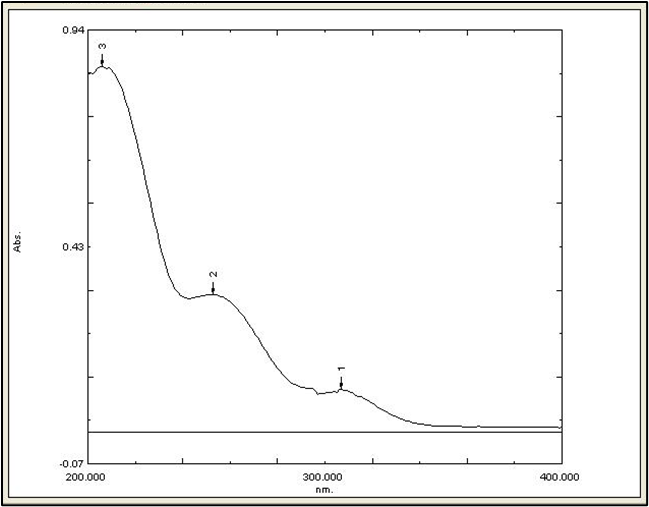
Fig 6: Candesartan Absorption Spectrum in phosphate buffer 7.4 (λmax-252nm)
Table 6: Concentration and absorbance of Candesartan in phosphate buffer 7.4 at 252nm
|
Concentration (µg/ml) |
Absorbance |
|
5 |
0.198 |
|
10 |
0.348 |
|
15 |
0.509 |
|
20 |
0.627 |
|
25 |
0.845 |
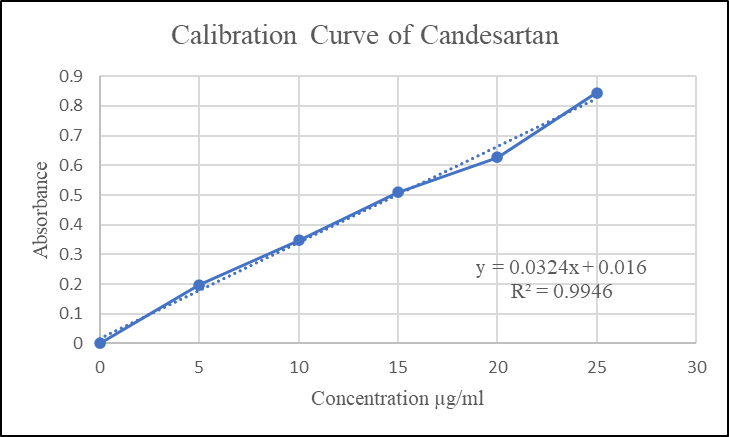
Fig 7: Calibration Curve of Candesartan in phosphate buffer 7.4
Flow Properties:
The flow properties such as Angle of repose, Carr’s index and Hausner’s ratio of APIs and Cocrystals were measured and tabulated in table 7. The flow properties of cocrystals showed improved properties over the APIs.
Table 7: Flow properties of API and Cocrystals
|
Property |
Telmisartan |
Candesartan |
||
|
API |
Tel + AA |
API |
Cand + AA |
|
|
Angle of repose (°c) |
41 |
26 |
43 |
25 |
|
Bulk Density (gm/cm3) |
0.525 |
0.682 |
0.43 |
0.74 |
|
Tapped density (gm/cm3) |
0.72 |
0.799 |
0.64 |
0.87 |
|
Carr’s index (%) |
27.08 |
17.3 |
32.8 |
15 |
|
Hausner’s ratio |
1.36 |
1.17 |
1.44 |
1.13 |
Solubility Studies:
Cocrystals of Telmisartan and Candesartan with Citric acid, Ascorbic acid, Glycine, Fumaric acid and Nicotinic acid were observed with more solubility enhancement than Pure API’s and Ascorbic acid cocrystals with API’s has shown highest solubility, so it is selected for further analysis FTIR, XRD, Dissolution, etc. which confirms the formation of cocrystals. The Solubility profiles are illustrated in fig 8 and 9.
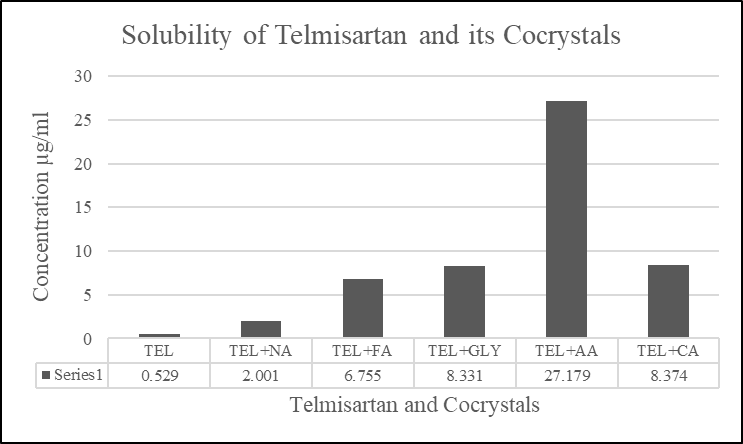
Fig 8: Telmisartan cocrystal solubility study in phosphate buffer 7.4
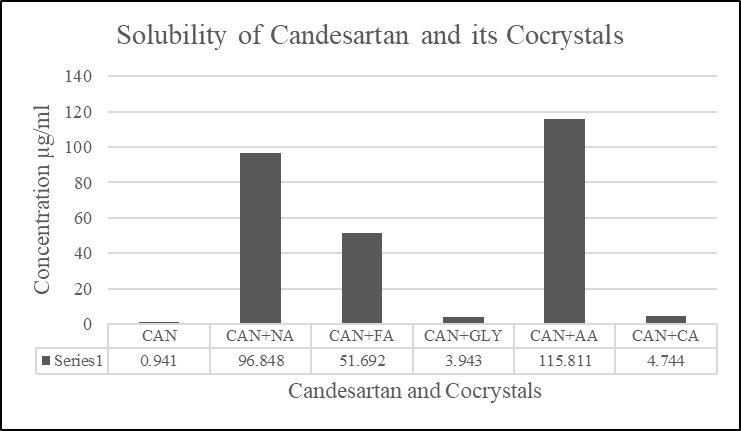
Fig 9: Candesartan cocrystal solubility study in phosphate buffer 7.4
Melting point:
Capillary method analysis was employed to determine the melting points of the pure API, coformer, and their cocrystals. The cocrystals exhibited distinct melting points compared to the API and coformer, indicating the formation of new crystalline phases, the values are tabulated in table 8.
Table 8: Melting point values of APIs, coformers and cocrystals
|
Melting point (°c) |
|||
|
Telmisartan |
Telmisartan |
Ascorbic acid |
Tel + AA |
|
260-265 |
185-190 |
190-200 |
|
|
Candesartan |
Candesartan |
Ascorbic acid |
Cand + AA |
|
160-165 |
185-190 |
150-155 |
|
FTIR:
Comparison of the IR spectrum of drug and cocrystal, clearly indicates that there is hydrogen bond formation between drug and coformer and new supramolecular synthon is formed.
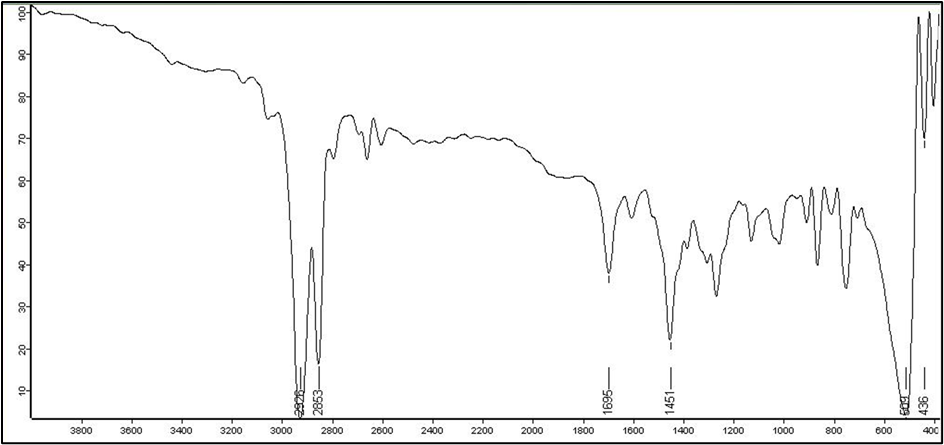
Fig 10:IR Spectra of Telmisartan
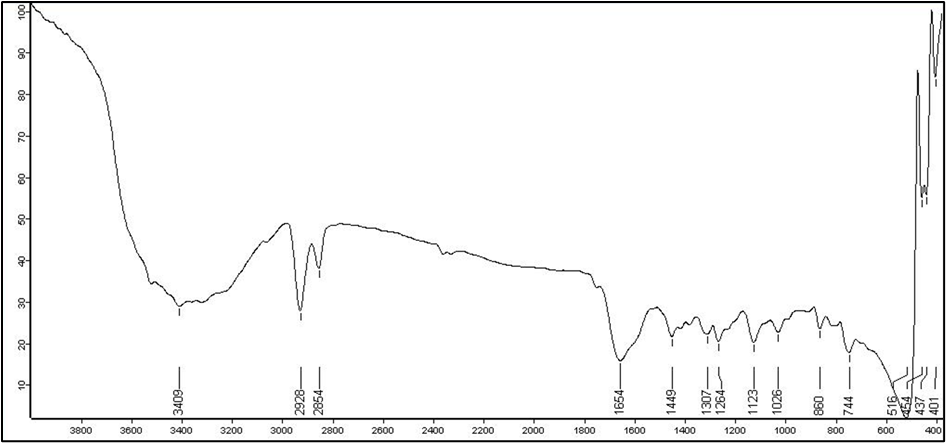
Fig 11: IR Spectra of TEL+AA Cocrystal
Table 9: Characteristic peaks of Telmisartan and Tel + AA Cocrystals
|
Wavenumber Region (cm-1) |
Interpretation |
|
|
API Peaks |
Cocrystal peaks |
Observation |
|
3400 |
3409 |
O-H stretching indicate altered H-bonding; stronger in cocrystal |
|
2926, 2853 |
2928, 2854 |
Aromatic/Aliphatic C-H stretching |
|
1695 |
1654 |
C=O stretching |
|
1451 |
1449 |
C-H bending |
|
1264, 1126 |
1264, 1123, 1026 |
C-O stretching |
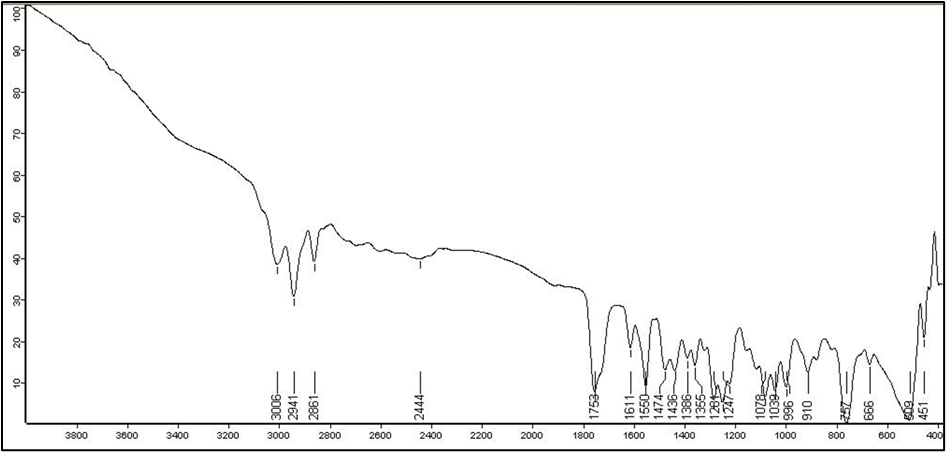
Fig 12: IR Spectra of Candesartan
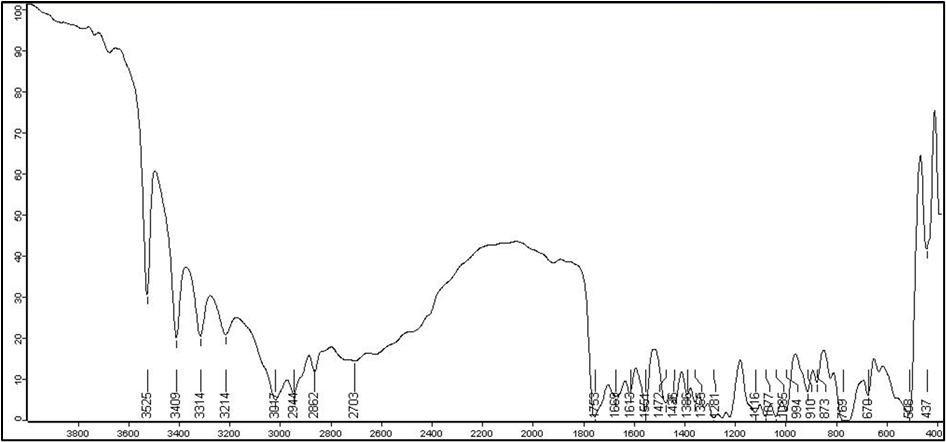
Fig 13: IR Spectra of CAN+AA Cocrystal
Table 10: Characteristic peaks of Candesartan and Cand + AA Cocrystals
|
Wavenumber Region (cm-1) |
Interpretation |
|
|
Peaks |
Cocrystal peaks |
Observation |
|
3006 |
3525, 3409, 3017 |
O-H stretching indicate hydrogen bonding |
|
2941, 2861 |
2948, 2862 |
C-H stretching |
|
1768 |
1686 |
C=O stretching, largest shift indicates significant change in bonding environment (likely stronger hydrogen bonding) |
|
1611 |
1613 |
C=C stretching |
|
1247, 1078 |
1281, 1107 |
C-O stretching |
Powder X-ray diffraction (PXRD):
Powder X-ray diffraction of TEL, TEL+AA, CAN, CAN+AA.
Figure14, 15, 16, 17 presents the PXRD patterns of the pure drugs and cocrystals. Material in powder state give distinctive peak of varying intensity at certain position. The PXRD patterns of cocrystals was distinguishable from components and additional peaks were appeared which did not exist in pure drug. The appearance of new diffraction peak in diffractogram of cocrystals shows formation of new crystalline phase.
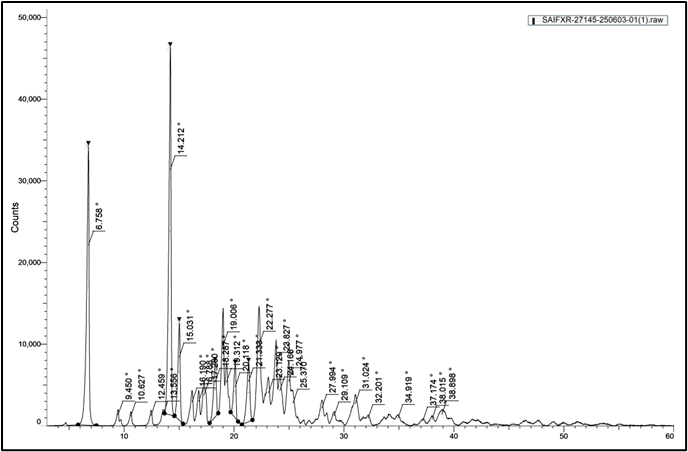
Fig 14: PXRD pattern for Telmisartan

Fig 15: PXRD pattern for TEL+AA
Telmisartan API: 14.21° (major crystalline peak), 6.76°, 19.0°, 22.28°, 23.83°, 24.98°.
Tel + AA Cocrystal: 22.35° (major crystalline peak), 6.79°, 14.23°, 18.36°, 19.80°, 25.09°, 28.05°.
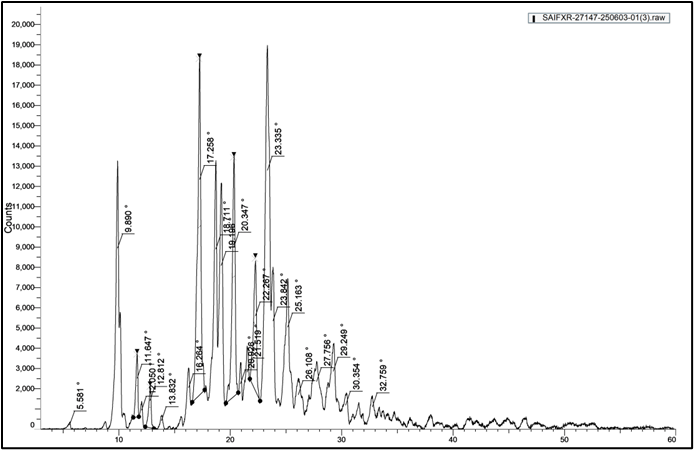
Fig 16: PXRD pattern for Candesartan
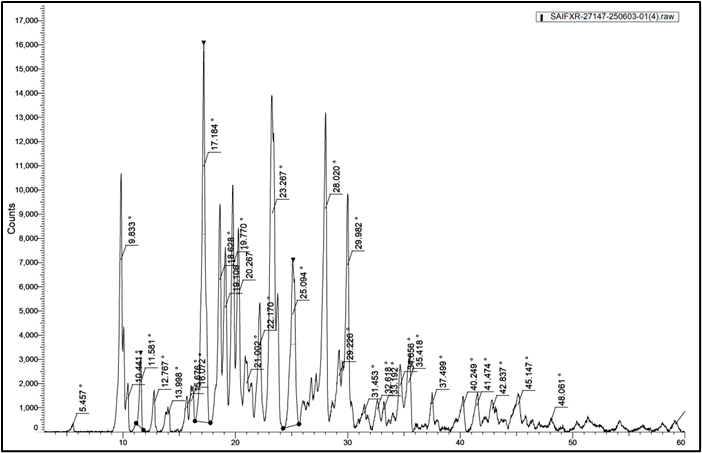
Fig 17: PXRD pattern for CAN+AA
Candesartan API: 23.335° (major crystalline peak), 17.258°, 20.347°, 9.890°, 18.711°, 19.196°.
Cand + AA Cocrystal: 17.184° (major crystalline peak), 28.020°, 23.267°, 9.833°, 29.982°, 19.770°.
Dissolution Profile:
The dissolution experiment was conducted on pure API and Cocrystals. The dissolution profile of the pure Telmisartan, Tel + AA cocrystal and pure Candesartan, Cand + AA cocrystal is shown in fig 18 and 19 respectively.
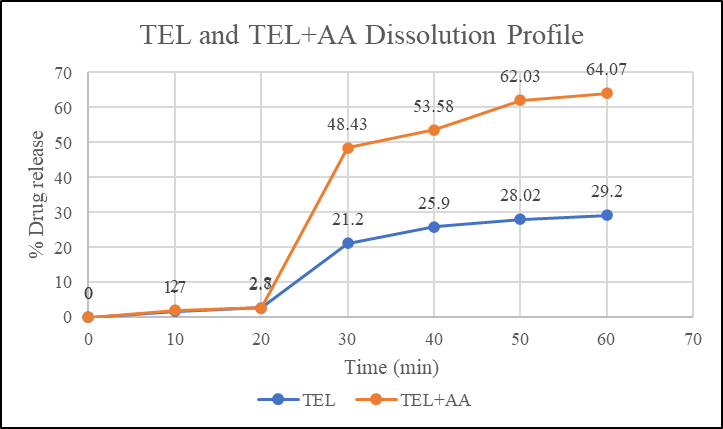
Fig 18: Drug release profile of Telmisartan and Tel + AA cocrystals
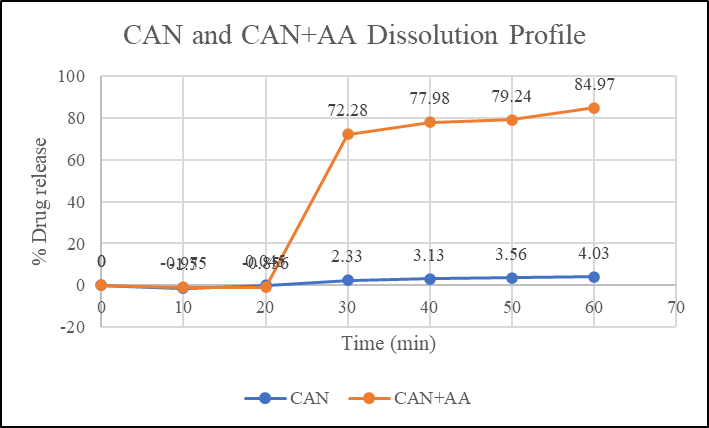
Fig 19: Drug release profile of Candesartan and Cand + AA cocrystals
Table 11: %Drug release profile of pure API and Cocrystals
|
Drug |
% Drug release profile |
|
|
API |
Cocrystal |
|
|
Telmisartan |
29.2% |
64.07% |
|
Candesartan |
4.03% |
84.97% |
CONCLUSION:
The co-crystallization approach was utilized to enhance the solubility of BCS Class II drugs through the solvent evaporation method. Telmisartan and Candesartan, widely prescribed antihypertensive agents, suffer from low oral bioavailability due to poor aqueous solubility. In this study, five different coformers were employed to improve their solubility. Coformers with a ?pKa value below 3 demonstrated better solubility enhancement compared to the pure APIs. Among them, the cocrystals of Telmisartan and Candesartan with Ascorbic acid exhibited the greatest solubility improvement, which was further confirmed by melting point, dissolution studies, FTIR, and PXRD analysis.
Solubility Studies:
The pure Telmisartan and Candesartan has exhibited a saturation solubility of 0.529±0.014 mg/ml and 0.941±0.02mg/ml respectively in phosphate buffer pH 7.4. Among the cocrystals, the cocrystals of Ascorbic acid has shown highest solubility, Tel + AA and Cand + AA has shown increased solubility of 27.179±0.07 mg/ml and 115.811±0.019 mg/ml respectively.
Flow properties:
The Angle of repose, Hausner’s ratio and Compressibility index of both cocrystals have improved over the pure APIs.
Melting point:
Distinct melting points observed for the cocrystals, compared to the pure API and coformer, indicate the formation of cocrystals.
FTIR study:
In the FTIR spectra of the cocrystals, characteristic O–H and C=O stretching vibrations along with broadened peaks were observed, which confirm the establishment of hydrogen bonding.
Dissolution Profile:
The dissolution was carried in phosphate buffer 7.4 for the duration of 60mins. The % drug release of Telmisartan and Candesartan are 29.2% and 4.03% respectively, and the % drug release of Tel + AA and Cand + AA cocrystals has enhanced to 64.07% and 84.97% respectively.
PXRD Study:
PXRD of the Telmisartan and Candesartan cocrystals with Ascorbic acid has exhibited new diffraction peaks; absent in the spectra of pure drug, indicating the formation of new crystalline structure.
The results clearly indicate that Ascorbic acid-based cocrystals significantly improved the solubility, dissolution rate, and flow properties of both drugs. Moreover, ?pKa calculations proved to be a useful tool in predicting suitable coformers. Overall, the findings establish co-crystallization as an effective strategy to address solubility challenges in poorly water-soluble drugs, offering enhanced formulation performance while maintaining the structural integrity of Telmisartan and Candesartan. The Telmisartan–Ascorbic acid and Candesartan–Ascorbic acid cocrystals show strong promise for future development into optimized oral dosage forms.
ACKNOWLEDGEMENT:
The authors sincerely thank all those who supported and assisted during the course of this research. We also gratefully acknowledge DST-SAIF, Cochin University of Science and Technology, for providing analytical support.
CONFLICT OF INTEREST:
The authors have no conflict of interest.
REFERENCES

R. Satya Deepthi, M. Sunitha Reddy, K. Anie Vijetha, Cocrystallization Approach for Solubility Enhancement of BCS Class II Anti-Hypertensive Drugs, Int. J. of Pharm. Sci., 2025, Vol 3, Issue 9, 849-862. https://doi.org/10.5281/zenodo.17068916
 10.5281/zenodo.17068916
