Abstract
One of the basic procedures for preserving instrument accuracy is calibration. The process of setting up an instrument to get a result for a sample that falls within an acceptable range. The Direct Standardization (DS) algorithm, which was first put forth for data translation between several physical instruments of the same kind, serves as its foundation. Information on tests conducted to calibrate different analysis tools and acceptance criteria is included in this evaluation. The primary issue with many technical aspects of such a precise calibration transfer is incorrect calibration. These include the measuring instrument's repeatability and reproducibility, the chemical reference values used for calibration, the multivariate mathematics used for calibration, and the sample's presentation. Chromatographic and spectrophotometric techniques have been used with this model. The results produced can be used as a criterion for comparison between the many approaches suggested for the same analysis, regardless of the instrument utilized. In particular, the deviation from the back-calculated concentrations expressed as a percentage of relative error (% RE) can be considered very useful for a clear evaluation of linearity. Several case studies are included to explain linearity assessment from a practical perspective. Analysis is necessary to select the most appropriate model for the experimental data and also to evaluate the linearity and homoscedasticity of the calibration curve. The use of an internal standard corrects for loss of analyte during sample preparation provided it is correctly chosen. Once the best regression model is selected, the analytical method must be validated using quality control (QC) samples prepared and stored at the same temperature as that intended for the study samples. Most international guidelines require parameters such as linearity, specificity, lower limit of quantification (LLOQ), matrix effect, and stability to be evaluated during the proof of concept. Despite the highly regulated field, some challenges remain regarding the validity of some analytical methods, including those where there is no matrix-free. Blank can be adjusted using slope.
Keywords
Analytical ultracentrifugation, Instrument calibration, Sedimentation velocity, Stokes radius analytical method, calibration, linearity, regression analysis, validation.
Introduction
Set to operate within the necessary range, the primary purpose of calibration is quality assurance, and each pharmaceutical instrument needs to have its accuracy tested regularly. ICH states that the act of comparing an instrument or device's output with that of the reference or traceable standard throughout a suitable range of measurement to demonstrate that it generates findings within predetermined bounds is known as calibration. In the pharmaceutical business, fast and accurate instrument calibration is crucial to guaranteeing the quality of a pharmaceutical product's manufacturing process. Before generating products for the market, calibration documentation is required. For optimal use, an instrument must be calibrated correctly, aiding in the accuracy of the instrument and adjusting it to the desired and appropriate precision for the given use and necessity. Calibration involves calibrating the equipment to measure the required range of values if it is outside of that range. This is the primary justification for why calibration, especially calibration of instruments, is crucial. Pharmaceutical companies also value calibration. Current calibration or regression software, whether instrument-based or posterior analysis, uses ordinary least squares as an estimate of the calibration parameters. In this paper, we compare the default or normal (ordinal least squares) regression approach applied to trace metal data. Lack of proper curve-fitting methodology. Ultracentrifugation (AUC) is a traditional technique used to measure the macroscopic redistribution of particles in a solution, allowing for the assessment of hydrodynamic and thermodynamic properties across a wide range of sizes (Svedberg and Pedersen 1940; et al. 2015). Being label-free and requiring only the initial sample without any additional matrix, AUC can be applied to a variety of substances ranging from small molecules to proteins, nucleic acids, carbohydrates, as well as synthetic polymers, nanoparticles, supramolecular complexes, and even whole organisms. Its core principle involves the application of a precisely defined centrifugal force on particles in a gravitational field, with sedimentation velocity (SV) being the most utilized AUC mode in recent years, primarily due to its ability to provide dynamic measurements of particle movement. While linearity is a fundamental feature of valid analytic measurement systems, the term itself is not specifically mentioned in CLIA. Instead, CLIA refers to three closely associated concepts: calibration, calibration verification, and reportable range. [1,3]
- Types of calibration: -
The nature, type and purpose of the measurement to be made will determine the type of calibration required.
-
- Direct Calibration
- Indirect Calibration
- Direct calibration:
- The response of the measuring device and the value of the standard are both expressed in the same quantity.
- Units of measurement are used to express the standard measurement indicator and the analytical balance indicator.[2]
- Indirect Calibration: -
- Another name for it is analytical Calibration.
- The standard value and the equipment answer have different magnitudes. The values that the measuring apparatus produces, known as signals or instrumental responses, differ from the properties of standards in terms of amount and are expressed in disparate units. A The result of the known measurement for each standard is used to determine the instrumental response, which is obtained with an indirect calibration technique
- Two examples of indirect calibration are calibrations with spectrophotometers and chromatographs. The height of the peak or the area of the peak and the concentration of the standard solution are related to the calibration of the chromatograph. The calibration spectrophotometer determines the correlation between the optical type (absorption, emission, wavelength, etc.) and the concentration of the standard solution. [2]
-
- Need for calibration:
-
- A novel tool.
- Following maintenance or modification, an instrument.
- Once a predetermined amount of time has passed.
- When a given period of time (the operation hours) has passed.
- Prior to, during, or following a crucial measurement.
- Following an incident, for instance.
- When a shock, vibration, or unfavorable situation has been experienced by an equipment that may have caused it to become misaligned, or hurt it.
- Unexpected variation in the climate.
- If there are any doubtful observations or mismatched instrument indications, output from substitute instruments.
- As required, e.g., by a customer specification or the recommendation of the instrument maker.
- When used generally, calibration is commonly understood to include the process of modifying a measurement instrument's output or indication to agree with the applied standard’s value, inside a given level of precision. An example of this would be calibrating a thermometer to find the indication error or correction and then adjusting it (for example, using calibration constant) so that it displays that accurate temperature in Celsius at given the scale points. This is how the final users of the instrument see it. But few instruments can be precisely tuned to match the criteria by which they are judged. Regarding the enormous, in most cases, the calibration procedure is truly a comparison between an unknown and an acknowledged standard, documenting the outcomes. [3]
-
- Calibration Standard:
Accredited companies use ISO 9001 as a quality benchmark for calibrating measurements. This process involves documenting each stage of the intricate operation. ISO 9001 is a quality management standard applicable to businesses in various industries.
For calibration, laboratories use the ISO/IEC 17025 quality standard, where IEC refers to the International Electrotechnical Commission. This standard ensures that the results are valid and align with the established values. [1]
-
- Importance of Instrument Calibration:
For effective use, instruments must be calibrated correctly. This aids in analyzing the accuracy of the instrument and adjusting it to the desired and appropriate precision for the given use and necessity. Calibration involves calibrating the equipment to measure the required range of values if it is outside of that range. This is the primary justification for why calibration—especially calibration of instruments—is crucial. When the precision of the instrument has an impact on the end product, it is crucial. Pharmaceutical companies also recognize the value of calibration.
When measuring the thickness of a wire, for instance, a screw gauge that has not been calibrated correctly would display zero error, which needs to be adjusted or corrected for in order to obtain an exact measurement. In the pharmaceutical sector, calibration is the same. The industry produces drugs that actively affect our immune systems, so the calibration procedure needs to be done with the utmost caution. When compared to the expense of calibration, the costs associated with using an uncelebrated instrument are exponential.
To examine the effects and requirements for concentration of the various pharmaceutical products, biological, chemical, or biochemical analysis can be performed. It is crucial to make sure that the instruments are calibrated appropriately for the purpose when utilizing other devices to analyses these items. [1]
-
- Application of Calibration:
Calibration is used in a wide range of applications in electronics, including
-
-
- Calibration is used in a wide range of applications in electronics, including:1. Calibration is used in manufacturing processes to maintain quality control throughout the production process and make sure that electronic devices and systems are generating accurate and consistent outputs. Scientific and medical research
- To guarantee that electronic instruments and systems used in research produce correct and trustworthy data, calibration is necessary.
- Environmental Monitoring: Used to confirm that electrical devices and sensors that detect temperature, pressure, humidity, and other variables produce accurate readings.
- English: Aerospace and Defense: In order to guarantee that electronic systems and equipment satisfy industry standards and regulations and generate accurate and trustworthy information, calibration is essential in the aerospace and defense sectors.
- Electricity generation and distribution: In the energy sector, calibration verifies that the electronic devices and systems used in electricity generating, transmission, and distribution give accurate and trustworthy measurements while adhering to rules and industry standards.
- Consumer electronics: Additionally, calibration is carried out [4]
- Advantages of Calibration:
- Save money: Profits will rise as costs are reduced, and waste is eliminated through standardization.
- Ensure Safety: Products and parts that have been calibrated operate as intended and are safe to use.
- Ensure Quality: Reliable production of standardized goods is possible with calibrated machinery and components.
- Shorten Production Time: Quality components save time when they are available to replace tolerance components.
Assure Compliance to Certification: It is guaranteed that all industry rules and business certifications will be followed.
- Determine Accuracy: Calibration will enable accurate product reporting.
- Prevent and predict process failure: Steady progress towards process conditions beyond tolerance can be detected using sensors that are accurate and dependable.[1]
- Disadvantages of Calibration:
- The primary drawback of calibration could be a loss of environmental control. Sensitive electronics may be affected if, for example, the room where the equipment is located cannot be properly controlled for temperature and humidity. [1]
- Calibration Of Pharmaceutical Instrument:
-
- UV Visible Spectrophotometer
- IR – Spectrophotometer
- Fluorimeter
- Flame photometry
- High performance liquid chromatography (HPLC)
- Gas Chromatography
- UV Visible Spectrophotometer:
UV visible spectroscopy, often known as UV spectroscopy, is the study of absorption or reflectance in portions of the electromagnetic spectrum that fall between the complete, nearby visible region and the ultraviolet. This analytical method calculates how much of each discrete UV or visible wavelength is absorbed or transmitted through the sample relative to the reference or blank sample. The sample mixture has an impact on the properties, providing information about the composition and concentration of the sample, perhaps. The UV spectrum is approximately between 100 to 450 nm, and the visible spectrum is approximately between 450 to 700 nm.[5]
-
- Calibration process of UV-visible spectroscopy:
- Ensure the power cable of the instrument is properly plugged into the socket and the cuvettes are clear.
- Turn on the device.
- Allow 15 minutes for it to warm up.
Keep the dummy cuvette in the sample holder's position.[1].
![Instrumentation of UV visible spectroscopy [6].png](https://www.ijpsjournal.com/uploads/createUrl/createUrl-20241207191623-11.png)
Fig 1: Instrumentation of UV visible spectroscopy [6]
• Different calibration parameters are:
• Control of absorbance:
Testing the absorbance at the UV wavelengths with a potassium dichromate solution yields the precise value of X (1%, 1cm) for each wavelength, as well as the allowable limits of a given absorbance. +0.01 is the absorption tolerance. Using potassium dichromate solution that has been UV dried to a constant weight at 130 degrees Celsius, 57.0 to 63.0 mg of potassium dichromate UV should be dissolved in 0.005 M sulfuric acid and then diluted to 1000 ml using the same acid in order to control the absorbance in between approximately 235 nm to 313 nm.[1]
• Limit of stray light:
• When comparing the absorbance of a 1.2% w/v potassium chloride solution in a 1 cm cell to water as a reference liquid, for instance, the absorbance of the solution should be more than 2.0 at approximately 200mm in order to detect stray light at the specified wavelength.[1]
• Resolution Power:
When we specified in a monograph, note the UV spectrum of a 0.02% v/v toluene in hexane solution. Unless the monograph specifies otherwise, the ratio of the absorbance at the maximum is approximately 269 nm, to that at the minimum approximately 256 nm, is not less than 1.5. [1]
• Holmium Perchlorate Solution:
• Melt 0.5 g of holmium oxide in 2.4 ml of perchloric acid, then dilute to 10 ml of H2O to obtain a solution of holmium per chlorate.
• Take note of the absorption spectra is approximately between 230 to500 nm.
-
- Take note of the Holmium perchlorate solution's spectra is approximately between 200 to 600 nm utilizing 1.4 M of perchloric acid as the benchmark.
- Record the wavelength maxima in relation to the approval criteria. [1]
- Holmium Filter:
- The Holmium filter works well for routine calibrations. The narrowest slit setting and slowest scan speed should be used to capture the absorption spectra is approximately between 490 to 250 nm. Recognizing one band at around 360.5 millimeters and three fused absorption bands centered at 452.2 nm.[1]
![UV Visible Spectrophotometer [7].png](https://www.ijpsjournal.com/uploads/createUrl/createUrl-20241207191623-10.png)
Fig 2: UV Visible Spectrophotometer [7]
Discharge Lamp:
-
- Low-pressure discharge lights are suitable.
- Pay attention to the mercury lamp's transmission spectrum, ranging from approximately 590 to 230 nm, beside the monochromator's entrance. Utilize the narrowest slit setting and the slowest scan speed achievable.
Mercury's primary emission lines are positioned at mm 579.0, 576.5, 435.8, 364.9, and 253.7.[1]
- IR Spectrophotometer:
- When infrared radiation passes through a sample, an infrared spectrophotometer measures the relative energy as a function of the infrared radiation’s wavelength or frequency. An analytical tool for material identification, particularly organic polymer identification, is the IR spectrophotometer. When infrared radiation passes through a sample, an infrared spectrophotometer measures the relative energy as a function
- Of the infrared radiation’s wavelength or frequency. IR spectrophotometry studies. chemical compounds or functional groups by measuring the interaction of infrared radiation with matter. Two types having an IR range of 22800–10 cm is dispersive infrared (DIR) and Fourier transform infrared (FTIR).
- The range of IR spectrophotometer is approximately between 2500 to 25000 nm.

Fig 3: Instrumentation of IR Spectrophotometer [8]
Process of Calibration of IR Spectrophotometer:
• Make sure the platform where the FT-IR equipment is mounted is clear of dust and clean.
• Verify that the power supply is connected to the instrument.
• Make that the units’ communication cords are connected correctly.
• Checks for the dry indicator should be made before the instrument is turned on. On the front, there are two indicators: a green lamp for electricity and an orange lamp for dryness. Even when it is turned off, the FT-IR interferometer’s dry indicator light indicates the humidity within
• Make sure the dry indication is on at all times.
• Prior to activating the device, the silica gel must also be checked.
• Checking the power spectrum. To do background scan measurement, click the (BKG Scan) icon. A power spectrum that was seen following scarving.
• After selecting the data tab, adjust the scan parameters, such as the number of scans and resolution.
• Resolution Tests for IR Spectrophotometer:
• To make it easier to compare with published reference spectra, certain pharmacopoeias prescribe Resolution Tests.
• These tests calculate the trough depth between two partially resolved peaks.
• This means that, in addition to the width at half height of isolated bands, which serves as the foundation for published instrument specifications, the results also depend on the geometry of the lines.
• Due to variations in default apodization function selections, spectrometers from different manufacturers may have varied line forms for the same nominal resolution.
• Despite the fact that variations don’t really matter for material identification, they have the power to determine whether a resolution test is passed or not.
• For instance, the band measures 1601 cm in width and half height, with a resolution of 4 cm.
• Although the depth of the trough at 1583 cm is reduced by 12%, this is increased by less than 0.3 cm when the apodization is changed from mild Norton-Beer to strong Norton- Beer.[1]
Fig 4: IR Spectrophotometer [9]
Fluorimeter:
- One tool for measuring parameters in the visible spectrum is a fluorimeter. The emission spectrum’s intensity and wavelength distribution following excitation by a certain light spectrum is known as fluorescence. In oceanography, fluorimeters are used to detect chlorophyll concentration based on the pigments in phytoplankton cells that glow when exposed to chlorophyll.[1]
The wavelength range of a fluorimeter is approximately between 210 to 890nm.
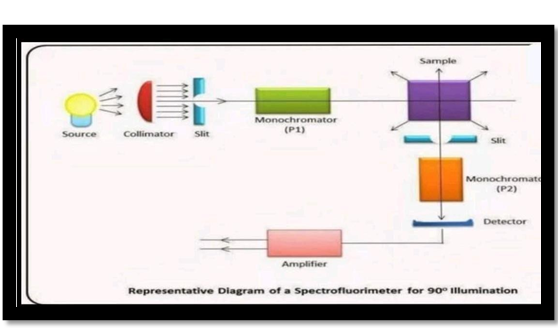
Fig 5: - Instrumentation Of Fluorimeter [10]
Process of Calibration of Fluorimeter:
-
-
- As stated in the MEASURE SETUP menu's CALIBRATION SETUP, make sure the proper cuvette(s), blank solution, and standard solutions are readily available before starting the calibration. Choose the necessary technique by following the instructions in the "Using a stored method" section.
- To start the calibration procedure, press the CAL key once when in measure mode. Place the cuvette with the blank solution, being careful not to mark the optical surfaces in the roomy chamber's cuvette holder and shut the lid.
- Press the CAL key or use the CAL option to measure the fluorescence of the blank attempt, displayed as highlighted on the instrument display. To verify, use the enter key.
- Throughout the measurement, the status message "Reading" will appear on the instrument screen.
- After finishing, a big number will appear on the screen representing the concentration zero, since this is the blank. The percentages of full-scale emission and the raw fluorescence for the signal and reference are shown below this.
There will also be changes to the options at the bottom of the screen. The calibration phase that was just finished is related to the ACCEPT and REPEAT options. Choose ACCEPT to proceed through the calibration sequence to the first standard if the concentration and other calibration data are accurate and satisfactory. Choose REPEAT and repeat the previous step if the data from the previous stage were.
unacceptable. By using ABORT, the instrument can be brought back to the measure screen and the entire calibration sequence can be cancelled.
-
-
- When the blank calibration is accepted, the instrument will display the message "Please insert standard xxx" along with the first standard concentration specified in the Measure/Calibration Setup's Standards Table.
- Close the sample chamber lid after removing the Blank solution cuvette and replacing it with the required standard cuvette. Use appropriate cleaning techniques if you are using reusable cuvettes to ensure no solutions are carried over. Removal of impurities
- Use the CAL key or the on-screen CAL option to calibrate the instrument with this initial standard, just as you did with the blank.
- Like the blank, the standard concentration (as specified in the STANDARD TABLE) will be shown on the screen along with the raw fluorescence and the full-scale emission percentages for the reference and signal.
- Review this data again, and if it's acceptable, select the ACCEPT option to proceed to any more calibration standards in the same way.
- This method of calibrating with each standard will be followed (points 10-15) until all established standards have been met. At this point, the device will display the raw fluorescence for each standard in a table to provide an overview of the calibration. A plot of the standards' concentration against their raw fluorescence can be seen at the bottom of the screen to observe the calibration curve.
- The instrument reverts to the measurement screen and status after the calibration summary message "Cal needed" has been eliminated.
Now, samples with unknown concentrations can be measured.[1]

Fig 6: Fluorimeter [11]
Flame Photometer:
- The flame photometer’s principle relies on measuring the intensity of light released upon the addition of a metal to the flame. Information about the element is provided by the colour’s wavelength, and information about the quantity of the element in the sample is provided by the flame’s colour. An analytical tool for measuring calcium, lithium, sodium, and potassium ions in bodily fluids is a flame photometer, which is used in clinical laboratories.[1]
The wavelength range of flame photometer is approximately between 210 to 790nm.
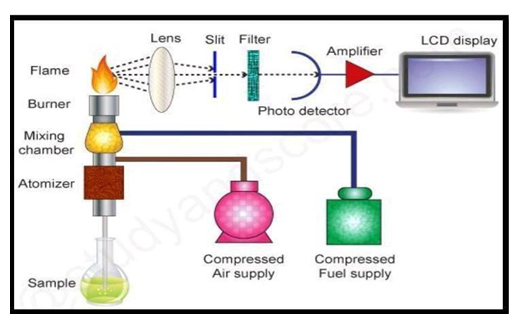
Fig 7: Instrumentation of flame photometer [12]
Process of Calibration of Flame Photometer:
When anything such as sodium or potassium is aspirated into a flame, an optical device known as a flame photometer is utilized to gauge the intensity of the color. The aim of the flame photometer measuring process is to measure the emission light of the sample.
![Flame Photometer [13].png](https://www.ijpsjournal.com/uploads/createUrl/createUrl-20241207191623-4.png)
Fig 8: Flame Photometer [13]
• Calibration Parameters are:
1) Compressor Readings: When the instrument's compressors were read to determine whether the involved pressure was within the typical range (14–30 psi) as stated by the manufacturer, the investigation discovered that 80% of the compressor was operating within the limit and 20% was operating above it. The pressure gauge regulates 20% of the compressor's pressure.
2) The Pressure Gauge Accuracy: In order to determine if the pressure gauges are accurate and if the regulated pressure is within the normal range as defined by the manufacturer, the pressure gauge control is monitored both before and after calibration using OPI in psi units. According to the examination, 90% of the pressure gauges were in good condition; the remaining 10% need replacement.
3) The sucking rate of the nebulizer: According to the manufacturer's instructions, the nebulizer's sucking rate should be between two and six milliliters per minute. High values of the sucking rate before calibration cause significant differences between pre and post calibration rates, as shown by paired samples T-test. Flame photometry's concept is that, for various concentrations, light released from the flame is directly linked to the inhaled species' concentration.
- To ensure standard and sample backgrounds match, a calibration curve is created using a standard solution with known component concentrations. Additional material may be added as necessary. The expected sample concentration determines the calibration curve's coverage, allowing readings to fall mid-curve.
- After plotting the calibration curve, sample concentration is determined by comparing values with the curve. Each element has a unique calibration curve, so separate curves must be created. Calibrating once and regular checks suffice for consistent estimations. Recalibrating an instrument is easy; set the top standard to match the initial calibration curve value and the blank solution to read zero.[1]
- HPLC (High Performance Liquid Chromatography)
- High Performance Liquid Chromatography, or HPLC for short, is the method used to separate the constituents of a liquid medium. Solvent (mobile phase) passes through a separation medium-packed column (stationary phase).
- High-performance liquid chromatography analysis of pharmaceuticals is used to track the effectiveness of a disease’s treatment, verify a drug’s identity, and offer quantitative data. [1]
The wavelength range for HPLC is approximately between 180 to 900nm.
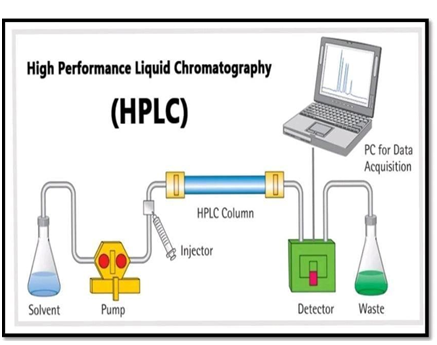
Fig 9: Instrumentation HPLC [14]
Process Of Calibration of HPLC:

Fig 10: HPLC Instrument [15]
-
- Various Calibration Parameters Are:
- Accurate flow rate
- Accuracy of the injector
- Accuracy of the system
- Accurate wavelength
- Linearity of detectors
- Linearity of the injector
- Gradient performance evaluation
- Accurate temperature readings in a column oven
- Accurate Flow Rate:
- Fill Mill Q water into each solvent line to prime it.
- A flow rate of 0.500 ml/min should be set.
- To stabilize the system and ensure stable pressure, wait for about fifteen minutes. Simultaneously insert the outlet tube into the 10-milliliter volumetric flask and start the stopwatch.
- When the lower meniscus reaches the flask’s 10 milliliter mark, stop the stopwatch. Note the elapsed time.
Analyze the flow at 1.0 ml/min in the same manner. Acceptance Criteria: The water collection time should fall within a range of minus 2.0% of the total time.
-
- Accuracy of the Injector:
- Join the connection between the pump and detector inlet.
- Prepare the mobile phase, a 70:30v/v combination of methanol and water.
- Choose a run time of one minute and a flow rate of 0.5 ml/min.
- Set the column temperature to 25±2 degrees Celsius.
- Fill a standard HPLC vial with Milli-Q water to a 2/3” depth. Securely seal the vial with a cap.
- Weigh the vial, then note the weight in grams (W).
- After placing the vial into the chromatographic apparatus, inject 50 microliter volumes from it.
- Weigh the vial again and record the weight as W after the injections. We need to determine the average amount injected for each injection. The average injection volume (microliters) (W, W) is 100/6.[1]
- Acceptance Criteria: The mean injected volume should be 50.01.0 microliters.
- Accuracy of System:
- Standard Preparation:
- Weigh precisely and measure out 60 mg of caffeine into a 100 ml volumetric flask. Dissolve in the mobile phase and dilute to volume. Pour 10 milliliters of this mixture into a 100-milliliter volumetric flask, then dilute it with the mobile phase to the desired volume.
- Procedure:
- Six duplicates of the standard preparation are made after injecting the blank. Make a note of the locations and durations of retention. Now determine the retention time and peak areas percentage RSD for the repeated injections.
- Acceptance Criteria: The retention time and peak areas for the 5 RSO,PR should be less than 1.0%.
- Accurate Wavelength:
- Create an instrument method using the wavelength in nm, inject a blank, proceed with standard preparation, and record the absorbance height.
- Acceptance Criteria: A maximum absorbance of ±2 nm is required.
- PDA Detector Accuracy:
Choose the 3D mode and specify between 200 to 400 nm wavelength range.
-
-
- Inject 20 microliters of the standard preparation once into the chromatographic apparatus.
- Extract and record chromatograms at wavelengths of 202 to 208 nm with an interval of 1 nm and 269 to 275 nm with an interval of 1 nm. Note down the height or absorption.
- Acceptance Criteria: A maximum absorbance of 205 ± 2 nm and 272 ± 4 nm is recommended.
- Linearity of Detector:
- Standard Preparation: Weigh exactly 60 milligrams of caffeine and transfer it into a flask with a volume of 300 ml. Use mobile phase to dissolve and dilute the volume.
- Detector linearity Solution 1 (0.06 mg/ml) = Fill a 100 ml volumetric flask with 10 ml of the standard preparation, then dilute with mobile phase to the desired volume.
- Detector linearity Solution 2 (0.48 mg/ml) = Transfer 8 ml of the standard preparation into the volume using the mobile phase in a 100 ml volumetric flask and dilute it.
- Detector linearity Solution 3 (0.03 mg/ml) = Pour 5 ml of the standard preparation into a 100 ml volumetric flask, then use mobile phase to dilute it to the desired volume.
- Detector linearity Solution 4 (0.24 mg/ml) = Pour 4 ml of the standard preparation into a 100 ml volumetric flask and use mobile phase to dilute it to the appropriate volume.
- Detector linearity Solution 5 (0.012 mg/ml) = Pour 2 milliliters of the standard preparation into a 100-milliliter volumetric flask and use mobile phase to dilute it to the desired volume.
- Procedure:
- After injecting a blank, inject detector linearity solutions, and record the caffeine standards peak responses. Plot the concentration vs the peak responses.
- Acceptance Criteria: Regression coefficient (R2) must be greater than 0.9 and the plot must be linear.
- Injector Linearity:
- Standard Preparation:
- Weigh precisely and add approximately 60 milligrams of caffeine to a 100 ml volumetric flask.
- Utilize the mobile phase to dissolve and dilute to the volume.
- Transfer 10 ml of the standard preparation into a 100 ml volumetric flask, then dilute with mobile phase to the desired volume.
- Procedure:
Inject 5 microliters of blank mobile phase.
-
- Inject 5 microliters, 10 microliters, 20 microliters, 50 microliters, and 80 microliters of the standard preparation. Record the peak areas. Plot the injected volume against the peak areas on a curve.
- Acceptance Criteria: The plot should be linear with a regression coefficient of at least 0.9.
- Gradient Performance Check:
- To 1000 milliliters of methanol, add 5 milliliters of acetone, then degas. Link the detector and pump together via a union. Assign the wavelength of the detector to 254 nm.
- Pour methanol into channels A and C, then acetone (0.5% of methanol) into channels B and D. A binary gradient should be set with a total flow rate of 2.0 ml/min. Individually set the gradient programs for A, B, C, and D.
- For around five minutes, purge every channel at a flow rate of two milliliters per minute. Determine the flow rate and hold off until the baseline stabilizes. After setting the gradient profiles for A and B, inject 0.0 volume of methanol to execute the gradient profile.
- Note the peak heights. Determine the percentage of other peaks' heights. Check the performance of the gradient for C and D. Determine how many peaks are formed when D is present at 100% concentration of 100 and find the other peaks' 5% height.
- Calculation:
- Height % of B/D = Height of B/D peak * 100 / Height of full-scale peak
- Acceptance Criteria: It should be within -1.0% of the set composition for the computed percentage composition (Height 7%).
- Column Oven Temperature Accuracy:
- A calibrated digital thermometer is used to assess it at 30 and 60 degrees Celsius.
- Insert the thermometer probe into the column and adjust the temperature of the oven to 30 degrees Celsius.
- Wait until the temperature stabilizes. Note the temperature displayed on the thermometer. Similarly, test the temperature precision of the column oven at 60 degrees Celsius.
Acceptance Criteria: The thermometer display should show an oven temperature that is within ±2 degrees Celsius of the set temperature.
- Gas Chromatography:
- The method of separating substances in a mixture, known as gas chromatography, involves injecting a liquid or gaseous sample into the mobile phase, also known as the carrier gas, and then passing the gas through a stationary phase. In order to separate and identify the components of a volatile sample, the mobile phase is typically an inert gas or an unreactive gas such as helium, argon, nitrogen, and hydrogen.
The wavelength range for gas chromatography is approximately between 110 to 450 nm.

Fig 11: Instrumentation of Gas Chromatography [1]
Process of Calibration of Gas Chromatography:

Fig 12: Gas Chromatography Instrument [18]
- Various Calibration Parameters Are:
- Flow Rate Accuracy
- Column oven Temperature Accuracy
- System Precision
- System Precision for Head Space Auto Sampler Detector Linearity
- Detector Noise and Drift Test
- Flow Rate Accuracy:
- Attach the detector outlet port to the digital flow meter.
- Wait until the carrier gas (helium) flow reaches the predetermined flow.
- Next, take note of the flow that was seen in the replicate.
- For different carrier gases, such as hydrogen and air, repeat these steps.
- Note the outcome in the procedure for GC calibration.
- Acceptance Criteria: Carrier gas flow rate should be within +/- 10% of the target flow.[1]
- Column Oven Temperature Accuracy:
- Connect the detector port and the column. (Column)
- Adjust the column oven temperature to 40 degrees Celsius and place the thermometer probe inside the column oven.
- Allow time for the temperature to stabilize.
- Record the temperature measured by the probe three times over a ten-minute period.
- Repeat the process for temperatures of 100, 150, and 190 degrees Celsius.
- Acceptance Criteria: The thermometer should display an oven temperature within +2 degrees Celsius of the set temperature.[16]
- System Precision:
- Preparation of Standards Solution: Fill a 100 mL volumetric flask with 20 mL each of methanol, ethanol, and acetone to create ethyl acetate.
- Procedure:
- Inject blank, then standard preparation six times. Record the regions and durations of retention.
- Acceptance Criteria: Peak area should not exceed 5.0%, and the N RSD of retention duration should not exceed 1.0%.[16]
- System precision for headspace autosampler detector linearity:
- Preparation of standard solutions.
- Detector linearity Solution A: Take 10 ml of methanol, ethanol, and acetone each into a 100-milliliter volumetric flask, then dilute with ethanol to the desired volume.
Detector linearity Solution B: Transfer 15 ml of methanol, ethanol, and acetone into a 200.
ml volumetric flask and dilute with ethyl acetate to the desired level.
-
- Detector linearity Solution C: Transfer 20 ml of methanol, ethanol, and acetone into a 100-milliliter volumetric flask, then dilute with ethanol to the desired volume.
- Detector linearity Solution D: Transfer 25 ml of methanol, ethanol, and acetone into a 100 ml volumetric flask, then dilute with ethyl acetate to the desired volume.
- Detector linearity Solution E: Add 30 milliliters of acetone, ethanol, and methanol into a 100 ml volumetric flask, then dilute with ethyl acetate to the desired volume.
- Procedure:
- After injecting a blank, add detector linearity solutions, and note the peak response.
- Plot the concentration against the peak responses using a conventional method.
- Acceptance criteria: Regression coefficient (R2) should not be less than 0.99 and the plot should be linear.[16]
- Detector Noise and Drift Test:
- Once the GC is prepared, run the system for up to 15 minutes. Compute the noise and drift test after the run is over.
- Acceptance Criteria: Maximum noise threshold of 100 millivolts and maximum drift threshold of 2500 millivolts per hour.
CONCLUSION:
-
- Appropriate calibration of instruments is necessary to achieve precise outcomes. This is really crucial in the pharmaceutical industry since they immediately affect the finished product and its ensuing consequences. In order to make sure the instrument is appropriate for the intended use, instruments are typically calibrated before being used for the first time, especially when the measurements appear dubious or in the event of an abrupt shock.
- It is impossible to overstate how important instrument calibration is to various sectors. Any industry using machines and instruments to produce goods should follow this set protocol, which is the most basic but equally important maintenance requirement. Because calibration is so important to the process, it should be done on a regular basis or as needed. However, it cannot be neglected for any reason. Proper calibration of instruments results in increased efficiency and consistently high-quality goods for ends
- A strong Calibration Program ensures:
- Highly efficient lab
- Reliable results
- Quality Product
- Patients' safety
- Save money
- Shorten Production time
- Assure Compliance to Certification
o Determine accuracy
o Prevent and predict process failure
• By guaranteeing the accuracy of the test apparatus, calibration reduces any measurement uncertainty. To an acceptable degree, calibration measures and regulates errors or uncertainties in measuring operations. Consequently, it can be said that calibration is a necessary process for all instruments utilized in laboratories and industry, and it shouldn’t be disregarded or skipped. The kind of calibration required will vary based on the kind of instrument. More regular calibrations are needed for instruments carrying out crucial tasks. Calibration can by guaranteeing the accuracy of the test apparatus, calibration reduces any measurement uncertainty. To an acceptable degree, calibration measures and regulates errors or uncertainties in measuring operations. Consequently, it can be said that calibration is a necessary process for all instruments utilized in laboratories and industry, and it shouldn’t be disregarded or skipped. The kind of calibration required will vary based on the kind of instrument. More regular calibrations are needed for instruments carrying out crucial tasks. Calibration can lower expenses, minimize dangers and safety hazards, extend the life and performance of an instrument, and guarantee that your company provides accuracy and client satisfaction. lower expenses, minimize dangers and safety hazards, extend the life and performance of an instrument, and guarantee that your company provides accuracy and client satisfaction.
REFERENCES
-
-
-
- https://www.studocu.com/in/n/74921096?sid=0172200445
- T.Sudha, S.Tamizhselvi , Calibration of analytical instruments, world journal of pharmacy and Pharmaceutical Sciences, Volume 10, issue 4, Chennai, Tamil Nadu, Department of Pharmaceutical Analysis, Adhiparasakthi College of Pharmacy Melmaruvathur 2021.
- Aparna CH, Gowrisankar D. A REVIEW ON CALIBRATION OF ANALYTICAL INSTRUMENTS. International Journal of Pharmaceutical, Chemical & Biological Sciences. 2015 Jul 1;5(3).
- https://www.electronicsforu.com/technology-trends/calibration-definition-types-process- challenges-applications
- https://www.technologynetworks.com/analysis/articles/uv-vis-spectroscopy-principle- strengths-andlimitations-and-applications-349865
- https://jascoinc.com/learning-center/theory/spectroscopy/uv-vis- spectroscopy/instrumentation/
- https://mages.app.goo.gl/qaCuE99RRwVivLbNA
- https://www.shutterstock.com/image-vector/spectrometer-scientific-instrument-used- separate-measure-2281925855
- http://www.chem.ucla.edu/~harding/IGOC/I/infrared_spectrophotometer.html
- http://www.chem.ucla.edu/~harding/IGOC/I/infrared_spectrophotometer.html
- https://www.slideshare.net/slideshow/flourescence-spectroscopy- 83235286/8323528611)Je
- Jenway 632-001 Sipper Pump with Inlet and Outlet Tubing for 62-Series Fluorimeter. 230V, 12 mL/min. https://amzn.asia/d/dnLJPjZ
- https://www.slideshare.net/slideshow/flame-photometry-238394014/238394014
- https://www.systonic.in/product/microprocessor-flame-photometers/
- https://pharmabeginers.com/good-chromatography-practices-sop-guideline
- https://www.tradeindia.com/products/liquid-chromatography-system-1794439.html16) B.Gowthami, Gattu Venkateshwarlu, P.Venkateshwarlu. Calibration and validation of HPLC, GC, UV- VIS Spectroscopy. International journal of modern chemistry and Applied science, 2014; 1(4): 27-34.
- https://www.slideshare.net/slideshow/chromatography-types-of-chromatography-and- column-chemistrypallavipptx/267259951


 10.5281/zenodo.14293875
